Authors
Guilherme Breitsameter1 Ana Elizabeth Figueiredo2 Daiana Saute Kochhann3
1Unidade de Hemodiálise
do Hospital São Lucas da Pontifícia Universidade católica do rio Grande do Sul – HSL-PUC/RS; Unidade de Hemodiálise do Hospital de Clínicas de Porto Alegre.
2Unidade de Hemodiálise
do HSL-PUC/RS; Faculdade de Enfermagem, Nutrição e Fisioterapia – FAENFI- PUC/RS.
3Clinirim – Clínica de
Doenças Renais de Porto Alegre, Brasil.
Submitted on: 04/04/2011 Approved on: 10/20/2011
Correspondence to:
Guilherme Breitsameter Avenida João Carlos Bertussi da Silva, 115 – Jardim Itu Sabará Porto Alegre – RS – Brazil Zip code 91220-270 E-mail: guilhermebreit@ hotmail.com
This study was undertaken at the HSL–PUC/RS. The authors report no conlict of interest.
R
ESUMOIntrodução: A qualidade da diálise ofer-ecida aos pacientes em diálise pode ser mensurada pelo Kt/V, o qual pode ser calculado de diversas maneiras. Objetivo:
Comparar os resultados de Kt/V obtidos por meio das fórmulas de Lowrie (L) e de Daugirdas (D) com os resultados men-surados pelo monitor de clearence on-line – Online Clearence Monitor (OCM). Método: Estudo observacional trans-versal com 59 pacientes em hemodiá-lise (HD). Os dados foram coletados na mesma sessão de diálise: (ureia pré-diálise e pós-diálise) e o resultado de Kt/V foi obtido pelo OCM da máquina Fresenius 4008S (Fresenius Medical Care AG, Bad Homburg, Alemanha). Resultado: Foram analisadas 95 sessões, em que prevaleceu o sexo masculino, 56% (33), com idade média de 57 + 14 anos. A hipertensão ar-terial com 42% (25), diabetes com 12% (7) e glomerulonefrite com 8% (5) foram as causas mais frequentes da doença re-nal crônica (DRC). O Kt/V médio obtido pela fórmula de L, de D e pelo OCM foi de 1,31; 1,41 e 1,32, respectivamente. A comparação entre as fórmulas de L e D mostra que há diferença estatística p = 0,008 com a correlação de Pearson de 0,950. Entre D e OCM a diferença tam-bém é significativa: p = 0,011 e r = 0,346, provavelmente devido a perda convectiva, avaliada pela equação de D e não obser-vadas por OCM e L. A comparação entre L e OCM não foi significativa p = 0,999 e r = 0,577. Conclusão: Os dados sugerem que o OCM pode ser utilizado como um norteador para ajuste da dose de diálise em tempo real.
Palavras-chave: Diálise. Insuficiência Renal Crônica. Controle de Qualidade.
A
BSTRACTIntroduction: The quality of delivered di-alysis can be measured by the Kt/V ratio, which can be calculated in various ways.
Objective: To compare the Kt/V ratio ob-tained with the formulas of Lowrie (L) and Daugirdas (D) with the results meas-ured by an Online Clearance Monitor (OCM). Method: Observational, cross-sectional study of 59 patients on hemo-dialysis (HD). Data were collected in the same dialysis session (predialysis and postdialysis urea) and Kt/V was calculated by the OCM of the Fresenius 4008S ma-chine (Fresenius Medical Care AG, Bad Homburg, Germany). Results: A total of 95 sessions were assessed, with a predom-inance of males 56% (33), and a sample mean age of 57 + 14 years. Hypertension (42%; n = 25), diabetes (12%; n = 7) and glomerulonephritides (8%; n = 5) were the most frequent causes of chronic kid-ney disease (CKD). Mean Kt/V values obtained with the L and D formulas and the OCM were 1.31, 1.41 and 1.32, re-spectively. Comparison between the L and D formulas showed a statistically significant difference (p = 0.008), with a Pearson`s correlation of 0.950. The dif-ference between the D formula and the OCM was also significant (p = 0.011 and r = 0.346), probably due to convec-tive loss, estimated by the D formula but not by the OCM and L formula. The dif-ference between the L formula and the OCM was not significant (p = 0.999 and r = 0.577). Conclusion: These data suggest that the OCM can be used as a guide to the real-time adjustment of the dialysis dose.
Keywords: Dialysis. Renal Insufficiency, Chronic. Quality Control.
Calculation of Kt/V in haemodialysis: a comparison
between the formulas
I
NTRODUCTIONThe incidence and prevalence of chronic kidney
dis-ease (CKD) have incrdis-eased at an alarming rate.1
Because several studies have demonstrated a correlation between hemodialysis (HD) dose and morbidity and mortality, the former must be meas-ured in order to estimate whether CKD patients on HD are being adequately treated. Although symp-toms and signs are important indicators, they are not sensitive or specific enough to precisely moni-tor the HD dose.2
The following formulas have been used to quantify the dose of dialysis: urea reduction ratio (URR), Kt/V single pool (spKt/V) and equilibrated Kt/V (eKt/V). In the Kt/V ratio, the dialyzer urea clearance (K) is multiplied by dialysis time (t), the product being then divided by the patient`s urea distribution volume (V). K depends on dialyzer size, blood flow rate and dialysate flow. Although t normally ranges between 3 and 4 hours (180-240 minutes per dialysis session), it can be adjusted. The patient`s urea distribution volume (V) corre-sponds to approximately 50% of body weight, and may be more precisely estimated with an anthropo-metric equation which considers gender, age, height
and weight (Watson`s equation, for example).3,4
The adequate standard HD dose is estimated for patients undergoing three sessions a week. Dialysis
adequacy is set by the National Kidney Foundation
Disease Outcomes Quality Initiative (NKF-DOQI) guidelines, which recommend that spKt/V should be kept over 1.2.2
A DOQI-approved method for Kt/V calculation is Daugirdas`s formula (1996): spKt/V = - ln(R – 0.008 x t) + ( 4 – 3.5x R) 0.55 x UF/V, in which R is predialysis urea/postdialysis urea, t is dialy-sis time in hours, - ln is the negative natural loga-rithm, UF is weight loss in kilograms and V is the anthropometric urea distribution volume in liters, which may be calculated with Watson`s equation or simply estimated as 0.55 X postdialysis weight.3,4
Another option is to use Lowrie`s formula (1983):
Kt/V = ln predialysis urea/postdialysis urea.5
NKF-DOQI and Brazilian guidelines have rec-ommended that the dialysis dose should be con-trolled, with blood samples, at least once a month.2
However, there are now dialysis machines that provide on-line real-time monitoring of dialysis ef-ficiency, by showing Kt/V on the screen. On-line clearance monitors (OCMs) measure the difference of conductivity between the dialysis fluid entering
and leaving the dialyzer, through the difference of electrolyte concentration. This measurement is used to calculate the ionic dialysant, which is very close to effective urea clearance, as long as dialysant flow, blood flow and blood electrolyte composition are kept constant during measurement time. This method, which is easy to use and has low cost, is based on the assumption that sodium clearance equals urea clearance.2,6
This non-invasive method for Kt/V determina-tion is unlikely to substitute for routine blood sam-pling, although OCMs provide an opportunity for monitoring unstable patients, chiefly in relation to dialysis quality, through verification of the Kt/V at the end of each dialysis session, with prompt prob-lem identification and early resolution.7
Therefore, the purpose of this study was to com-pare Kt/V results obtained with Lowrie`s formula (L Kt/V) with those obtained with Daugirdas`s for-mula (D Kt/V), and the latter with OCM-measured results (OCM Kt/V).
M
ETHODThis was an observational, quantitative study un-dertaken at the Hemodialysis Unit of the Hospital São Lucas of the Pontifícia Universidade Católica do Rio Grande do Sul (HSL-PUC/RS), Brazil.
The sample was composed of all CKD patients on HD at the unit. Patients under 18 years of age were excluded from the study.
Data were collected from laboratory exams and Kt/V results obtained from the Fresenius 4008S HD machines (Fresenius Medical Care AG, Bad Homburg, Germany) equipped with an OCM, on the same day blood sampling occurred. The stan-dard dialysate flow, in all machines, was 500 ml/ min. Each patient underwent two blood samplings, which were performed on the second dialysis ses-sion of the first week of the month, for two weeks. Blood sampling occurred at two time-points: in the first minute of dialysis a blood sample was ob-tained from the arterial line of the extracorporeal system (predialysis sample); the second sample was obtained soon after the prescribed dialysis time was completed. Blood pump flow was re-duced to less than 100 ml/min, for two minutes, accoding to the unit`s protocol. Only then was the sample obtained from the arterial line (postdi-alysis sample).
between sessions, height, age, sex, blood flow and hematocrit.
We used descriptive statistics and categorical data, described as frequencies and percentages. Continuous variables were described as means and standard deviations when there was a normal distribution. Comparison between the formulas was made through variance analysis (ANOVA), with identification of the differences through Bonferroni`s test, with significance set at p < 0.05. The Statistical Package for the Social Sciences ver-sion 17.0 (SPSS) program was used for the statisti-cal statisti-calculations.
The study was approved by the Ethics Committe of the HSL-PUC/RS (protocol 10/05098).
R
ESULTSWe assessed 95 HD sessions of a total of 59 pa-tients, 95% of the sessions lasting 4 hours.
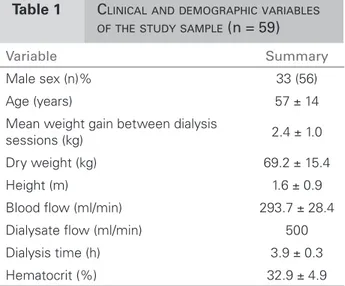
The cnincal and demographic variables of the sample are presented in Table 1. Table 2 shows the distribution of the patients according to their underlying disease.
ANOVA between the formulas showed a sta-tistically significant difference (p = 0.003). Mean L Kt/V, obtained through blood samples, was 1.31 (± 0.24). Mean second-generation D Kt/V was 1.41 (± 0.26). Although there was a signifi-cant difference between these results (p = 0.008), the formulas had a good Pearson`s correlation of 0.950 (p< 0.000).
Mean second-generation D Kt/V, obtained
through blood samples, was 1.41 (± 0.26). Mean
non-invasive OCM Kt/V was 1.32 (± 0.30).
Comparison between D Kt/V and OCM Kt/V showed a statistically relevant significance (p = 0.011) and a low Pearson`s correlation of 0.346 (p< 0.001).
Comparison between L Kt/V and OCM Kt/V dis not show statistical significance (p = 0.999) and had an adequate Pearson`s correlation of 0.577.
D
ISCUSSIONIn this study there was a predominance of men (56% of the sample), a result which, along the mean age, is similar to that of other studies.8 Our
results are in agreement with the 2010 census undertaken by the Brazilian Nephrology Society, which showed that 57% of the Brazilian popula-tion on HD is composed of men, the male sex be-ing a risk factor for CKD. In addition, 35.2% of
the dialysis population have hypertension as their main underlying disease, followed by diabetes mellitus in 27.5% of the cases.1,9
Our study also showed hypertension as the main underlying disease (42%), followed by dia-betes mellitus (12%), glomerulonephritides (8%) and polycystic kidney disease (7%). A previous study undertaken in the south of Brazil found hypertension as the underlying disease in 36.7% of all CKD cases, with diabetic nephropathy
ac-counting for 31.4%.8
In this study, mean hematocrit was 32.9%, which is equivalent to a hemoglobin concentration of 11g/dl, slightly under what is recommended in the literature. Another study undertaken in Porto Alegre, at another dialysis unit, showed hema-tocrit values very close to ours (mean 33.5%).10
Notwithstanding, the UK Renal Association guidelines recommend that hemoglobin should
Table 1 CLINICAL AND DEMOGRAPHIC VARIABLES OF THE STUDY SAMPLE (n = 59)
Variable Summary
Male sex (n)% 33 (56) Age (years) 57 ± 14 Mean weight gain between dialysis
sessions (kg) 2.4 ± 1.0 Dry weight (kg) 69.2 ± 15.4 Height (m) 1.6 ± 0.9 Blood low (ml/min) 293.7 ± 28.4 Dialysate low (ml/min) 500 Dialysis time (h) 3.9 ± 0.3 Hematocrit (%) 32.9 ± 4.9
Source: Data collected by the researcher.
Note: The data are presented as means ± standard deviations, frequencies, absolute numbers and percentages.
Source: data collected by the researcher.
Note: The data are presented in absolute numbers and percentages.
Underlying disease n (%)
Hypertension 25 (42) Diabetes mellitus 7 (12) Glomerulonephritides 5 (8) Polycystic kidneys 4 (7) Other diseases 11 (19) Not reported 7 (12)
be kept between 10 and 12 g/dL in CKD patients stages 4 and 5, with the use of stimulants of erythropoiesis.11
Research has demonstrated that weight gain over 2.5 kg was associated with increases of both systolic and diastolic predialysis blood pressure.12
Our patients had a mean interdialytic weight gain of 2.4 kg (± 1.03).
Dialysis dose is a good marker of dialysis qual-ity. It is thus essential to know the actual dialy-sis dose that is being delivered at each session.2
According to the DOQI guidelines, the minimum value recommended for three sessions a week is a Kt/V over 1.2.2
Our Kt/V results are, on average, in accordance with what is advised, being 1.31 (± 0.24) for Lowrie, 1.41 (± 0.35) for Daugirdas and 1.32 (± 0.29) for OCM. There was a significant difference between the D Kt/V and L Kt/V and OCM Kt/V.
A Spanish study observed that concordance be-tween D Kt/V and Kt/V obtained with other formu-las varies. Because Daugirdas formula overestimates Kt/V in comparison with Lowrie`s, the authors pro-posed a 1997 K/DOQI criterion, according to which dialysis is considered adequate when D Kt/V is 1.2 or above and L Kt/V is 1.0 or above.6
This probably occurs because Daugirdas`s for-mula includes convective loss, that is the weight difference divided by the distribution volume.3 On
the other handn Lowrie`s formula and the OCM as-sess diffusive loss only. The weak correlation be-tween the OCM and Daugirdas`s formula may be accounted for by the different types of transport. OCM Kt/V is diffusive while D Kt/V is convective. Lowrie`s formula and OCM have good correlation, possibly due to the same transport mechanism (dif-fusive) they assess.
Another Spanish study compared OCM Kt/V and D Kt/V (second generation), but in hemodiafiltration sessions of chronic patients. There was good corre-lation (r = 0,952), with mean OCM Kt/V of 1.49 + 0.54/session and D Kt/V of 1.74 + 0.58/session.13
The difference we found, in comparison with the Spanish study, may be attributed to hemofiltration, which has greater convective loss, partially deter-mined by dialysate flow (800 ml/min), ultrafiltrate, blood flow and procedure time.13 In our study, the
dialysate flow was 500 ml/min, and only hemodialy-sis sessions were assessed.
Kt/V is very important for the assessment of dialy-sis quality and adequacy. Each formula has its own relevant characteristics, Lowrie`s formula being simple,
easily understood and readily acceptable. Although more complex, Daugirdas`s formula is widely used, as it includes individualized information such as height, weight and blood flow. These data are also included in the OCM measurements, but with the added bonus of providing real-time Kt/V values, which allow prompt interventions to increase Kt/V should the need arise.
C
ONCLUSIONThe data suggest a statistically significant difference between the results obtained with Daugirdas`s for-mula and those obtained with Lowrie`s forfor-mula and the OCM.
Our study demonstrated that although these for-mulas may lead to deifferent results, there is good cor-relation between them. The important goal is not to compare results from different formulas or identify the best one, but set a standard for the formula in use. We confirmed that OCM is a practical instrument for daily use, to complement the other formulas, helping to adequate the dialysis dose delivered to reach excel-lent patient`s benefit. It should be highlighted, how-ever, that the patient`s clinical picture is above any formula and should be the ultimate guide to dialysis adequacy.
R
EFERENCES1. Barros E, et al. Nefrologia: rotinas, diagnóstico e tratamento. 3a ed. Porto Alegre: Artmed; 2006. 2. National Kidney Foundation NKF/DOQI.
Clinical practice guidelines and clinical practice recommendations, 2006 updates hemodialysis adequacy, peritoneal dialysis adequacy, vascular access. Am J Kidney Dis 2006;48(Suppl):S1.
3. Daugirdas JT, et al. Prescrição de hemodiálise crônica: uma abordagem da cinética da uréia. In: Daugirdas JT, Ing TS. Manual de diálise. 3a ed. Rio de Janeiro: Medsi; 2003. Cap. 9.
4. Watson PE, et al. Total body water volumes for adult males and females estimated from simple anthropometric measurements. Am J of Clin Nutr 1980;33:27-39. 5. Lowrie EG, et al. Principles of prescribing dialysis
therapy: implementing recommendations from the National Cooperative Dialysis Study. Kidney Int 1983;23(Suppl):113-22.
6. Teruel JL, et al. Utilidad de la dialisancia iônica para control de la dosis de diálisis. Experiência de um ano. Nefrologia 2003;23:444-50.
7. Uhlin F, et al. Dialysis dose (Kt/V) and clearance variation sensitivity using measurement of ultraviolet-absorbance [Internet], blood urea, dialysate urea and ionic dialysance. Nephrol Dial Transplant 2006;21:2225-31
9. Sociedade Brasileira de Nefrologia (SBN). Censos. Censo Brasileiro de Diálise 2010. [cited 2011 Oct 17]. Available from: http://www.sbn.org.br/index. php?censoAdmAtual&menu=24.
10. Morsch C. Avaliação da qualidade de vida e de indicadores assistenciais de pacientes renais crônicos em tratamento hemodialítico [master’s thesis]. Porto Alegre: Faculdade de Medicina, Universidade Federal do rio Grande do Sul; 2002.
11. RA Clinical Practice Guidelines - Anemia CKD, The Renal Association UK. [cited 25 Mar 2011] Available from: http://www.renal.org/Clinical/GuidelinesSection/ AnaemiaInCKD.aspx.
12. Pinheiro ME, et al. Hipertensão arterial na diálise e no transplante renal. J Bras Nefrol 2003;25:142-8. 13. Maduell F, et al. Monitoring hemodialysis dose with