Contents lists available atScienceDirect
Talanta
journal homepage:www.elsevier.com/locate/talanta
Physicochemical characterization of
Lavandula
spp. honey with FT-Raman
spectroscopy
Ofélia Anjos
a,b,c,⁎, António J.A. Santos
b, Vasco Paixão
d, Letícia M. Estevinho
e,f aInstituto Politécnico de Castelo Branco, 6001-909 Castelo Branco, PortugalbCentro de Estudos Florestais, Instituto Superior de Agronomia, Universidade de Lisboa, 1349-017 Lisboa, Portugal cCentro de Biotecnologia de Plantas da Beira Interior, 6001-909 Castelo Branco, Portugal
dBruker Portugal Lda, 2771-203 Paço de Arcos, Portugal
eAgricultural College of Bragança Polytechnic Institute of Bragança, 5301-855 Bragança, Portugal
fCentre of Molecular and Environmental Biology, University of Minho, Campus de Gualtar, 4710-057 Braga, Portugal
A R T I C L E I N F O
Keywords:
FT-Raman Honey
Lavandulaspp. Chemical composition Quality control PLS regression models
A B S T R A C T
This study aimed to evaluate the potential of FT-Raman spectroscopy in the prediction of the chemical com-position ofLavandulaspp. monofloral honey. Partial Least Squares (PLS) regression models were performed for the quantitative estimation and the results were correlated with those obtained using reference methods.
Good calibration models were obtained for electrical conductivity, ash, total acidity, pH, reducing sugars, hydroxymethylfurfural (HMF), proline, diastase index, apparent sucrose, totalflavonoids content and total phenol content. On the other hand, the model was less accurate for pH determination. The calibration models had high r2(ranging between 92.8% and 99.9%), high residual prediction deviation - RPD (ranging between 4.2 and 26.8) and low root mean square errors.
These results confirm the hypothesis that FT-Raman is a useful technique for the quality control and chemical properties’evaluation ofLavandulaspp honey. Its application may allow improving the efficiency, speed and cost of the current laboratory analysis.
1. Introduction
Honey is a natural food product produced by honey-bees that pos-sesses a high amount of available sugars[1] and is a rich source of amino acids, vitamins, minerals and other biologically active com-pounds [2]. Honey carbohydrates are composed up of about 70% monosaccharides (mainly glucose and fructose), 10–15% disaccharides and a minor concentration of trisaccharides[1]. The chemical compo-sition of this beehive product depends on the botanical and geo-graphical origin [3], which may be evaluated through several meth-odologies.
Usually, a sample is classified asLavandulaspp. monofloral honey (common name: Lavender honey) when the percentage of pollen grains fromLavandulaspp. is higher than 15%[4,5]. Even so, this monofloral honey may present a large variation in pollen spectrum resulting from the large variability in the ecosystems surrounding the apiaries. La-vandulaspp. honey is characterized by a pleasantfloral aroma, sweet taste and a light amber colour. Its chemical and sensory characteristics make it a much-appreciated honey with a high commercial value in Portugal and in the international market, which make it essential to
ensure an efficient and specific quality control for this product. Vibrational molecular spectroscopy techniques are very useful for food and beverages’analysis due to theirflexibility, efficiency and low cost[6]. Particularly, the use of FT-Raman is advantageous due to the small volume of sample required, the high data reproducibility and speed of analysis. Furthermore, in comparison to other spectroscopy techniques like FTIR or NIR, Raman has the advantage that spectral information avoids the interference related to the water molecule.
Spectroscopic techniques like FTIR, NIR or Raman spectroscopy have been used in the identification as well as quantification of the chemical composition of different products in food, pharmaceutical and other industries. Particularly, FT-Raman methodology is based on the scattering of light from near infrared radiation due to the vibrational energy of the molecules in the sample. FT-Raman has been used in food analysis, namely: quantitative analysis of vitamin A [7]; sugars in honey[8]; determination of erucic acid content in canola oil[9]; de-tection of vitamins B2and B12in cereals[10]; classification of different vegetable oils and identifying adulteration on virgin olive [11]; as-sessment of the quality of Southern Italian honey Types[12]; qualita-tive analysis of food fraud[10]; controlling protected designation of
http://dx.doi.org/10.1016/j.talanta.2017.08.099
Received 16 June 2017; Received in revised form 23 August 2017; Accepted 25 August 2017
⁎Corresponding author at: Instituto Politécnico de Castelo Branco, Quinta da Senhora de Mércules, 6001-909 Castelo Branco, Portugal.
E-mail address:[email protected](O. Anjos).
Available online 01 September 2017
0039-9140/ © 2017 Elsevier B.V. All rights reserved.
origin of wine[13].
Regarding honey analysis, Kizil et al.[14]evaluated the chemical changes induced by gamma irradiation on the fructose content of honey. Batsoulis et al. [15]applied and modified a standard HPLC-based method and used FT-Raman spectroscopy to evaluate fructose and glucose percentage. Also, Corvucci et al.[16]demonstrated that Raman spectral data, in combination with PCA models, could be a good tool to identify the botanical origins. In addition, more recently, Tahir et al.[17]applied FT-Raman for the prediction of phenolic compounds (catechin, syringic, vanillic, and chlorogenic acids) measured by HPLC–DAD, antioxidant activity and ferrous chelating capacity mea-sured by Spectrophotometry in honey.
As such, this study aimed to assess the potential of FT-Raman spectroscopy to be an accurate tool for the fast analysis of monofloral lavandulahoney's quality.
2. Material and methods
2.1. Samples
One hundred (n = 100) Apis mellifera's honey samples were har-vested by beekeepers from apiaries located in different regions of Portugal: Alentejo (n = 8), Almancil (n = 10), Bragança (n = 12), Castelo Branco (n = 7), Chaves (n = 10), Lisboa (n = 6), Lousã (n = 6), Marialva (n = 4), Mirandela (n = 15), Torres Vedras (n = 3), Vila Flor (n = 12) and Vimioso (n = 7). Samples were delivered at the laboratory and kept in the dark at 5 °C until further analysis, which occurred in no more than one month after the extraction from the hives; none of the samples had signs of fermentation or spoilage.
In order to ensure that all samples could be classified asLavandula spp. monofloral honey, palynological analysis was performed. Those samples that did not meet the requirements to be considered as monofloralLavandulaspp. honey were rejected.
The qualitative pollen analysis was performed using the acetolysis method, as recommended by Louveaux et al. [18]and Von der Ohe et al.[5]. The examination of the pollen slides was carried out with a Leitz Diaplan microscope (Leitz Messtechnik GmbH, Wetzlar, Germany) at 400 × and 1000 ×. A minimum of 1000 pollen grains were counted per sample. The recognition of the pollen grains was performed using the reference collection of the School of Agriculture of the Polytechnic Institute of Bragança as well as different pollen morphology guides and palynology atlas. The following terms were used for pollen frequency classes: predominant pollen (P, more than 45% of pollen grains counted), secondary pollen (S, 16–45%), important minor pollen (IM, 3–15%) and minor pollen (M, 1–3%).
2.2. Physicochemical analysis
The physicochemical parameters of Lavender honey samples as-sessed in afirst phase were: ash content (%); electrical conductivity (mS/cm); 5-hydroxymethylfurfural content (HMF) (mg/kg); free acidity (meq/kg), diastase activity (Schade units/g); reducing sugars (%); ap-parent sucrose (%); pH and proline (mg/kg). The determinations were carried out in agreement with the Official Methods of Analysis of Association of Official Analytical Chemists (AOAC, 1990)[19], Har-monised methods of the International Honey Commission[20]and the Codex Alimentarius[21].
The protein content (mg/kg) was determined according to the method described by Nogueira et al.[22].
Regarding the total phenolic content of the honey samples, it was estimated following the Folin–Ciocalteau method while the total fl a-vonoid were evaluated using the methodology proposed by Elamine et al. [23]. Three replicate analyses (n = 3) were made using each sample. Results are expressed as mean value ± standard deviation.
2.3. Raman data acquisition and processing
The Raman spectra of the honey samples were acquired using a FT-Raman spectrometer (BRUKER, MultiRAM) equipped with a 180° high-throughput collecting lens, a ultra-high sensitivity Liquid Nitrogen-cooled Ge Diode detector, an integrated 1064 nm (9392.5 cm−1), diode pumped, Nd:YAG laser with a maximum output power of 500 mW, for a working spectral range of 3500–70 cm−1Stokes Shift. The instrumental parameters used for spectra acquisition were: spectral resolution: 4 cm−1; scanner velocity: 5 kHz; number of sample scans: 100.
The system was operated using the OPUS software provided by the manufacturer. In order to minimize disturbances in the measurement conditions, an automatic motorized XY sample stage was used, ac-commodating well-plates with 96 sample positions, thus eliminating the need to constantly open the spectrometer for changing samples. Two measurements were performed for each sample. Mean spectra were used in all subsequent calculations.
The spectra were collected at a constant room temperature of 20 °C. PLS regression was done based on the spectral decomposition using OPUS 7.5.18 BRUKER software according the methodology used in Anjos et al.[24].
The spectral data were regressed against the measured parameters, using the pre-processing methods for PLS-R analysis: multiplicative scatter correction (MSC); minimum-maximum normalization (MinMax); vector normalization (VecNor); straight line subtraction (SLS); constant offset elimination (ConOff); first derivative (1stDer); second derivative (2ndDer);first derivation with multiplicative scat-tering correction (1stDer + MSC); first derivation with vector nor-malization (1stDer + VecNor);first derivation with straight line sub-traction (1stDer + SLS).
The total number of samples was randomly split into two groups (Set 1 corresponding to 70% of samples; and Set 2 containing the re-maining 30% of the samples). This separation into two groups was performed automatically by the software OPUS (v 7.5 Build 7, 5, 18 (20140810), Bruker Optik GmbH, Ettlingen, Alemanha), in order to ensure the representability of the samples.
The first group of 70 samples were used for internal validation (cross-validation) and a second one, the remaining 30 samples, for test (validation set). Wavelength selection was done iteratively by com-paring and combining wavenumber ranges, and automatically by de-fining significant wavenumber ranges with the help of the Martens uncertainty test. In a first step the infrared dataset was regressed against the calibration components, and by means of full cross-valida-tion with one sample omitted a significant number of PLS components was obtained.
The results of the cross-validation were tested for a maximum rank of 10, higher values of coefficient of determination (r2) and ratios of performance to deviation (RPD) and lower root mean square error of cross validation (RMSE) as the test set validation[25].
3. Results and discussion
monofloral honey. Even so, despite the monofloral classification, other pollen grains were also present in different proportion. The Pollen spectrum and their frequency on the analysed honey samples are pre-sented inTable 1.
According to the legislation the moisture content in honey must not exceed 20%. For all samples, the moisture content was in agreement the legal limits (Table 2). This parameter was measured only to attest the quality of honey, however it was not used in calibration model because water is not a good Raman scatterer. Water does not cause interference in the Raman spectra.
Hydroxymethylfurfural (HMF) and Diastase Activity act as quality indicators, suggesting honey's freshness and/or overheating. Almost all the samples under assessment were within the legal limits established for these variables. However, exceptionally, one of the samples pre-sented 6.7 Gothe degrees. In spite of this, this sample was considered for further assessment since its HMF concentration was in accordance with the standards (Table 2).
Ash and electrical conductivity values depend on the mineral con-tent of the honey, the first one measures the inorganic residue after carbonization and the second evaluates ionisable organic and inorganic substances values. The values obtained (Table 2) for these two para-meters are in accordance to the values for nectar honeys according to
the Codex Alimentarius[21].
TheLavandulaspp. honey presented pH values ranging from 2.12 to 6.54 (Table 2), which is in accordance with the values reported for Portuguese honeys and for Lavender honeys[2,4].
The total acidity of honey suggests the absence of unwanted fer-mentations. The analysed honey samples presented on average 24.2 ± 7.1 meq/kg (Table 2) and are in accordance with the legislation.
Honey is mainly composed of the monosaccharides glucose and fructose and others di- and tri-saccharides[1]. The Reducing Sugars content of the honeys analysed ranged from 61.7% to 77.5%, higher than the 60% required by the legislation.
According to the European Directives, for most honey types the apparent sucrose content must be under 5%. However, for Lavender honey, due to theirfloral origin, this value must be under 10%. All the samples met this directive.
The Protein content is one of the minor components in honey and came from the honeybee and from the pollen content in honey[22]. The protein content in the analysed honey samples ranged between 0.21 mg/kg and 0.53 mg/kg and no accurate models could be found for this parameter.
Total phenols andflavonoids are key parameters because they are related to the honey bioactive properties. The total phenol content of the analysed honey varied from 87.9 to 229.0 mg/100 g and the total flavonoid content varied from 5.8 to 15.8 mg/kg (Table 2). These va-lues are in accordance with those reported by Gomes at al[4]. and Estevinho et al.[2].
3.1. Raman spectra characterization and analysis
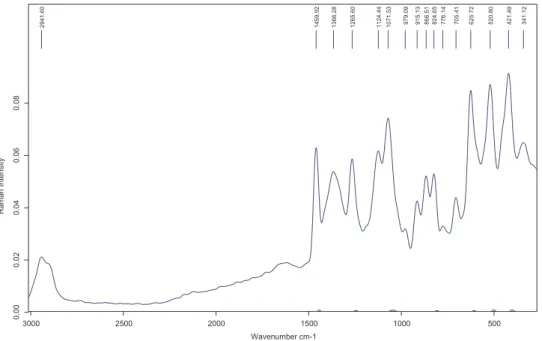
FT-Raman spectra of Lavender honey are shown inFig. 1. Honey samples show a majority of the spectral peaks in the 200–1500 cm−1 region. In the region between 300 and 1500 cm−1, peaks were observed at 341, 422, 521, 626, 705, 776, 825, 867, 915, 979, 1072, 1124, 1266, 1366, and 1460 cm−1, matching those observed in literature [8,17,26,27].
The FT-Raman spectra obtained for honey samples were similar to those reported in the literature[17,28]. The peaks identified in the spectra can be assigned as follows:
•
From 200 cm−1 to 500 cm−1 was observed skeletal vibrational modes, namely C-C-O and C- C-C, C-O and C-C[29];•
521–deformation of C-C-O and C- C-C[17];•
626 was assigned to ring deformations[17];•
around 705 cm−1corresponds to the stretching of C-O and C-C-O, O-C-O bending[30];•
the band at 776 was assigned to the C–C stretching and C–H vi-brations present in glucose[30,31];•
at 867 and 825 cm−1were assigned to the vibration of C-H and CH2 [31]deformation and C-O-H bending[30];Table 1
Percentage of other pollen grains found in the monofloralLavandulaspp. honey samples.
Number of honey samples
Min-max mean ±σ CV
Lavandulaspp. 105 15.8–83.1 33.4 ± 12.0 36.0
Castanea sativa 15 7.5–33.1 18.9 ± 7.9 41.8
Carduusspp. 3 2.4–11.2 6.8 ± 4.5 67.1
Cistusspp. 72 3.8–38.5 18.1 ± 9.2 50.6
Cytisusspp. 35 3.7–21.3 11.4 ± 4.8 42.2
Echiumspp. 65 4.3–41.5 23.5 ± 11.1 47.1
Ericaspp. 23 4.8–52.8 15.6 ± 11.8 75.9
Eucaliptusspp. 3 3.0–5.0 4.1 ± 0.9 22.3
Leontondonspp. 21 2.0–21.3 9.4 ± 5.5 58.3
Prunusspp. 32 2.8–38.0 13.9 ± 8.6 62.1
Rubusspp. 32 3.0–30.3 12.8 ± 6.4 50.2
Thymus vulgaris 4 3.0–14.6 7.8 ± 5.0 63.8
Trifoliumspp. 25 2.6–23.1 11.0 ± 5.5 50.1
Apiumspp. 17 2.8–18.9 7.2 ± 4.2 58.2
Genistaspp. 7 6.7–19.5 13.3 ± 5.1 38.3
Taraxacum officinale 13 3.1–18.1 8.7 ± 4.2 48.2
Medicagospp. 5 4.7–16.7 10.0 ± 4.4 44.6
Viciaspp. 4 4.2–11.3 8.1 ± 2.9 36.1
Quercusspp. 7 3.3–32.1 12.8 ± 10.5 82.2
Acaciaspp. 8 7.7–31.1 15.9 ± 8.3 52.2
Pinusspp. 1 24.3–25.0 24.6 ± 0.3 1.1
Chamaespartium sagittale 1 15.8–16.5 16.2 ± 0.3 1.8
Anthemis spp 11 2.3–10.4 5.9 ± 2.6 43.7
Table 2
Results obtained for the different parameters evaluated.
Parameter Mean ±σ Min–max Coefficient of
variation
Legal limits
Moisture (%) 16.4 ± 0.8 15.2–19.12 4.9 < 20
HMF (mg/kg) 4.6 ± 4.4 0.5–17.3 100.0 < 40
Electrical conductivity (mS/cm) 0.27 ± 0.04 0.20–0.37 15.7 < 0.8
Ash (%) 0.15 ± 0.07 0.06–0.4 59.8 < 15
Total acidity (meq/kg) 24.2 ± 7.1 10.5–36.8 29.1 < 50
pH 3.61 ± 0.59 2.12–6.54 16.2
Proline (mg/kg) 256.8 ± 23.6 227.9–304.8 9.2
Diastase index (Schade units/g) 11.2 ± 2.8 6.7–17.0 31.1 > 8
Reducing sugars (%) 69.7 ± 3.9 61.7–77.5 5.6 > 60
Apparent sucrose (%) 3.4 ± 1.1 1.0–6.8 30.5 < 10
a signal around 915 cm−1was associated with the vibration of C-H and C-O-H[32];
•
The peak at 979 cm−1was due to vibration in the two anomers of fructose and glucose[30];•
around 1072 cm−1were assigned to the carbohydrates bending vi-bration of C-H and C-O-H and also a minor contribution by the proteins and amino acids vibration of C–N bond in amino acids and proteins[31];•
usually the peak at 1124 cm−1was attributed to a combination of stretching vibration of C–O and C-O-C and vibration of C–N of protein and amino acids[31];•
around 1266 cm−1could be attributed to the vibration of C–O–H, C-C-H and O-C-C-H;•
The signal at 1366 cm−1corresponded to the bending of C –H and O–H bonds[28];•
At 1460 cm−1was found the signal associated to a combination of the vibration of COO- group of bending vibration of CH2 group [31,33]. This region was attributed to the presence offlavanols and organic acids[33].3.2. Calibration model development
The PLS regression was used to develop the calibration models after
spectra pre-treatments were applied in order to increase the perfor-mance of the predictive models. A different spectral range was selected for each parameter analysed (Table 3).
Table 3summarizes the best models obtained for each analytical parameter in both cross-validation and test set validation.
Each model was selected according to the criteria explained in material and methods section, namely present a higher coefficient of determination for both sets, with higher residual prediction deviation and lower root mean square error of cross-validation and prediction and bias.
InFig. 2was represented the predict model by FT-Raman, for the reference method of some of the chemical characteristics that was re-ported in the Portuguese legislation for honey quality control.
All analytical parameters evaluated have high correlation coeffi-cient ranging between 92.8% and 99.9% for cross validation and be-tween 93.8 to 99.9% in test set validation, with a rank that varied between 9 and 10. Although for pH the model's parameters are also presented in theTable 3, the authors think the calculated model does not predict values accurately enough to consider it a good model. The values of r2for pH were 83.8 (with RPD of 2.5) in Cross-Validation and 98.5 in test set validation (with RPD of 8.2). In this case the analytical pH values ranged only between 2.12 and 6.54, which could be a too narrow interval given the dispersion of the values. In fact, the values Fig. 1.Average FT-RAMAN spectrum of the
Lavandulaspp. honey.
Table 3
Results of the Cross-validation and the validation set for the calculated models regarding the different parameters.
Cross-validation (n = 70) Validation set (n = 30)
Spectral range (cm−1) Pre-process Rk r2 RMSECV RPD Bias r2 RMSEP RPD Bias
Electrical conductivity (mS/cm) 1356–1210 + 1065–772 + 627–480 + 350–250 VecNor 10 92.8 0.0106 3.7 −0.0009 93.8 0.0111 4.2 −0.0030 Ash (%) 1500–772 + 350–250 SLS 10 95.1 0.0107 4.6 0.0008 94.1 0.0008 4.2 −0.0008 Total acidity (meq/kg) 1500–1210 + 1065–919 + 774–336 MSC 10 99.9 0.223 25.9 −0.0211 99.8 0.283 28.4 0.1300 pH 1500–772 + 480–190 MSC 9 83.8 0.119 2.5 −0.0012 98.5 0.0977 8.2 0.0091 Reducing sugars (%) 1500–1354 + 1210–919 + 774–336 MSC 9 99.0 0.343 10.0 0.0142 99.2 0.395 11.6 −0.1140 HMF (mg/kg) 1500–1063 + 336–190 SLS 10 99.9 0.187 26.8 −0.0083 99.0 0.169 10.4 −0.0419 Proline (mg/kg) 1500–1210 + 1065–919 + 774–480 + 336–190 SLS 10 99.2 1.71 11.4 0.1050 99.4 2.03 12.8 −0.1770 Diastase index (Schade units/g) 1500–1063 + 774–627 + 336–190 SLS 10 99.6 0.186 15.8 0.0095 99.3 0.211 12.8 0.0706 Apparent sucrose (%) 1520–80 MSC 9 94.2 0.232 4.2 0.0062 97.3 0.180 6.4 0.0551
Totalflavonoids content (mg/100 g) 1500–1063 + 774–627 + 483–190 MSC 10 98.9 0.257 6.9 0.0023 99.2 0.228 11.2 −0.0413 Total phenol content (mg/100 g) 1500–1063 + 919–627 + 336–190 SLS 10 99.9 1.37 26.0 −0.0168 99.9 1.44 31.7 0.0238
VecNor–Vector normalization; SLS - Straight line elimination; MSC - Multiplicative scatter correction; Rk–Rank; r2- coe
range between 2.12 and 6.54 but the median is 3.5 and 6.54 is an outlier in this group of data, but a possible value founded in honey. In this case more data with higher variability would be needed in order to try to improve the calibration model, similarly to what other authors found for other spectroscopic techniques[34,35].
The RPD for cross-validation and test set validation was higher than 3.7 and ranged from 3.7 (cross-validation for electrical conductivity) to 31.7 (Test-Set for total phenol content). These results are available in Table 3.
Regarding the parameters considered as “basic standards” for honey's commercialization (electrical conductivity, ash, total acidity, pH, HMF, reducing sugar and apparent sucrose), this work provides very good calibration models with r2values varying from r2= 92.8% for electrical conductivity to r2= 99.9% for HMF and Total acidity, all with high RPD values. Concerning the remaining parameters, total phenol content presented the better calibration models, considering cross-validation and test set validation.
Tahir et al.[17]have also found good calibration models for phe-nolic compounds and antioxidant activity in honey.
InFig. 2, provides scatter plots of the parameters referenced in the legislation predicted by PLS-R calibration models based on the FT-Raman spectra. All of the plots show significant correlation between the measured and predicted values. The accuracy of each prediction model
is quantified inTable 3.
As previously mentioned HMF content is a very important quality parameter because it is related to the honey freshness and/or over-heating. Given the results obtained in this work, the calibration models for this parameter, forLavandulahoney, are very good: r2= 99.9% and RPD = 26.8 for cross-validation and r2= 99.0% and RPD = 10.4 for Test-Set. This supports the importance of a spectroscopy model in quality control laboratory to quickly point out a low quality honey sample.
Lichtenberg-Kraag et al.[34]also found good calibration models for the analytical parameter of honey (sugars, proline, free acids, invertase, moisture, HMF, pH and electrical conductivity) analysed using Fourier-transform infrared spectroscopy (FT-IR) and partial least-square re-gression. The coefficient of determination found by this author ranging from 84% to 98%.
Using the Near infrared reflectance spectroscopy (NIRS) technique, Cozzolino and Corbella[35] evaluated the chemical composition of fresh honey samples from different locations across Uruguay. Their models, with PLS-R, for water content, pH, electrical conductivity, colour and HMF present a coefficient of determination in calibration ranging between 67% and 96%, and concluded that NIRS is a useful method to evaluate chemical composition of honey.
already been measured with good accuracy[15,36,37], but the studies with the parameter referenced in the European legislation for honey quality control are scarce.
Our research reconfirms the ability of the FT-Raman technique to measure and evaluate the quality of a specific type of honey available in the market. However, more studies are needed prior to the im-plementation of this technique for the routine laboratorial assessment, particularly regarding the external calibration. Also, it will be im-portant to analyse what spectroscopic technique (NIR, FTIR or Raman) is more accurate and at a lower cost.
4. Conclusion
The results obtained in this study suggest that the proposed meth-odology has an acceptable accuracy for being applied in the quality control ofLavandulaspp. Monofloral honey. Also, it appears to be useful for the assessment of other chemical parameters important to support the high quality of this product, namely the content of total phenols and totalflavonoids.
Indeed, from the residual prediction deviation value as well as from the determination coefficient, the models demonstrate to be a powerfull tool. This technique may be used on honey analysis, especially for supporting a professional extraction unit where the beekeeper needs to have their honey quality evaluated in an easy and fast way to com-mercialize his product.
More studies are required in order to validate these results with more samples and applying different methodologies. In addition, it would be interesting to test its applicability for the measurement of other health-promoting compounds available in the honey samples.
Acknowledgments
Acknowledgements: CEF is a research unit funded by Fundação para a Ciência e a Tecnologia I.P. (FCT), Portugal (UID/AGR/00239/2013). Centre of Molecular and Environmental Biology is a research unit funded by FCT, UID/BIA/04050/2013 (POCI-01–0145-FEDER-007569) and by the ERDF through the COMPETE2020 - Programa Operacional Competitividade e Internacionalização (POCI).
References
[1] O. Anjos, M.G. Campos, P.C. Ruiz, P. Antunes, Application of FTIR-ATR spectro-scopy to the quantification of sugar in honey, Food Chem. 169 (2015) 218–223. [2] L.M. Estevinho, E.D. Chambó, A.P.R. Pereira, C.A.L. De Carvalho, V. De Alencar, Arnaut De Toledo, Characterization of lavandula spp. honey using multivariate techniques, PLoS One 11 (2016) 1–15.
[3] O. Anjos, C. Iglesias, F. Peres, J. Martínez, Á. García, J. Taboada, Neural networks applied to discriminate botanical origin of honeys, Food Chem. 175 (2015) 128–136.
[4] T. Gomes, X. Feás, A. Iglesias, L.M. Estevinho, Study of organic honey from the northeast of Portugal, Molecules 16 (2011) 5374–5386.
[5] W. Von Der Ohe, L. Persano Oddo, M.L. Piana, M. Morlot, P. Martin, Harmonized methods of melissopalynology, Apidologie 35 (2004) S18–S25.
[6] R. Bauer, H. Nieuwoudt, F.F. Bauer, J. Kossman, K.R. Koch, Esbensen Kim, H. FTIR, spectroscopy for grape and wine analysis, Anal. Chem. 80 (2008) 1371–1379. [7] T.M. Hancewicz, C. Petty, Quantitative analysis of vitamin A using Fourier
trans-form Raman spectroscopy, Spectrochim. Acta Part A Mol. Biomol. Spectrosc. 51 (1995) 2193–2198.
[8] B. Özbalci,İ.H. Boyaci, A. Topcu, C. Kadılar, U. Tamer, Rapid analysis of sugars in honey by processing Raman spectrum using chemometric methods and artificial neural networks, Food Chem. 136 (2013) 1444–1452.
[9] S. Durakli Velioglu, H.T. Temiz, E. Ercioglu, H.M. Velioglu, A. Topcu, I.H. Boyaci, Use of Raman spectroscopy for determining erucic acid content in canola oil, Food Chem. 221 (2017) 87–90.
[10] C. Marquez, M.I. Lopez, I. Ruisanchez, M.P. Callao, FT-Raman and NIR spectroscopy data fusion strategy for multivariate qualitative analysis of food fraud, Talanta 161 (2016) 80–86.
[11] R.M. El-Abassy, P. Donfack, A. Materny, Visible Raman spectroscopy for the dis-crimination of olive oils from different vegetable oils and the detection of adul-teration, J. Raman Spectrosc. 40 (2009) 1284–1289.
[12] A.G. Mignani, L. Ciaccheri, A.A. Mencaglia, R. Di Sanzo, S. Carabetta, M. Russo, Dispersive Raman spectroscopy for the nondestructive and rapid assessment of the quality of Southern Italian honey types, J. Lightw. Technol. 8724 (2016) 4479–4485.
[13] L. Mandrile, G. Zeppa, A.M. Giovannozzi, A.M. Rossi, Controlling protected desig-nation of origin of wine by Raman spectroscopy, Food Chem. 211 (2016) 260–267. [14] R. Kizil, J. Irudayaraj, Rapid evaluation and discrimination ofγ-irradiated
carbo-hydrates using FT-Raman spectroscopy and canonical discriminant analysis, J. Sci. Food Agric. 87 (2007) 1244–1251.
[15] A.N. Batsoulis, N.G. Siatis, A.C. Kimbaris, E.K. Alissandrakis, C.S. Pappas, P.A. Tarantilis, P.C. Harizanis, M.G. Polissiou, FT-Raman spectroscopic simulta-neous determination of fructose and glucose in honey, J. Agric. Food Chem. 53 (2005) 207–210.
[16] F. Corvucci, L. Nobili, D. Melucci, F.-V. Grillenzoni, The discrimination of honey origin using melissopalynology and Raman spectroscopy techniques coupled with multivariate analysis, Food Chem. 169 (2015) 297–304.
[17] H.E. Tahir, Z. Xiaobo, L. Zhihua, S. Jiyong, X. Zhai, S. Wang, A.A. Mariod, Rapid prediction of phenolic compounds and antioxidant activity of Sudanese honey using Raman and Fourier transform infrared (FT-IR) spectroscopy, Food Chem. 226 (2017) 202–211.
[18] J. Louveaux, A. Maurizio, G. Vorwohl, Methods of Melissopalynology, Bee World 59 (1978) 139–157.
[19] A. of A.C. (AOAC), Official Methods of Analysis of Association of Official Analytical Chemists, 15rd. Virg, 1990.
[20] IHC, Harmonised methods of the International Honey Commission, 2009〈http:// www.ihc-platform.net/ihcmethods2009.pdf〉. (Accessed 10 March 2017). [21] Codex Alimentarius, Revised Codex Standard for Honey. Codex STAN 12–1981,
2001.〈www.fao.org/input/download/standards/310/cxs_012e.pdf〉. (Accessed 10 March 2017).
[22] C. Nogueira, A. Iglesias, X. Feás, L.M. Estevinho, Commercial bee pollen with dif-ferent geographical origins : a comprehensive approach, Int. J. Mol. Sci. (2012) 11173–11187.
[23] Y. Elamine, S. Aazza, B. Lyoussi, M. Dulce Antunes, L.M. Estevinho, O. Anjos, M. Resende, M.L. Faleiro, M.G. Miguel, Preliminary characterization of a Moroccan honey with a predominance of Bupleurum spinosum pollen, J. Apic. Res. (2017) 1–13,http://dx.doi.org/10.1080/00218839.2016.1265759.
[24] O. Anjos, A.J.A. Santos, L.M. Estevinho, I. Caldeira, FTIR-ATR spectroscopy applied to quality control of grape-derived spirits, Food Chem. 205 (2016) 28–35. [25] J. Workman Jr, L. Weyer, Practical Guide to Interpretive Near-Infrared
Spectroscopy, CRC Press, 2007.
[26] I.S. Arvanitoyannis, C. Chalhoub, P. Gotsiou, N. Lydakis-Simantiris, P. Kefalas, Novel quality control methods in conjunction with chemometrics (multivariate analysis) for detecting honey authenticity, Crit. Rev. Food Sci. Nutr. 45 (2005) 193–203.
[27] S. Li, Y. Shan, X. Zhu, X. Zhang, G. Ling, Detection of honey adulteration by high fructose corn syrup and maltose syrup using Raman spectroscopy, J. Food Compos. Anal. 28 (2012) 69–74.
[28] M.M. Paradkar, J. Irudayaraj, Discrimination and classification of beet and cane inverts in honey by FT-Raman spectroscopy, Food Chem. 76 (2002) 231–239. [29] M.V. Korolevich, R.G. Zhbankov, V.V. Sivchik, Calculation of absorption band frequencies and intensities in the IR spectrum ofα-D-glucose in a cluster, J. Mol. Struct. 220 (1990) 301–313.
[30] M. Mathlouthi, C. Luu, A.M. Meffroy-Biget, D. Vinh Luu, Laser-raman study of so-lute-solvent interactions in aqueous solutions ofD-fructose,D-glucose, and sucrose, Carbohydr. Res. 81 (1980) 213–223.
[31] R. Kizil, J. Irudayaraj, K. Seetharaman, Characterization of irradiated starches by using FT-Raman and FTIR spectroscopy, J. Agric. Food Chem. 50 (2002) 3912–3918.
[32] X. Zhu, S. Li, Y. Shan, Z. Zhang, G. Li, D. Su, F. Liu, Detection of adulterants such as sweeteners materials in honey using near-infrared spectroscopy and chemometrics, J. Food Eng. 101 (2010) 92–97.
[33] E.M. Nickless, S.E. Holroyd, J.M. Stephens, K.C. Gordon, J.J. Wargent, Analytical FT-Raman spectroscopy to chemotype Leptospermum scoparium and generate predictive models for screening for dihydroxyacetone levels infloral nectar, J. Raman Spectrosc. 45 (2014) 890–894.
[34] B. Lichtenberg-Kraag, C. Hedtke, K. Bienefeld, Infrared spectroscopy in routine quality analysis of honey, Apidologie 33 (2002) 327–337,http://dx.doi.org/10. 1051/apido:2002010.
[35] D. Cozzolino, E. Corbella, Determination of honey quality components by near in-frared reflectance spectroscopy, J. Apic. Res. 42 (2003) 16–20.
[36] L.F.C. de Oliveira, R. Colombara, H.G.M. Edwards, Fourier transform Raman spectroscopy of honey, Appl. Spectrosc. 56 (2002) 306–311.