ENVIRONMENTAL PERFORMANCE AND HUMAN DEVELOPMENT
IN THE MUNICIPALITIES OF SÃO PAULO
1
RAFAEL DE ARAUJO AROSA MONTEIRO2
EVANDRO MATEUS MORETTO3
DELHI PAIVA SALINAS4; CARINA SERNAGLIA GOMES5
The myth of development as economic growth
Over time, there have been different interpretations of the term development in-volving cultural, social, environmental and, especially, economic aspects. Along the way, the quest for increased gross domestic product in order to boost income levels has ended up being understood and used as the dominant mechanism for promoting development, and this holds true even today (OECD, 2001).
The first academic criticisms of economic growth as a synonym for development date from the 1960s, as in the case of the Romanian mathematician Nicolas Georgescu--Roegen. He drew attention to the fact that it was impossible for the economic system to grow indefinitely based on the physical limits stipulated in the second law of thermo-dynamics (CECHIN, 2010).
The equivalence between economic growth and development was also severely questioned by the report “The Limits to Growth”, published by the Club of Rome in 1969, and during the United Nations Conference on the Human Environment in 1972 in Stockholm. Later, from the publication of the report “Our common future” in 1987 and the United Nations Conference on the Environment and Development, which was
1 AGRADECIMENTOS À Fundação de Amparo à Pesquisa do Estado de São Paulo – FAPESP e ao Instituto de Energia e Ambiente – IEE da Universidade de São Paulo pela disponibilização de recursos financeiros e de infra-estrutura que viabilizaram o desenvolvimento e a publicação deste trabalho.
2. Gestor Ambiental, Escola de Artes, Ciências e Humanidades – EACH, Universidade de São Paulo - USP, São Paulo, SP - Brasil. Integrante do Grupo de Pesquisa em Planejamento e Gestão Ambiental – PLANGEA/USP. E-mail: rafael. [email protected]
3. Professor Doutor da Universidade de São Paulo, Coordenador do Grupo de Pesquisa em Planejamento e Gestão Ambiental – PLANGEA, Escola de Artes, Ciências e Humanidades – EACH e Instituto de Energia e Ambiente – IEE, São Paulo, SP – Brasil. Integrante do Grupo de Pesquisa em Planejamento e Gestão Ambiental – PLANGEA/USP. E-mail: [email protected].
4. Professora Doutora da Universidade de São Paulo, Escola de Artes, Ciências e Humanidades – EACH, São Paulo, SP – Brasil. E-mail: [email protected]
held in Rio de Janeiro in 1992, the debate began to revolve around the concept of sus-tainable development.
Although it is understood as being fundamental to development, the mere exis-tence of economic growth may not be sufficient if there is no investment in improving human living conditions (DOWBOR, 2001). In this author’s view, development takes on a new direction when human development and quality of life, as objectives of the development process, mean that social issues cease to be a sector and instead become a dimension of development.
Veiga (2006) considers that economic growth can be part of a development strategy as it is an intermediate aspect of this phenomenon and not the product itself of develop-ment. In this way, it is only the ways of measuring economic growth that are insufficient in terms of adequately expressing the development phenomenon.
In this regard, the publication of the Stiglitz-Sen-Fitoussi report in 2009 highlighted the need to abandon the current economic model which still affirms that it is possible to measure development using the Gross Domestic Product (GDP) production-driven accounting system. Moreover, the report also suggests that quality of life, together with sustainability, should be the objectives to attain a new paradigm (STIGLITZ-SEN--FITOUSSI, 2009).
2009 also saw the release of the book “Prosperity without growth”. In it, Tim Jackson maintains that the current economic model is not sustainable and posits as his main idea the need to learn how to prosper without economic growth (JACKSON, 2009). Tim Jackson’s thoughts, to a large degree, follow the line taken by Daly (2004) whereby it is impossible to solve problems such as poverty and environmental degradation merely through economic growth, stating that the economy must stop growing so as to address this issue, yet continue to develop.
Prosperity is understood by Jackson (2009) as a condition where individuals enjoy a good quality of life, such as good relationships with family and friends, and participate actively in the community in which they live and feel part of it. The concept of prosperity therefore surpasses material concerns and includes individuals’ search for better physical, psychological and social conditions. In other words, it is much more closely linked to quality of life and encompasses aspects such as health, happiness, trust and satisfaction.
Based on this, Tim Jackson raises the following dilemma: if economic growth is abandoned, we run the risk of an economic and social collapse; however, ignoring the need for change will result in environmental degradation, which threatens survival in the long-term.
The author believes that the best solution from the existing options is to promote what he calls “decoupling” the environmental impacts from growth. Jackson (2009) considers two types of “decoupling”: relative decoupling, whereby the environmental impacts relatively decrease while Gross Domestic Product (GDP) increases, or indeed grows, albeit at a slower pace; and absolute decoupling, whereby environmental impacts decrease in absolute terms despite a rise in GDP.
economic growth is crucial for decoupling, thus resulting in less environmental degradation as it leads to technological innovations that are the basis of technological efficiency. The problem is that this assumption does not take into consideration two other key factors behind environmental degradation: the population size and its ability to consume. In other words, innovation may well create some level of relative decoupling, yet it is not able to reduce the absolute pressure arising from the ever increasing size of the economy.
Although the aforementioned context voices part of the intense scientific and institutional debate on the concept of development as a complex phenomenon which necessarily involves the convergence of a number of dimensions, most planning and ma-nagement processes, in countries, states, municipalities or any other form of economic system, continue to measure and interpret the development phenomenon essentially in terms of economic growth.
For those who have begun to analyze development by measuring its multiple di-mensions, the problem of the lack of integration between these dimensions persists, in particular the lack of substantiation as to how these dimensions inter-relate.
Tridico (2009) demonstrated from research carried out on countries belonging to the group of emerging economies that there is no correlation between increased GDP and improved social indicators for health, education and distribution, showing that some aspects are actually worse, such as income distribution.
Motivated by the same issues identified by Tridico, the objective of this work is to assess whether the development of São Paulo municipalities sees a convergence between the environmental dimension and the dimensions related to human municipal development. In other words, to assess whether the municipalities that perform best in environmental terms are also the ones that do best in terms of the human development dimensions. More specifically, the potential positive correlation between environmental performance and the economic dimension of human development would represent em-pirical evidence for the decoupling debate that Jackson (2009) suggests.
There follows a description of the geography of human development and the environmental performance of São Paulo municipalities and statistical analysis of the correlation between each of the components of human development (education, income and longevity) and the municipalities’ environmental performance.
Human development in the municipalities of São Paulo
Overcoming the controversial notion that development and economic growth are equivalent requires a conception of development as a broader concept which can only be achieved, for instance, by improving the social system (MYRDAL, 1974).
In this regard, the author puts forward five fundamental dimensions for a society to develop:
– Social dimension: the search for more equitable income distribution, ensuring that the necessary conditions for a dignified life can be enjoyed by the majority.
– Environmental dimension: the life support system providing resources and the means of absorbing waste generated by human activities.
– Territorial dimension: better territorial distribution of human settlements and economic activities. Policies should be drafted that effectively fight over-concentration in metropolitan areas and the destruction of fragile ecosystems.
– Economic dimension: More effective allocation and management of resources ai-med at breaking dependency on external conditions for development. Economic viability is a prerequisite in order for the other aspects to take place.
– Political dimension: democratic governance as a fundamental and necessary va-lue. The freedom to participate and the provision and safeguarding of spaces so that this participation can be consolidated are essential in promoting the other dimensions and therefore shaping development.
For Sen (2000), development also means being more able to freely carry out the activities chosen by society. In other words, Sen refers to the ability to make choices, where this increase in choice occurs mainly at the social and cultural levels, with a material base as a necessary condition to make this happen. In the same way, productive capacity should not be the end product expected of development, rather one of the means to improve human capabilities, fostering cooperation and solidarity between citizens, resulting in the transformation of economic growth into development as freedom. In the author’s view, expanding human capabilities is a way of countering the sources of privation of freedoms, such as: poverty and tyranny, lack of economic opportunities, lack of public services and intolerance or interference from repressive states.
Amartya Sen drew up an index in 1988 to broaden the application of the concept of development. This became a counterpoint to Gross Domestic Product which had been the measure used up to then. The creation of this second-generation indicator sought to represent three aspects of development: income, education and longevity, which was adopted by the United Nations Development Program (UNDP) in 1990 as the Human Development Index (HDI).
The HDI functions as a measure of human development which considers aspects overlooked by the measurement of GDP (UNDP, 2010), although, in its calculations, it also includes GDP, as well as measures of longevity and education. For example, it is possible that a given system that has a high GDP and lower levels of education and longevity scores higher on the HDI than another with lower GDP and better education and longevity. This is one of the limitations of this index as, according to Veiga (2010b), there is no guarantee that a system with a higher HDI is more developed.
dimensions, resulting in the homogenisation of potential asymmetries between the level of income obtained and the measurement of standards for a given country, or region (VEIGA, 2005; GUIMARÃES and JANNUZZI, 2005).
Another criticism levelled by Veiga (2005) regards the dimensions employed. By way of example, the author analyzes countries with a high HDI, such as the United States and Japan, which would have to leave the block of more developed countries if the environmental dimension were part of the assessed indicators. For the author, the non-inclusion of other dimensions, such as the environmental, is due to the difficulty of finding reliable indicators to encompass these other aspects.
In this way, even though it represents progress when compared with GDP, the HDI has received considerable criticism, especially regarding the inability of a single index to capture a phenomenon as complex as development. It is crucial that when analyzing this index, its components are scrutinized and compared to other questions (VEIGA, 2005), which is the aim of this paper.
Seeking to create a similar index, and indeed overcome such criticisms, the State of São Paulo Legislative Assembly appointed the SEADE Foundation in 2000 to create an indicator to measure the degree of human development in all São Paulo municipali-ties. This led to the creation of the São Paulo Social Responsibility Index (IPRS), which comprises three indicators: wealth, education and longevity. It was published for 2000, 2002, 2004, 2006, 2008 and 2010 (SEADE, 2010).
Although the bases of the IPRS are the same three dimensions (income, education and longevity) employed by the Human Development Index (HDI), the SEADE Foun-dation instituted three innovations so as to ensure the indicators matched the reality on the ground in São Paulo’s municipalities: the inclusion of variables that could describe short-term changes, the construction of a typology to better identify the social and eco-nomic problems of each municipality and the adoption of a graded structure that enables the reality of São Paulo municipalities to be understood, this means that the final index is therefore not based on an average of the three dimensions (SEADE, 2010).
The wealth indicator comprises annual household electricity consumption, the electricity consumption for agriculture, business and services via electrical connections; added value per capita and the average pay of formal private and public sector workers (SEADE, 2010).
Figure 1 - Wealth in São Paulo municipalities in 2008 (taken from SEADE, 2010)
(Key: Categories Light grey=Low (up to 48), Dark grey= High (49 and over) Source: SEADE Foundation, São Paulo Social Responsibility Index - IPRS
Scale 1:250000)
This behaviour can be explained through the existence of the macro metropolis of São Paulo, which is formed by the metropolitan regions and those lying adjacent to it. It has a high concentration of people, encompassing 73% of São Paulo State’s population, industry and services. Moreover, it is home to the country’s largest passenger airports, Congonhas and Guarulhos; the biggest cargo airport, Viracopos; the biggest port, Santos; along with prestigious universities, such as the Universidade de São Paulo (USP), the Universidade Estadual de Campinas (UNICAMP) and others (SÃO PAULO, 2012).
Nevertheless, it can be seen that the majority of the map is made up of municipa-lities with low levels of wealth. What is noteworthy is the number of municipamunicipa-lities that fall into this category in the west and south of the State, where only a few exceptions show a high level of wealth.
This fact can be explained in part by the predominantly agricultural nature of western São Paulo State, whereas the south is an area that is more suited to conservation activities married to the fact that economic activity is still rather minimal in this area (SÃO PAULO, 2012).
15 to 17 with at least four years of education; percentage of children aged 5 to 6 who attend pre-school (SEADE, 2010).
Looking at the education component of the São Paulo IPRS, in Figure 2 one can see a higher concentration of municipalities with a high level of education in the interior of the State and a longitudinal belt is visible with low levels of education stretching from the north to the south of the State.
Figure 2 - Education in São Paulo municipalities in 2008 (taken from SEADE, 2010)
(Key: Categories Light grey=Low (up to 67), Dark grey= Medium (from 68 to 70, Black= (71 and over) Source: SEADE Foundation, São Paulo Social Responsibility Index - IPRS
Scale 1:250000)
A range of different categories can be seen in the southeast and eastern parts of the State, where there are municipalities with high levels of education bordering those with medium or low levels.
Given that the western region of the State is mainly agricultural (SÃO PAULO, 2012) and, by extension, rural, the behaviour seen on the map can be explained using the analyses carried out by Artoni (2012), which compared performance and pass, fail and drop-out rates in state and municipal schools in the rural and urban regions, examining the 5th and 9th years or the 4th and 8th grades respectively.
other can be seen with the highest figures for this component. The first runs northwest to northeast and the second west to the central part of the State. Of note is the fact that the two belts are separated by a region with medium and low values for the indicator.
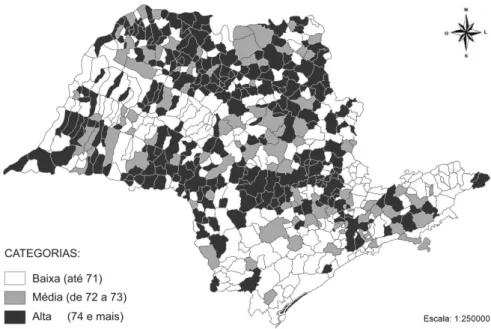
Figure 3 - Longevity in São Paulo municipalities in 2008 (taken from SEADE, 2010)
(Key: Categories Light grey=Low (up to 71), Dark grey= Medium (from 72 to 73, Black= (74 and over) Source: SEADE Foundation, São Paulo Social Responsibility Index - IPRS
Scale 1:250000)
Additionally, the southern part of the State has a high concentration of municipa-lities with low longevity with just a handful of exceptions falling within the high category. The eastern part is characterized by a range of different categories among the munici-palities. Nevertheless, it can be seen that the ones with the highest longevity figures are clustered together and are surrounded by municipalities with lower values.
The pattern observed for the longevity component can be explained by the process in which São Paulo’smunicipalities were established, and demographic and spatial changes. In fact, one of the main causes was the migration towards the interior of the State after the 1980s among the over 60s, who left in search of better quality of life (GUIDUGLI, 2000).
The environmental performance of São Paulo
municipalities
legislation and a number of state laws - as is the case in the State of São Paulo - stipulate the need for environmental quality reports to be published periodically.
In order to address this issue, the Government of the State of São Paulo created an environmental project in 2007, entitled the Green Municipality Project (PMVA), so as to benchmark the environmental performance of São Paulo municipalities and de-centralize environmental policy, ensuring efficiency in environmental management and stimulating public participation (GUIMARÃES and FIGUEIREDO, s.d.). Its purpose was to develop mutual responsibility, where the municipalities would have more independence in local management and be responsible for providing the executive structure to take charge of local environmental actions, with the assistance of the state through technical cooperation and training. In this way the Government of the State of São Paulo and the municipalities worked together to implement the São Paulo environmental agenda, based on the premises of decentralization, democratization and participation (GUIMARÃES and FIGUEIREDO, s.d.).
The State’s 645 municipalities joined the Programme by means of a “Term of Ac-ceptance” which comprises ten environmental policies which must be followed: treated sewage, minimum waste, restoration of riparian forests, urban tree planting, environ-mental education, sustainable housing, water use, air pollution, environenviron-mental structure and environmental councils. The Secretary of State for the Environment is responsible for evaluating the criteria each year to certify the municipalities. Those that score 80 or more on the Environmental Assessment Index (IAA) are certified (GUIMARÃES and FIGUEIREDO, s.d.).
In brief, the following formula is used when calculating and evaluating complian-ce with the ten environmental policies: IAA = (IDi + PROi) – PP, where: IDi is the Attainment Indicator for each environmental policy, represented by i, to a maximum of eighty points; PROi is the Proactive Actions Indicator in relation to the policies and can total up to twenty points; and PP corresponds to the municipality’s pending legal environmental matters, which can total up to thirty points (BRAZIL, 2011).
Lastly, the certified municipalities are given priority when the government of the State of São Paulo allocates public resources, particularly the State Pollution Prevention and Control Fund (FECOP) and the State Water Resources Fund (FEHIDRO) (GUI-MARÃES and FIGUEIREDO, s.d.).
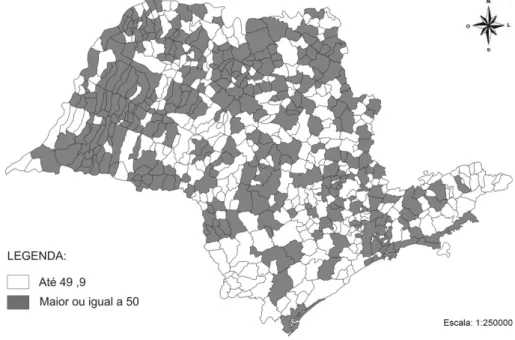
Figure 4, shows the geography of the environmental performance of São Paulo municipalities as established by the PMVA, which splits the municipalities into just two categories: scores below and above 50.
When analyzing the scores over 50, it can be observed that there is an obvious concentration of good performing municipalities in the western part of the State. One can also see a similar situation in the northern part. However, in this particular case, the good scoring municipalities are surrounded by municipalities with the worst scores.
The municipalities with the best scores in the PMVA are located in the west of the State, which is characterized by the agricultural sector, while those ranked worst can be found in two different kinds of regions. The first includes the southern region of the State and the region of Mantiqueira, where there is good scope for conservation activities, considering the significant tracts of native vegetation remaining in these areas. The second is characterized by the region bordering the macro-metropolis of São Paulo. In other words, this area has the hallmarks - population density and different industrial and services sectors - that are inextricably linked to environmental degradation (SÃO PAULO, 2012).
Figure 4 – Environmental performance of São Paulo municipalities in 2011 (Source: São Paulo, 2012).
Relationship between human development and environmental performance
One fact to note is that due to the data and statistics production system in the State of São Paulo, the timeframes used for the human development and environmental performance dimensions do not coincide and this may cause problems in the analytical model used. It was to reduce such interferences that representative data from various years was used for both topics, so as to reduce the effects of possible variations in spe-cific years.
In order to apply the method based on Spearman’s correlation analysis for each of the four variables, the municipalities were ranked between 1st (highest score) and 645th (lowest score). The Spearman coefficient was calculated using this ranking (SIEGEL, 1956) for three pairs of variables formed from each one of the variables from the IPRS with the PMVA variable.
In order to validate the results obtained through the Spearman coefficient, the hypothesis test was carried out, giving a null hypothesis if the variables are not correlated (H0: ), and an alternative hypothesis if the variables are correlated (H1:
), whenever significance levels of 5% was found. The following conclusions were drawn (values given in Table 1.)
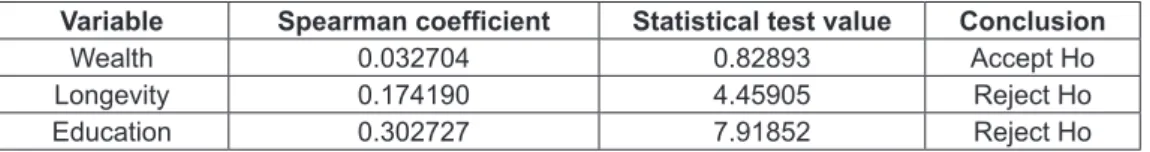
Table 1 – Results of the correlation analysis and statistical hypothesis test
Variable Spearman coefficient Statistical test value Conclusion
Wealth 0.032704 0.82893 Accept Ho
Longevity 0.174190 4.45905 Reject Ho
Education 0.302727 7.91852 Reject Ho
From this, we were able to observe the absence of any correlation between the environmental variable taken from the PMVA’s IAA average and the variable taken from the IPRS wealth indicator average. This demonstrates that the best performing munici-palities in terms of IPRS wealth over the 2000-2008 period are not necessarily those that also had the best environmental performances measured by the IAA. More specifically, the municipalities that saw most economic growth over the 2000-2008 period were not the ones that performed best environmentally over the following period, 2008-2011, which suggests that their increased wealth did not yield environmental improvements, or rather, that there is no empirical evidence of the decoupling suggested by Jackson (2009).
Furthermore, a statistical correlation was observed between the environmental variable taken from the PMVA IAA average and the variable taken from the IPRS lon-gevity indicator, and another between the environmental variable taken from the PMVA IAA and the variable taken from the IPRS education indicator average.
Accordingly, despite having established a statistical correlation, it is not possible to state that when longevity and education rose from 2000-2008, the same increase could also be seen in environmental performance over the following period 2008-2011.
This gives rises to a number of questions associated to the interpretation of this situation: Does the problem lie in the criteria used in both indexes? Does the problem lie in the weightings given to each criterion? Are these indicators fit for our target me-asurements?
Veiga (2009) asserts that the relevance of socio-environmental indicators within the new global context is beyond question. However, he states that there is still no consensus as to the best way to adopt them, which makes it difficult to legitimize any of the existing indicators and effective ways of measuring sustainable development.
He also stresses that existing attempts to create and implement socio-economic indicators include a range of problems, both at the conceptual and operational level, which make it more difficult to achieve the suggested objectives, creating what Veiga (2009) calls an “intellectual fog”, characterized by confusion as to how to measure sustainable development.
Both the PMVA and the IPRS are definitely no exceptions to this reality as both are affected by these difficulties and obstacles. Therefore, the monitoring of indicators should be carried out in order to confirm the results obtained and should be done in an integrated manner. In other words, the different indexes suggested for measuring the social, economic and environmental dimensions comprising sustainable development should be compared.
Veiga (2009) highlights the two main difficulties faced when developing socio--environmental indicators: the first regards the dearth of primary data on the environment; and the second, the lack of a conceptual consensus on what should be understood by environmental sustainability.
In this way, clearly municipalities need to carry out primary data collection in or-der to show the local environmental reality so that the PMVA can be improved to take into account the specificities observed in each place. As regards the second problem it becomes more difficult to achieve immediate success, yet not impossible, when delegating to the State the task of establishing what is meant by sustainability. This endeavour is nonetheless worthwhile, although susceptible to a huge number of errors – which can be expected as part and parcel of the challenge of the search for knowledge.
As a solution, Veiga (2010a) suggests that sustainability should instead be based on a series of indicators, which should simultaneously include variables related to environ-mental dimension, economic performance and quality of life. Furthermore, when dealing with sustainability, economic development and quality of life need to be measured using new indicators that should be completely different to GDP and HDI, currently in use.
Consequently, the methodology used by the IPRS, where the same dimensions as the HDI are considered, can still be criticized, whilst recognizing that attempts were made to improve it by taking into account new variables.
that the IAA addresses the 27 requirements - that were also stressed by Santos (2004) – revealing it to be a good environmental indicator in terms of structure.
On the other hand, Machado and Montaño (2012) identified problems within the Programme. They based their findings on the views of two speakers concerning the PMVA, with each speaker from opposite municipalities in terms of how they ranked.
The first problem highlighted was the fact that environmental issues are still not a priority on the municipal agenda. Thus, the PMVA is part of the challenge of getting this topic onto the agenda of municipalities. This being the case, transfers of funds to environmental actions are lower when compared to other sectors of government, which renders it harder to carry out actions that could promote effective environmental mana-gement in the municipality.
Furthermore, the speakers stressed the need to improve the incentives to roll out the programme, chiefly from a financial viewpoint, as the resources provided (for exam-ple, by the State Pollution Prevention and Control Fund (FECOP) and the State Water Resources Fund (FEHIDRO)) are insufficient to allow the actions described in the PMVA to be instituted (MACHADO & MONTAÑO, 2012).
Thus funding can be identified as one of the factors affecting good environmental performance, yet, as was found in the aforementioned results, the IPRS wealth variable has no correlation to the PMVA, which once again raises more questions as to the me-thodologies.
The views of the São Carlos (a poorly performing municipality in the PMVA at that time) speaker as recounted by Machado & Montaño (2012) are interesting. He states that the PMVA does not take into account the local reality and specificities of the municipa-lities, which is hardly in line with what the programme itself proposes. He highlights one shortcoming in terms of the criteria, citing the example of vehicle inspections not being a priority action for air quality in São Carlos, as is, for example, action against forest fires. However, the IAA does not guarantee this specificity satisfactorily.
It is therefore clear that there are shortcomings in the criteria adopted, and a lack of specificity as regards local realities. This situation results in benefitting municipalities that already had environmental challenges, as well as actions to address these in line with the PMVA. This can be exemplified by the municipality of Brotas (a well-ranked muni-cipality in the PMVA), which already carried out a number of sporadic actions included under the programme’s stipulations, thus making certification and compliance with the PMVA easier (MACHADO & MONTAÑO, 2012).
Furthermore, the two speakers highlighted a problem with governance: the lack of integration between the municipal offices and bodies involved (MACHADO & MON-TAÑO, 2012). The lack of integration between bodies responsible for the same sustainable development variable, that is, the environmental aspect, is noteworthy.
Final considerations
Given the above, the development phenomenon of São Paulo’s municipalities clearly does not involve the convergence of environmental performance and the human development dimensions.
On the one hand, this can be explained by the possibility that São Paulo’s munici-palities developed in a very varied way and without any convergence of the dimensions that make up the phenomenon, such as the environmental dimension, wealth, longevity and education.
On the other hand, although the PMVA is a promising strategy in terms of pro-moting more involvement of the municipalities and its citizens in the decision-making process, there are still problems and shortcomings of a political and institutional nature that need to be identified, solved and monitored.
For instance, a series of more in-depth studies are needed to elucidate the reality of municipalities, in particular those that score poorly in the Programme, so as to uncover the specific difficulties of each municipality and to better understand the problems they face when implementing the PMVA.
Lastly, the criteria used by the Programme need to be assessed in terms of their representativeness and their ability to meet the proposed objectives and in terms of the weighting criteria selected - which allocates more funding to treated sewage, solid waste and environmental education - as well as to the real implications these choices have.
REFERENCES
ARTONI, C. B. Relação entre perfil socioeconômico, desempenho escolar e evasão de alunos: escolas do campo e municípios rurais no Estado de São Paulo. 2012. 132 f. Dissertação (mestrado) – Universidade de São Paulo. Ribeirão Preto, 2012.
BRASIL. Resolução SMA n. 36 de 18 de julho de 2011. Estabelece os parâmetros para avaliação dos Planos de Ação Ambiental, para o exercício de 2011, no âmbito do Programa Município Verde e Azul, e dá providências correlatas. Disponível em: http://www.ambiente. sp.gov.br/cortafogo/files/2011/07/Resolucao-MVA.pdf Acesso em: 9 out. 2012.
CECHIN, A. A natureza como limite da economia: a contribuição de Nicholas Georgescu-Roegen. São Paulo: Edusp e Editora do Senac, 2010.
DALY, H. E. Crescimento sustentável? Não, obrigado. Revista Ambiente & Sociedade, v.7, n.2, p.197-202, 2004.
DOWBOR, L. Gestão Social e Transformação da Sociedade. Em: ABRAMOVAY, R.; ARBIX, G.; ZILBOVICIUS, M. (orgs.) Razões e ficções do desenvolvimento. São Paulo: Edusp, 2001. cap. 10, p. 197-221.
GUIDUGLI, O. S. Mapa do envelhecimento demográfico no Estado de São Paulo. In: ENCONTRO NACIONAL DE ESTUDOS POPULACIONAIS, 12., 2000, Caxambu. Anais eletrônicos... Caxambu: ABEP, 2000. Disponível em: <http://www.abep.nepo. unicamp.br/docs/anais/pdf/2000/Todos/Posteres/Mapa%20de%20Envelhecimento%20 Demogr%C3%A1fico%20no%20Estado%20de%20S%C2%A6o%20Paulo.pdf> Acesso em: 7 nov. 2012.
GUIMARÃES, J. R. S. e JANNUZZI, P. M. IDH, Indicadores sintéticos e suas aplicações em políticas públicas: uma análise crítica. Revista Brasileira de Estudos Urbanos e Regionais, v.7, n.1, p.73-89, 2005.
GUIMARÃES, U. e FIGUEIREDO, J. W. Projeto Município Verde/Município Verde Azul: depoimento. [s.d.]. São Paulo: Gestão Ambiental Paulista: A Construção do Novo. Entrevista concedida à Carolina Andrade. Disponível em: <http://www.ambiente.sp.gov. br/wp-content/uploads/noticias/sma-2007-2010.pdf> Acesso em: 24 out. 2012.
JACKSON, T. Prosperity without growth? The transition to a sustainable economy. Sustainable Development Commission, 2009.
MACHADO, L. F. & MONTAÑO, M. Estratégias de descentralização da gestão ambiental: o caso do programa município verde e azul (SMA-SP). In: CONGRESSO BRASILEIRO DE AVALIAÇÃO DE IMPACTO, 1., 2012, São Paulo. Anais eletrônicos... São Paulo: ABAI, 2000. Disponível em: <http://avaliacaodeimpacto.org.br/wp-content/ uploads/2012/10/087_descentraliza%C3%A7%C3%A3o_gestao-ambiental.pdf> Acesso em: 19 out. 2012.
MYRDAL, G. What is development? Journal of Economic Issues, v.8, n 4, p.729-736, 1974.
OECD, ORGANISATION FOR ECONOMIC CO-OPERATION AND DEVELOPMENT. Policies to enhance sustainable development. Paris, 2001.
PNUDM, PROGRAMA DAS NAÇÕES UNIDAS PARA O DESENVOLVIMENTO. Relatório de desenvolvimento humano 2010 – A verdadeira riqueza das nações: vias para o desenvolvimento humano. Washington D.C., 2010.
SACHS, I.Desenvolvimento: includente, sustentável, sustentado. Rio de Janeiro:Garamond, 2004.
SANTOS, R. F. Planejamento ambiental: teoria e prática. São Paulo: Oficina de Textos, 2004.
SÃO PAULO, Secretaria do Meio Ambiente do Estado de São Paulo/Coordenadoria de Planejamento Ambiental. Meio ambiente Paulista: Relatório de qualidade ambiental 2012. São Paulo: SMA/CPLA, 2012. Disponível em: <http://www.ambiente.sp.gov.br/ wp/cpla/files/2011/05/RQA_2012.pdf> Acesso em: 20 out. 2012.
SEADE. IPRS versão 2010: metodologia. 2010. Disponível em: <http://www.seade.gov. br/projetos/iprs/ajuda/2008/metodologia_2010.pdf> Acesso em: 20 mai. 2012.
SIEGEL, S. Estatística não-paramétrica – para as ciências do comportamento.1a ed. São Paulo: Mc Graw-Hill Ltda, 1956.
STIGLITZ, J. E., SEN, A. & FITOUSSI, J. Report by the Commission on the Measurement of Economic Performance and Social Progress. Paris, 2009.
TRIDICO, P. Growth, inequality and poverty in emerging and transition economies. Transition Studies Review, v.16, n 4, p. 979-1001, 2010.
VEIGA, J. E. O Prelúdio do Desenvolvimento Sustentável. In: CAVC, Economia Brasileira: Perspectivas do Desenvolvimento, pp. 243-266, 2005.
VEIGA, J. E. Meio Ambiente & desenvolvimento. 2a ed. São Paulo: Senac São Paulo, 2006.
VEIGA, J. E. Indicadores socioambientais: evolução e perspectivas. Revista de Economia Política, v.29 n.4, p. 421-435, 2009.
VEIGA, J. E. Indicadores de sustentabilidade. Revista Estudos Avançados, v.24 n.68, p. 39-52, 2010a.
VEIGA, J. E. Sustentabilidade: a legitimação de um novo valor. 2a ed. São Paulo: Senac São Paulo, 2010b.
Resumo: O desenvolvimento é um fenômeno sistêmico complexo que se manifesta a partir do relacionamento entre múltiplas variáveis, dentre as quais se costuma empregar as dimensões riqueza, longevidade e escolaridade na escala municipal, ainda que haja outras, como a ambiental. Neste contexto, o presente trabalho objetivou verificar se o desenvolvimento dos municípios paulistas é um fenômeno convergente entre performan-ce ambiental e as dimensões do desenvolvimento humano dos municípios paulistas. A partir da aplicação de uma análise de correlação agregada do coeficiente de Spearman, verificou-se a ausência de correlação entre performance ambiental e a dimensão riqueza, e baixa correlação com as dimensões longevidade e escolaridade. Isto demonstrou, que o fenômeno do desenvolvimento nos municípios paulistas manifestou-se, no período analisado, de forma dispersa e sem convergência entre as dimensões analisadas, o que pode ser discutido ora como a ausência de uma evidência empírica clara do descolamento entre tais dimensões, ora em função de limites metodológicos dos próprios indicadores.
Palavras-chave: Município; Desenvolvimento; Riqueza; Longevidade; Escolaridade; Performance ambiental.
Abstract: Development is a complex systemic phenomenon that manifests from the rela-tionship between multiple variables, which normally is explained at the municipal level by wealth, longevity and education dimensions, although are others, such as environmental dimension. In this context, this paper aims to determine whether the development of the counties is a convergent phenomenon between environmental performance and human development dimensions. The results of a statistical analysis based on Spearman correlation coefficient shows a lack of correlation between environmental performance and the wealth dimension of counties, and a low correlation with the dimensions longevity and education. This demonstrates, therefore, that the phenomenon of development in counties, in the period analyzed, was scattered and there was no convergence between the dimensions analyzed. This result is discussed based on the absence of clear empirical evidence of decoupling between dimensions, and due to methodological limitations of the indicators.
Key-words: County; Development; Richness; Longevity; Scholarity; Environmental per-formance.
relación entre múltiples variables, entre las que se emplea normalmente la dimensión de riqueza, longevidad y la educación en el ámbito municipal, todavía hay otros, como el del medio ambiente. En este contexto, el presente trabajo tiene como objetivo determinar si el desarrollo de los condados paulistas es un fenómeno convergente entre el desempeño ambiental y las dimensiones relacionadas con el desarrollo humano municipal. A partir de la aplicación de un análisis del coeficiente de correlación de Spearman, se verificó la ausencia de correlación entre el desempeño ambiental y la dimensión de la riqueza de los condados paulistas, y una baja correlación con las dimensiones longevidad y educación. Esto demuestra, por lo tanto, que el fenómeno del desarrollo en los condados paulistas se manifestó en el período analizado, de forma dispersa y sin la convergencia entre las dimensiones analizadas. Este resultado es discutido, o como la ausencia de una clara evi-dencia empírica de la disociación entre las dimensiones, o en función de las limitaciones metodológicas de los propios indicadores.