GOLDANI, A., CARVALHO, G. S. and BICCA-MARQUES J. C. Faculdade de Biociências, Pontifícia Universidade Católica do Rio Grande do Sul,
Avenida Ipiranga, 6681, CEP 90619-900, Porto Alegre, RS, Brazil
Correspondence to: Ângela Goldani, Faculdade de Biociências, Pontifícia Universidade Católica do Rio Grande do Sul, Avenida Ipiranga, 6681, CEP 90619-900, Porto Alegre, RS, Brazil, e-mail: [email protected]
Received August 18, 2004 – Accepted October 1, 2004 – Distributed February 28, 2006 (With 8 figures)
ABSTRACT
The Parsimony Analysis of Endemicity (PAE) is a method of historical biogeography that is used for detecting and connecting areas of endemism. Based on data on the distribution of Neotropical primates, we constructed matrices using quadrats, interfluvial regions and pre-determinated areas of endemism described for avians as Operative Geographic Units (OGUs). We codified the absence of a species from an OGU as 0 (zero) and its presence as 1 (one). A hypothetical area with a complete absence of primate species was used as outgroup to root the trees. All three analyses resulted in similar groupings of areas of endemism, which match the distribution of biomes in the Neotropical region. One area includes Central America and the extreme Northwest of South America, other the Amazon basin, and another the Atlantic Forest, Caatinga, Cerrado and Chaco.
Keywords: Parsimony Analysis of Endemicity, neotropical primates, Platyrrhini, distribution patterns, endemism.
RESUMO
Padrões Distribucionais de primatas Neotropicais (Platyrrhini) baseados na Análise de Parcimônia de Endemismo
A Análise de Parcimônia de Endemismo (PAE) é um método da biogeografia histórica que é usado para detectar e conectar áreas de endemismo. Baseando-se em dados de distribuição de primatas Neotropicais, construíram-se matrizes de dados utilizando-se quadrículas, regiões entre rios e áreas de endemismo pré-determinadas para aves como Unidades Geográficas Operacionais (OGUs). Codificou-se a ausência da espécie na OGU como 0 (zero) e a presença como 1 (um). Uma área hipotética com ausência total de espécies de primatas foi usada como grupo externo para polarização. Todas as três análises resultaram em grupos similares de áreas de endemismo, coincidindo com a distribuição de biomas na região Neotropical: uma área incluindo a América Central e o extremo Noroeste da América do Sul; outra, a Bacia Amazônica; e, uma terceira, a Mata Atlântica, Caatinga, Cerrado e Chaco.
Palavras-chave: Análise de Parcimônia de Endemismo; primatas neotropicais; Platyrrhini; padrões distribucionais; endemismo.
INTRODUCTION
Biogeographical methods depend on a good knowledge of the distribution and areas of endemism of a particular group of species. In biogeography,
taxa that exhibit a phylogenetic and distributional congruence and having their respective relatives occurring in other such-defined regions. The number of species found in a given geographic area, for example, is directly related to its size, a phenomenon known as “species-area relationship” (Rosenzweig, 1995). Therefore, it is possible that scale affects the results of biogeographical studies. In this paper we test whether the choice of scale influences interpretations of the patterns of distribution of New World primates based on a Parsimony Analysis of Endemicity (PAE) and whether this method can help understanding past patterns of dispersion of the primate fauna within Latin America.
PAE is a method proposed by Rosen (1988) to relate areas historically based on the composition of their biota or part of it. This method is analog to cladistics. In the PAE method the areas (Operating Geografic Units - OGUs) represent the taxa and the taxa represent the characters. Different authors have used different ways for determining OGUs. The most common variation of the method, proposed by Morrone (1994), uses predetermined same-sized quadrats. It has been used in the study of several groups of plants and animals (e.g., Posadas, 1996; Posadas et al., 1997; Cavieres et al., 2002; García-Barros et al., 2002). Craw (1988) sugested the use of predetermined areas of endemism (see also Goldani et al., 2002), whereas Silva & Oren (1996) adopted interfluvial regions as OGUs in a study of Amazonian primates. The size of individual OGUs may vary in these latter two methods.
New World monkeys are good models to test the influence of OGUs size in biogeography because their distribution is relatively well known, and most species present restrict distributions and have limited dispersion abilities. About 34% of the approximately 300 known extant primate species occur in the Neotropics (Rylands & Konstant, 2000). New World monkeys occur in forested habitats from about 30° S in Brazil and Argentina to about 20° N in Mexico (Hirsch et al., 2002).
MATERIALS AND METHODS
Distribution data were obtained mainly from a georeferenced data base available in the internet (BDGEOPRIM; www.icb.ufmg.br/ ~primatas/home_bdgeoprim.htm). BDGEOPRIM
was elabo-rated and is maintained updated by André Hirsch and his colleagues of the Universidade Federal de Minas Gerais (Brazil). The data set was complemented with information from other publications (Silva & Oren, 1996; Collins & Dubach, 2000; Lehman, 2000; Chiarello & Melo, 2001).
Data analysis was based on matrices (OGUs vs. taxa) in which the absence of a taxon in a particular OGU is coded as 0 (zero) and its presence as 1 (one). A hypothetical area (outgroup) in which all taxa are absent (0) was added for polarization (Rosen & Smith, 1988).
Analyses were made using the Hennig86 software (Farris, 1988) with the following comands: mh* and bb* (branching bound), sw (sucessive weighting), ne (strict consensus) and ie (implicit enumeration). In the first analysis (quadrats as OGUs), areas of endemism were established in a cladogram based on the distribution of 106 species (Table 1) in 60 quadrats of 5° longitude by 5° latitude (Fig. 1) (first stage). The relationship among these areas of endemism (second stage) was determined according to the occurrence of 57 species (Table 2). Those species occurring in a single area (autapomorphies) were not included in this analysis.
MATRIX with distributional data of 106 primate species in 60 quadrats as Operative Geografic Units.
1 2 3 4 5 6 7 8 9 10
TABLE 1 Note
Taxa: 1 - Alouattabelzebul; 2 - Alouattacaraya; 3 - Alouattacoibensis; 4 - Alouattaguariba; 5 - Alouattanigerrima;
6 - Alouattapalliata; 7 - Alouattapigra; 8 - Alouattasara; 9 - Alouattaseniculus; 10 - Aotusazarae; 11 - Aotus hershkovitzi; 12 - Aotuslemurinus; 13 - Aotusmiconax; 14 - Aotusnancymaae; 15 - Aotusnigriceps; 16 - Aotus trivirgatus; 17 - Aotusvociferans; 18 - Atelesbelzebuth; 19 - Ateleschamek; 20 - Atelesgeoffroyi; 21 - Ateleshybridus; 22 - Atelesmarginatus; 23 - Atelespaniscus; 24 - Brachytelesarachnoides; 25 - Brachyteleshypoxanthus; 26 - Cacajao calvus; 27 - Cacajaomelanocephatus; 28 - Callicebusbarbarabrownae; 29 - Callicebusbrunneus; 30 - Callicebus cinerascens; 31 - Callicebuscoimbrais.n.; 32 - Callicebuscupreus; 33 - Callicebusdonacophilus; 34 - Callicebus hoffmannsi; 35 - Callicebus medemi; 36 - Callicebus melanocephalus; 37 - Callicebus moloch; 38 - Callicebus nigrifrons; 39 - Callicebus ornatus; 40 - Callicebuspersonatus; 41 - Callicebustorquatus; 42 - Callimicogoeldii; 43 - Callithrixaurita; 44 - Callithrixflaviceps; 45 - Callithrixgeoffroyi; 46 - Callithrixjacchus; 47 - Callithrixkuhlii;
48 - Callithrixpenicillata; 49 - Cebuellapygmaea; 50 - Cebusalbifrons; 51 - Cebusapella; 52 - Cebuscapucinus;
53 - Cebus libidinosus; 54 - Cebus nigritus; 55 - Cebus olivaceus; 56 - Cebus xanthosternos; 57 - Chiropotes albinasus; 58 - Chiropotes satanas; 59 - Lagothrix cana; 60 - Lagothrix lagotricha; 61 - Lagothrix lugens;
62 - Lagothrixpoeppigii; 63 - Oreonaxflavicauda; 64 - Leontopithecuscaissara; 65 - Leontopithecuschrysomelas; 66 - Leontopithecuschrysopygus; 67 - Leontopithecusrosalia; 68 - Micoacariensis; 69 - Micoargentatus; 70 - Mico chrysoleucus; 71 - Mico emiliae; 72 - Mico melanurus; 73 - Mico humeratifer; 74 - Mico humilis; 75 - Mico intermedius; 76 - Micoleucippe; 77 - Micomanicorensis; 78 - Micomarcai; 79 - Micomauesi; 80 - Micomelanurus;
81 - Miconigriceps; 82 - Micosaterei; 83 - Saimiriboliviensis; 84 - Saimirioerstedi; 85 - Saimirisciureus; 86 - Saimiri ustus; 87 - Saimirivanzolinii; 88 - Saguinusbicolor; 89 - Saguinusfuscicollis; 90 - Saguinusgeoffroyi; 91 - Saguinus graellsi; 92 - Saguinusimperator; 93 - Saguinusinustus; 94 - Saguinuslabiatus; 95 - Saguinusleucopus; 96 - Saguinus martinsi; 97 - Saguinusmidas; 98 - Saguinusmystax; 99 - Saguinusniger; 100 - Saguinusnigricollis; 101 - Saguinus oedipus; 102 - Saguinustripartitus; 103 - Pitheciaalbicans; 104 - Pitheciairrorata; 105 - Pitheciamonachus; and
106 - Pitheciapithecia.
1
2 3
5
9
15 16 17 18 19 20
21
29
38 39 40 41 42 43 44 45
46 47 48 49 50 51
52
90° W
20° N
10° N
0°
10° S
20° S
30° S
80° W 70° W 60° W 50° W 40° W
53 54 55 56
57 58 59
60
30 31 32 33 34 35 36 37
22 23 24 25 26 27
28
10 11 12 13
14
6 7 8
4
MATRIX with distributional data of 57 primate species in the 8 endemism areas determinated by the quadrats analysis.
1 2 3 4 5
12345678 9012345678 9012345678 9012345678 9012345678 901234567
OG 00000000 0000000000 0000000000 0000000000 0000000000 000000000
A1 00000101 0000010000 0000001000 1000010000 0000000000 010001000
A2 10010110 1001000000 0110000100 0111000010 1110010000 000010100
A3 00001101 0000110000 0000000000 0000000000 0000000000 010001000
A4 01100010 0000000100 0000000011 0000001100 0000000000 000000000
A5 01000110 1101000001 1000111110 0101000000 1011010110 100100110
A6 11100010 0000000100 0010000111 1000001100 1010000000 000010000
A7 10010110 0110001010 0111001100 1111100001 0100111001 101010011
A8 00001101 1111101011 1001111110 1111110011 0011111111 101101111
Taxa: 1 - Alouattabelzebul; 2 - Alouattacaraya; 3 - Alouattaguariba; 4 - Alouattanigerrima; 5 - Alouattapalliata;
6 - Alouattaseniculus; 7 - Aotusazarae; 8 - Aotuslemurinus; 9 - Aotusnigriceps; 10 - Aotustrivirgatus; 11 - Ateles belzebuth; 12 - Ateleschamek; 13 - Atelesgeoffroyi; 14 - Ateleshybridus; 15 - Atelespaniscus; 16 - Brachyteles arachnoides; 17 - Cacajao melanocephalus; 18 - Callicebus brunneus; 19 - Callicebus cupreus; 20 - Callicebus hoffmannsi; 21 - Callicebus moloch; 22 - Callicebus torquatus; 23 - Callimico goeldii; 24 - Cebuella pygmaea;
25 - Cebus albifrons; 26 - Cebus apella; 27 - Cebus libidinosus; 28 - Cebus nigritus; 29 - Cebus olivaceus;
30 - Chiropotesalbinasus; 31 - Chiropotessatanas; 32 - Lagothrixcana; 33 - Lagothrixlagotricha; 34 - Lagothrix lugens; 35 - Leontopithecuscaissara; 36 - Leontopithecuschrysopygus; 37 - Micoacariensis; 38 - Micochrysoleucus; 39 - Micoemiliae; 40 - Micohumaralifera; 41 - Micomelanurus; 42 - Saimiriboliviensis; 43 - Saimirisciureus;
44 - Saimiriustus; 45 - Saguinusbicolor; 46 - Saguinusfuscicollis; 47 - Saguinusimperator; 48 - Saguinusinustus;
49 - Saguinuslabiatus; 50 - Saguinusleucopus; 51 - Saguinusmidas; 52 - Saguinusmystax; 53 - Saguinusniger;
54 - Saguinusoedipus; 55 - Pitheciairrorata; 56 - Pitheciamonachus; and 57 - Pitheciapithecia.
A31
30° S
90° W 80° W 70° W 60° W 50° W 40° W
20° S
10° S
0°
10° N
20° N
A4
A10B
A17 A18
A19
A20
A21 A22
A23
A26
A27
A28
A25 A12C
A14 A16 A11
A12B A3 A1
A2 A9
A5
A8
A10A A6 A7
A24
30° S
90° W 80° W 70° W 60° W 50° W 40° W
20° S
10° S
V II I
III IV
X IX
XI
XVI XII
XVII XIII
XIV XV
XIX
XXI XX
XVIII VII
VIII
VI
0°
10° N
20° N
Fig. 3 — Map of the main rivers of the Neotropical region and the Panama Canal with the 21 regions used as Operative Geografic Units.
Inambari) Center; 21) Rondônia Center; 22) Pará Center; 23) Belém Maranhão) Center; 24) Serra do Mar Center; 25) Paraná Center; 26) Caatinga Center; 27) Campo Cerrado Center; and 28) Chaco Center. The relationship among these areas was established based on the distribution of 69 primate species Table 3).
In the last analysis we used interfluvial regions delimited by the main rivers and the Panama Canal as OGUs (Fig. 3). According to Ayres & Clutton-Brock (1992), the main rivers may represent natural geographic barriers for some primates. Data on the distribution of 76 species were used in this analysis (Table 4). Interfluvial OGUs were delimited by: I) Panama Canal; II) Panama Canal and Magdalena river; III) Magdalena and Orinoco rivers; IV) Orinoco and Branco rivers; V) Putamayo and Maranon rivers; VI) Japura and Putamayo rivers; VII) Negro and Amazonas/Japura rivers; VIII) Branco river and Atlantic coast; IX) Maranon and Ucayali rivers; X) Ucayali and Purus rivers; XI) Purus and Madeira/Madre de Dios rivers; XII) Madeira/Guaporé and Tapajós rivers;
XIII) Tapajós/Teles Pires and Xingu rivers; XIV) Xingu and Araguaia rivers; XV) Tocantins and São Francisco rivers; XVI) Madre de Dios and Guaporé rivers; XVII) Tapajós and Teles Pires rivers; XVIII) Araguaia and Tocantins rivers; XIX) São Francisco river and Atlantic coast; XX) Paraguai and Paraná/ Paranaíba rivers; and XXI) Paraná/Paranaíba rivers and Atlantic coast.
RESULTS
1st analysis – Determining areas of endemism
and their relationship based on quadrats
Matrix with distributional data of 69 primate species in the predetermined endemism areas modified from Cracraft (1985).
1 2 3 4 5 6
123456789 0123456789 0123456789 0123456789 0123456789 0123456789 0123456789 OG 000000000 0000000000 0000000000 0000000000 0000000000 0000000000 0000000000
A1 000101010 0000100000 0100100000 0001000000 0001000000 0000010110 1010001010 A2 000001010 0000110000 0000000000 0000000000 0001000000 0000000000 0010001000 A3 000001010 0010000000 0000000100 0001000000 0001000000 0000000100 0000000010 A4 000001010 0000010000 0000000000 0001000000 0000000000 0000000000 0000000000 A5 000001010 0000010000 0000000000 0001000100 0000000000 0000000000 0000001000 A6 000001000 0000000000 0000000000 0001100000 0000000000 0000000000 0000000000 A7 000001000 0000010000 0000000000 0000000100 0000000000 0000000000 0000000000 A8 000001000 0000010000 0000000000 0001000100 0001000000 0000000000 0000000000 A9 000001010 0000010000 0000000000 0001000000 0000000000 0000000000 0000000000 A10A 000001000 0110000100 0000000010 0000000100 1010000000 0000010000 0001000001 A10B 000001000 0110000001 0000000010 0001100100 1010000000 0000010000 0001000001 A11 000001011 0110110000 0100100111 0011000000 0001100000 0000000110 0010001010 A12B 000001001 0010000000 0100000000 0010100000 0010110000 0000000100 0000000000 A12C 000001100 0001000000 1000000001 0010010000 0100000000 0000000101 0000000010 A14 000100001 0010000000 0000000000 0001100000 0000100000 0000010000 0000000010 A16 000001000 0000000000 0100000000 0010100000 0010010000 0000000100 0000000000 A17 000001100 0110000100 0000000010 0000100100 1000000000 0000011000 0001000001 A18 000001000 0110000001 0000000010 0001100100 1010000000 0000010000 1001000001 A19 000001000 0110000011 0100100011 0011100000 0010100000 0000010110 1100000010 A20 000011000 1101000010 1001000011 0010110000 0100101001 0110111101 0100100111 A21 100001100 1001001000 1001010000 0010100001 0100001111 1111011100 0100100110 A22 110000100 0000001100 0000010000 0000100001 1000000110 1000011000 0001010011 A23 100000100 0100001000 0000010000 0000100100 1000000100 0000010000 0000010000 A24 101000000 0000000000 0000001000 1100001010 0000000000 0000000000 0000000000 A25 001000000 0000000000 0000000000 0000001000 0000000000 0000000000 0000000000 A26 110000100 0000000000 0000000000 1100010010 0000000000 0000000000 0000000000 A27 111001100 1001000000 1010001000 0100111001 0100000000 0001101100 0000000110 A28 010010100 0000000000 0010000000 0000010000 0000000000 0001000000 0000000000 A31 000100010 0000100000 0000000000 0000000000 0000000000 0000000000 0000000000 Taxa: 1 -Alouattabelzebul; 2 -Alouattacaraya; 3 -Alouattaguariba; 4 - Alouattapalliata; 5 -Alouattasara;
6 -Alouattaseniculus; 7 -Aotusazarae; 8 -Aotuslemurinus; 9 -Aotusmiconax; 10 -Aotusnigriceps; 11 -Aotus trivirgatus; 12 -Atelesbelzebuth; 13 -Ateleschamek; 14 -Atelesgeoffroyi; 15 -Ateleshybridus; 16 -Atelesmarginatus;
17 -Atelespaniscus; 18 -Cacajaocalvus; 19 -Cacajaomelanocephalus; 20 -Callicebusbrunneus; 21 -Callicebus cupreus; 22 -Callicebusdonacophilus; 23 -Callicebushoffmannsi; 24 -Callicebusmedemi; 25 - Callicebusmoloch;
26 -Callicebusnigrifrons; 27 -Callicebusornatus; 28 -Callicebustorquatus; 29 -Callimicogoeldii; 30 -Callithrix jacchus; 31 -Callithrixpenicillata; 32 -Cebuella pygmaea; 33 -Cebus albifrons; 34 -Cebus apella; 35 -Cebus libidinosus; 36 - Cebus nigritus; 37 - Cebus olivaceus; 38 - Cebus xanthosternos; 39 - Chiropotes albinasus;
TABLE 4
Matrix with distributional data of 76 primate species in the 21 interfluvial regions used as Operative Geografic Units.
1 2 3 4 5 6 7
123456789 0123456789 0123456789 0123456789 0123456789 0123456789 0123456789 0123456
OG 000000000 0000000000 0000000000 0000000000 0000000000 0000000000 0000000000 0000000 I 000010000 0000010000 0000000000 0000000001 0000000000 0000000000 0000100000 0000000 II 000010101 0000011000 0000000000 0000000101 0000000010 0000000000 0000100000 0000000 III 000000101 0101001000 0010000000 1100000110 0010010110 0000000001 0000001010 0000001 IV 000000100 0101000010 0000000000 0100000110 0010010100 0000000001 0000000010 0000001 V 000010100 0011010000 0000100100 0110001110 0000000001 0000000001 0001000000 0110010 VI 000000100 0010100000 0100000100 0110001010 0000000000 0000000001 0101000100 0100010 VII 000000100 0111000000 0010000100 1110001010 0000000110 0000000001 0101001000 0100010 VIII 000000100 0100000010 0010000000 0000000010 0010010000 0000000001 0010000010 0000001 IX 000000100 0001100000 0000100000 0010001010 0000000001 0000000000 0001000000 0000010 X 000000100 1000100000 0100100000 0110001010 0000001001 0000000011 1101010001 0011110 XI 000001110 1100100000 0001011000 0110001010 1000001000 0000001011 1011010101 0001110 XII 000101110 1000100000 0001001000 0010000010 1000101000 0001111111 1001000101 0000110 XIII 100100010 0000000100 0000001010 0000000010 0000100000 0011110001 1000000000 0000000 XIV 110000010 0100000100 0000000010 0000000010 0000010000 0010000001 0000000000 1000000 XV 110000010 0000000000 0000000001 0000110000 1011010000 0000000001 0000000000 1000000 XVI 010001010 0000100000 0001010000 0000000100 1000000000 0000000110 0001000001 0000000 XVII 010000010 0000000000 0000000000 0000000000 0000000000 0000000000 0000000000 0000000 XVIII 010000010 0000000000 0000000000 0000010010 1000000000 0000000000 0000000000 0000000 XIX 011000000 0000000001 1000000001 0001110000 0101000000 1100000000 0000000000 0000000 XX 011000010 0000000000 0000010000 0000000000 1000000000 0000000100 0000000000 0000000 XXI 011000000 0000000001 1000000001 0001010000 0100000000 1100000000 0000000000 0000000 Taxa: 1 - Alouattabelzebul; 2 - Alouattacaraya; 3 - Alouattaguariba; 4 - Alouattanigerrima; 5 - Alouattapalliata;
6 - Alouattasara; 7 - Alouattaseniculus; 8 - Aotusazarae; 9 - Aotuslemurinus; 10 - Aotusnigriceps; 11 - Aotus trivirgatus; 12 - Aotusvociferans; 13 - Ateles belzebuth; 14 - Ateleschamek; 15 - Ateles geoffroyi; 16 - Ateles hybridus; 17 - Atelesmarginatus; 18 - Atelespaniscus; 19 - Brachytelesarachnoides; 20 - Brachyteleshypoxanthus;
21 - Cacajaocalvus; 22 - Cacajaomelanocephatus; 23 - Callicebusbrunneus; 24 - Callicebuscupreus; 25 - Callicebus donacophilus; 26 - Callicebushoffmannsi; 27 - Callicebusmedemi; 28 - Callicebusmoloch; 29 - Callicebusnigrifrons;
30 - Callicebusornatus; 31 - Callicebustorquatus; 32 - Callimicogoeldii; 33 - Callithrixaurita; 34 - Callithrixjacchus; 35 - Callithrixpenicillata; 36 - Cebuellapygmaea; 37 - Cebusalbifrons; 38 - Cebusapella; 39 - Cebuscapucinus;
40 - Cebuslibidinosus; 41 - Cebusnigritus; 42 - Cebusolivaceus; 43 - Cebusxanthosternos; 44 - Chiropotesalbinasus;
45 - Chiropotessatanas; 46 - Lagothrixcana; 47 - Lagothrixlagotricha; 48 - Lagothrixlugens; 49 - Lagothrixpoeppigii;
50 - Leontopithecuschrysopygus; 51 - Leontopithecusrosalia; 52 - Micoargentatus; 53 - Micoemiliae; 54 - Mico humaralifera; 55 - Micoleucippe; 56 - Micomarcai; 57 - Micomelanurus; 58 - Saimiriboliviensis; 59 - Saimiri sciureus; 60 - Saimiriustus; 61 - Saimirivanzolinii; 62 - Saguinusbicolor; 63 - Saguinusfuscicollis; 64 - Saguinus geoffroyi; 65 - Saguinusimperator; 66 - Saguinusinustus; 67 - Saguinuslabiatus; 68 - Saguinusmidas; 69 - Saguinus mystax; 70 - Saguinusniger; 71 - Saguinusnigricollis; 72 - Saguinustripartitus; 73 - Pitheciaalbicans; 74 - Pithecia irrorata; 75 - Pitheciamonachus; and 76 - Pithecia pithecia.
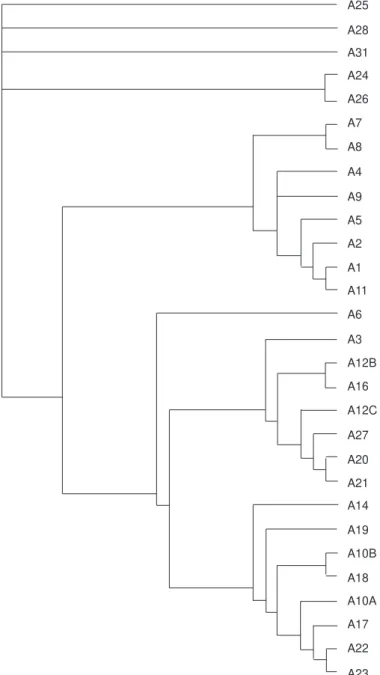
arachnoides, Cebus nigritus, Leontopithecus caissara and Leontopithecus chrysopygus. Whereas eleven primates justified the grouping of A7 and A8 (Ateles belzebuth, Ateles paniscus, Cacajao melanocephalus, Callicebus torquatus,
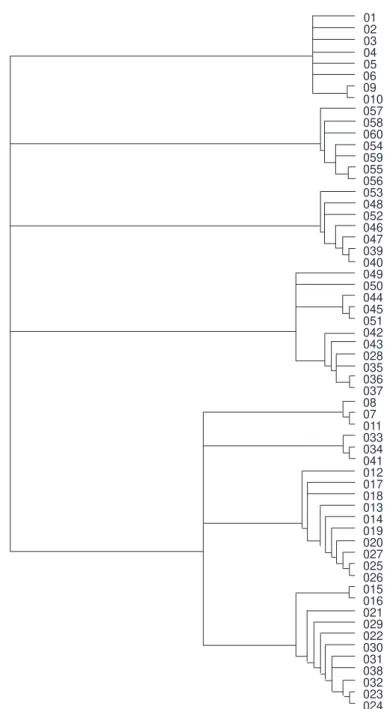
02 03 04 05 06 09 010 057 058
054 059 055 056 053 048 052 046 047 039 040 049 050
051 042 043 028 035 036 037 08 07 011 033 034 041 012 017 018 013 014 019 020 027 025 026 015 016 021 029 022 030 031 038 032 023 024 044 045 060
Fig. 4 — Cladogram obtained using quadrats (669 steps, consistency index 0.64 and retention index 0.77).
2nd analysis – Determining the relationship
among the areas of endemism proposed for birds (modified from Cracraft, 1985) with data on primates
One cladogram with 320 steps, ci 0.72 and ri 0.84 resulted from this analysis (Fig. 7). The branches ((A10B,A18)(A10A(A17(A22,
A1
A3
A4
A6
A2
A5
A7
A8
Fig. 6 — Area cladogram obtained by applying PAE (with 98 steps, consistency index 0.58 and retention index 0.54). A8
90° W
30° S
20° S
10° S
0°
10° N
20° N
80° W 70° W 60° W 50° W 40° W
A5
A4 A6 A2
A7 A1
A3
A28
A31
A24
A26
A7
A8
A4
A9
A5
A2
A1
A11
A6
A3
A12B
A16
A12C
A27
A20
A21
A14
A19
A10B
A18
A10A
A17
A22
A23
Fig. 7 — Area cladogram obtained by applying PAE (with 320 steps, consistency index 0.72 and retention index 0.84).
brunneus, and Lagothrix cana justified the grouping (A12C(A27(A20,A21))). Areas A24 and A26 were grouped for sharing Callithrix jacchus and Cebus xanthosternos.
3rd analysis – Determining the relationship
among interfluvial areas
A cladogram with 386 steps, ci 0.79 and ri 0.89 was obtained (Fig. 8). A smaller number of species
I
II
XVII
XVI
XX
XVIII
XV
XIX
XXI
XIII
XIV
VIII
III
IV
IX
VI
V
VII
X
XI
XII
Fig. 8 — Area cladogram obtained by applying PAE (with 386 steps, consistency index 0.79 and retention index 0.89).
DISCUSSION
The cladograms produced by all three analyses were very similar, and showed the grouping of neighboring areas: a) Central America and the extreme northwest of South America; b) Amazon basin; and c) Atlantic Forest, Caatinga, Cerrado, and Chaco (see Figs 3, 5, 6, and 8). These three large areas are represented by the main biomes in Latin America. Therefore, this pattern of primate
distribution suggests that in the recent past species dispersion occurred mainly within those areas than between them, probably because they may have been even less connected (or more isolated) during the Pleistocene ice ages from 1.4 mya to about 10.000 years ago (Chernicoff et al., 1997) than today.
indices, corroborating studies with Mexican mammals (Morrone & Escalante, 2002). These values mean that the use of different OGUs enable better results with natural areas like interfluvial regions. In spite of the hypothesis that rivers may represent natural geographic barriers for primate dispersion (Ayres & Clutton-Brock, 1992), several species were widely distributed occupying more than a single interfluvial region (such as Alouatta seniculus, Alouatta caraya, Alouatta guariba, Aotus azarae, Ateles chamek, Callimico goeldii, Cebuella pygmaea, Cebus albifrons, Saimiri sciureus, and Pithecia monachus). Whereas some of these species may be good swimmers and overcome these potential barriers (e.g., Alouatta spp.), others may have dispersed before the establishment of some of today’s larger rivers, or part of its population may have been transported in natural rafts or due to river dynamics (changes in river course) from one margin to the other.
In sum, this study showed that the use of larger Operational Geographic Units (OGUs) produces more consistent results and that PAE was a useful tool for understanding the patterns of distribution and dispersion of nonhuman primates within South and Central America. Therefore, PAE shall contribute to our knowledge on the patterns of dispersion and distribution of nonhuman primates in the other three biogeographic regions where they occur (namely Africa, Madagascar, and South Asia) since similar analyses are missing.
Acknowledgments — We are grateful to André Hirsch and colleagues from Universidade Federal de Minas Gerais for making precious Internet information available to us. This work was partially supported by the Conselho Nacional de Desenvolvimento Científico e Tecnológico (CNPq) through a scholarship granted to the first author (process number 131662/2001-5). Júlio César Bicca-Marques also thanks Cláudia, Gabriel, and Ana Beatriz for their permanent support. And, finally, we also thank the researchers Cláudio José Barros de Carvalho, José Maria Cardoso da Silva and Paula Posadas for the valuable review and suggestions for this paper.
REFERENCES
AYRES, J. M., & CLUTTON-BROCK, T. H., 1992, River boundaries and species range size in Amazonian primates. Am. Nat., 140: 531-537.
CAVIERES, L. A., ARROYO, M. T. K., POSADAS, P., MARTICORENA, C., MATTHEI, O., RODRÍGUEZ, R., SQUEO, F. A., & ARANCIO, G., 2002, Identification of priority areas for conservation in an arid zone: application of parsimony analysis of endemicity in the vascular flora
Conservation, 11: 1301-1311.
CHERNICOFF, S., FOX, H. A., & VENKATAKRISHNAN, R., 1997, Essentials of Geology. Worth Publishers, New York, 411p.
CHIARELLO, A. G., & MELO, F. R., 2001, Primate Population Densities and Sizes in Atlantic Forest Remnants of Northern Espírito Santo, Brazil. Int. J. Primatol., 22(3): 379-396. COLLINS, A. C., & DUBACH, J. M., 2000, Biogeografic and
Ecological Forces Responsible for Speciation in Ateles. Int. J. Primatol., 21(3): 421-444.
CRACRAFT, J., 1985, Historical biogeography and patterns of differentiation within the South American avifauna: Areas of endemism. Ornithol. Monogr., 36: 49-84.
CRAW, R., 1988, Continuing the synthesis between panbiogeography, phylogenetic systematics and geology as illustrated by empirical studies on the biogeography of New Zealand and the Chatham islands. Syst. Zool., 37(3): 291-310.
FARRIS, J. S., 1988, Hennig86 reference. Version 1.5. New York, Published by the author, Port Jefferson Station. GARCÍA-BARROS, E., GURREA, P., LUCIÁÑEZ, M. J.,
CANO, J. M., MUNGUIRA, M. L., MORENO, J. C., SAINZ, H., SANZ, M. J., & SIMÓN, J. C, 2002, Parsimony analysis of endemicity and its application to animal and plant geographical distributions in the Ibero-Balearic region (western Mediterranean). Jour. Biogeogr., 29: 109-124. GOLDANI, Â., FERRARI, A., CARVALHO, G. S., &
CREÃO-DUARTE, A. J., 2002, Análise de parcimônia de endemismo de membracídeos neotropicais (Hemiptera, Membracidae, Hoplophorionini). Revta bras. Zool., 19 (Supl.2): 187-193. HAROLD, A. S., & MOOI, R. D., 1994, Areas of Endemism: Definition and Recognition Criteria. Syst. Biol., 43: 261-266.
HIRSCH, A., DIAS, L. G., MARTINS, L. de O., CAMPOS, R. F., RESENDE, N. A. T., & LANDAU, E. C., 2002, Database of Georreferenced Occurrence Localities of Neotropical Primates. Departamento de Zoologia / UFMG, Belo Horizonte. http://www.icb.ufmg.br/~primatas/home_ bdgeoprim.htm.
LEHMAN, S. M., 2000, Primate Community Structure in Guyana: A Biogeografic Analysis. Int. J. Primatol., 21(3): 333-351.
MORRONE, J. J., 1994, On the identification of areas of endemism. Syst. Biol., 43: 438-441.
MORRONE, J. J. & ESCALANTE, T., 2002, Parsimony analysis of endemicity (PAE) of Mexican terrestrial mammals at different area units: when size matters. Jour. Biogeogr., 29: 1095-1104.
PLATNICK, N. I., 1991, On areas of endemism. Aust. Syst. Bot., Collingwood, 4: 11-12.
POSADAS, P., 1996, Distributional patterns of vascular plants in Tierra del Fuego: a study applying Parsimony Analysis of Endemicity (PAE). Biogeographica, 72: 161-177. POSADAS, P., ESTEVEZ, J. M., & MORRONE, J. J., 1997,
ROSEN, B. R., 1988, From fossils to earth history: applied historical biogeography, pp. 437-481. In: Myers, A. A., & Gillers, P. S. (eds.), Analytical Biogeography., Chapman & Hall, London.
ROSEN, B. R. & SMITH, A. B., 1988, Tectonics from fossils? Analysis of reef-coral and sea-urchin distributions from Late Cretaceous to Recent, using a new method, pp. 275-306. In: AUDLEY-CHARLES, M. G. & HALLAM, A. (eds.), Gondwana and Tethys. Geol. Soc. Special Publ., n° 37, Oxford University Press, Oxford.
RYLANDS, A. B., & KONSTANT, W. R., 2000, Primate Conservation-Global Patterns, Hotspots and Wilderness Areas. Folia Primatol., 71: 365-366.
ROSENZWEIG, M. L., 1995, Species diversity in space and time. Cambridge University Press, UK. 458p.