GENETIC DIVERGENCE AMONG ELEPHANTGRASS CULTIVARS
ASSESSED BY RAPD MARKERS IN COMPOSIT SAMPLES
Rogério Figueiredo Daher1*; Messias Gonzaga Pereira1; Antônio Vander Pereira2; Antônio Teixeira do Amaral Jr.1
1
LMGV/CCTA/UENF, Av. Alberto Lamego, 2000, Horto - CEP: 28015-620 - Campos dos Goytacazes, RJ.
2
Embrapa Gado de Leite, R. Eugênio do Nascimento, 610 - CEP: 36038-330 - Juiz de Fora, MG. *Corresponding author <rogdaher@uenf.br>
ABSTRACT: Elephantgrass (Pennisetum purpureum Schum.) is native to regions of tropical Africa and was introduced in Brazil around 1920 through plantings imported from Cuba. It is currently one of the most widespread forage plants throughout the country. At first, there were two cultivars, Napier and Mercker, with well defined characteristics. New genotypes arose and it is believed that the large number of cultivars existing today in germplasm bank is due to duplicates. DNA markers for cultivar characterization are a very valuable tool, especially in situations where morphological and isoenzymatic markers have already been used as in the case of elephantgrass. Thus RAPD markers were used to estimate the genetic divergence among the Napier group elephantgrass cultivars from the elephantgrass Active Germplasm Bank at EMBRAPA Dairy Cattle. The polymerase chain reaction with 37 arbitrary primers from the OPERON Technologies series supplied 94 polymorphic and 73 monomorphic bands. From the matrix of complement of the Nei index, cluster analysis by the Tocher optimization method formed three clusters. Pearson correlation among genetic distance estimates obtained from the DNA markers and the isoenzymatic markers showed the consistency of both the methods in assessing genetic divergence among elephantgrass cultivars. No duplicates were found in the treatments assessed.
Key words: Pennisetum purpureum Schum., Tocher optimization method, dendrogram, isoenzymatic markers
DIVERGÊNCIA GENÉTICA ENTRE CULTIVARES DE CAPIM-ELEFANTE
AVALIADA POR MARCADORES RAPD EM AMOSTRAS COMPOSTAS
RESUMO: O capim-elefante (Pennisetum purpureum Schum.) é nativo de regiões da África Tropical e foi introduzido no Brasil por volta de 1920, por meio de mudas provenientes de Cuba, e é, atualmente, uma das forrageiras mais difundidas em todo o país. No início de sua utilização, existiam praticamente dois cultivares com características bem definidas, Napier e Mercker. Com o decorrer do tempo, surgiram novos genótipos e acredita-se que o grande número de cultivares existentes atualmente no Banco de Germoplasma da espécie se deva à ocorrência de duplicatas. O uso de marcadores de DNA na caracterização de cultivares constitui uma ferramenta de grande valor, principalmente em situações em que marcadores morfológicos e isoenzimáticos já foram empregados, caso do capim-elefante. Em vista disso, objetivou-se estimar a divergência genética entre cultivares de capim-elefante do grupo “Napier” provenientes do Banco Ativo de Germoplasma de capim-elefante da EMBRAPA Gado de Leite, por meio de marcadores RAPD. As reações de polimerase em cadeia com 37 iniciadores arbitrários da série OPERON Technologies proporcionaram 94 bandas polimórficas e 73 monomórficas. Por meio da matriz do complemento do índice de Nei, a análise de agrupamento pelo método de otimização de Tocher indicou a formação de três grupos. Correlação de Pearson entre estimativas de distância genética obtidas a partir dos marcadores de DNA e dos marcadores isoenzimáticos indicaram a consistência de ambos os métodos para a avaliação da divergência genética entre cultivares de capim-elefante. Não foram encontradas duplicatas nos tratamentos avaliados.
Palavras-chave: Pennisetum purpureum Schum., método de otimização de Tocher, dendrograma, marcadores isoenzimáticos
INTRODUCTION
Elephantgrass (Pennisetum purpureum Schum.)
a tetraploid (2n = 4x = 28) and perennial forage grass (Manara, 1973; Brunken, 1977), is native to regions of Tropical Africa and was introduced in Brazil around 1920 by vegetative propagation of plantings imported from Cuba. It is currently one of the most widespread forage species in the country (Otero, 1961). At first there were two cultivars with well defined characteristics, ‘Napier’
and ‘Mercker’. New genotypes arose with time, either by introduction or by breeding of existing varieties, using the variation resulting from the sexual process. It is believed that part of the accessions currently in the species Germplasm Bank (Embrapa Dairy Cattle) are duplicates because the same cultivar was introduced from different origins but the original identifications were not kept.
studies have assessed and reported elephantgrass for its yield potential (Mozzer et al. 1970; Pedreira & Campos, 1975). Carvalho et al. (1972) gathered 30 elephantgrass introductions in three big groups, including variables such as stand, tillering, inflorescence and flowering period. Alcântara et al. (1980) characterized 25 elephantgrass introductions using 15 descriptors and concluded that it is extremely difficult to separate the introductions by morphological characterization. The assessment of morphological traits and multivariate analysis allowed for a better interpretation of the data, the formation of heterotic groups (Daher et al. 1997a; Botrel et al. 1995; Tcacenco & Botrel, 1994) and the discarding of variables of little interest for genetic divergence assessment (Tcacenco, 1988; Daher et al. 1997b). Biochemical and isoenzymatic makers have been used to minimize the effects of environment-genotype interaction, (Augustin & Tcacenco, 1993; Daher et al. 1997a; Bach et al. 1998).
DNA markers are valuable for cultivar characterization (Ferreira & Grattapaglia, 1996) especially when morphological and isoenzymatic markers have already been used, as in the case of elephantgrass. This study was carried out to estimate the genetic divergence among elephantgrass cultivars of the ‘Napier´ group from the Active Germplasm Bank at Embrapa Dairy Cattle by RAPD markers in composit samples.
MATERIAL AND METHODS
Genetic material
Nine elephantgrass accessions of the ‘Napier´ group from the Germplasm Bank at Embrapa Dairy Cattle (Table 1) located in Coronel Pacheco, MG, were used in this study. Nine young leaf blades were taken from seven plants per accession, squashed in liquid nitrogen and placed in an ultrafreezer (-86°C) in closed 15 mL ‘Falcon´ tubes. The study was carried out in Campos dos Goytacazes, RJ, Brazil.
DNA extraction
Approximately 200 mg of squashed material from the leaf blades was transferred to 1.5 mL eppendorf tubes and immersed in liquid nitrogen. DNA was extracted according to the protocol by Doyle and Doyle (1987) with modifications; 800 mL of pre-heated extraction buffer containing 1% CTAB, 1.4 mol L-1 NaCl were added to the tube containing 1% CTAB, 1.4 mol L-1 NaCl, 20 mmol L-1 EDTA, 100 mmol L-1 Tris-HCl (pH 8.0), 1% PVP and 0.1% 2-mercaptoetanol. It was incubated at 65°C for 30 to 40 minutes and gently shaken every 10 minutes, and then centrifuged at 13400 g for five minutes. The supernatant (600 µL) was transferred to new tubes and an equal volume of chloroform:isoamilic alcohol (24:1) was added and continually inverted until an emulsion was obtained. This step was repeated, and after new centrifuging, the supernatant was transferred to new tubes and chilled isopropanol was added, with gentle inversion and placed overnight in the refrigerator. Samples were then centrifuged at 13400 g for 10 minutes, and a pellet obtained (precipitate) that was washed twice in 300 µL 70% ethanol and once in 300 µL 95% ethanol, dried at room tempetature, re-suspended in 200 µL Tris-EDTA solution (10 mmol L-1 Tris CHCl, 1 mmol L=-1 EDTA, pH 8.0) and incubated with RNAse at a final concentration of 40 µg mL-1 at 37°C for 30 minutes. After adding 20 µL NACl 5 mol L-1 and 140 µL chilled isopropanol the mixture was incubated overnight at 4oC. It was again centrifuged at 13400 g for 10 minutes, dried and finally the pellet was re-suspended in 200 µL of TE solution. The DNA concentrations in the samples were estimated using fluorometric methods (DyNA Quant 200 Fluorometer, Hoefer Scientific, San Francisco, USA) and then standardized at 10 ng µL-1 concentration.
Polymerase chain reaction
The amplification reactions were carried out according to Williams et al. (1990) modified in a final volume of 25 µL containing the reagents at the following concentrations 10 mmol L–1 Tris-HCl, pH 8.3; 50 mmol L–1 KCl; 2.4 mmol L–1 MgCl
2; 100 µmol L
-1 dATP, dCTP, dGTP
Table 1 - Identification of elephant grass cultivars (Pennisetum purpureum Schum.) chacterized by the RAPD technique, at LMGV/CCTA/UENF, in Campos dos Goytacazes, RJ.
Identification no. Embrapa Dairy Cattle Origin identification Origin
2 Mercker IPEACO - Água Limpa (MG)
4 Napier de Volta Grande IPEACO - Km 47 (RJ)
6 Pusa Na pier n° 2 IPEACO - Índia
8 Napier n° 2 IPEACO - Goiás
15 Pusa Gigante Napier IPEACO - Índia
25 Pusa Napier n°1 IPEACO - Índia
27 Mineiro IPEACO (MG)
30 Napier IPEACO - Pedro Leopoldo (MG)
and dTTP; 0.3 µmol L-1 primer (Table 2); 20 ng genomic DNA and a unit of Taq DNA polymerase (Pharmacia
Biotech, EUA). A thermal cycler was used (Perkin Elmer GeneAmp PCR System 9600) programmed for 95°C for 1 minute followed by 45 cycles of one minute at 94°C, 1 minute at 36°C and 2 minutes at 72°C and a final step for extension of 7 minutes at 72°C, using the fastest temperature transition mode available (1°C/1seg.). The amplification products (bands) were analyzed by electrophoresis and visualized after staining by ethydium bromide.
Band reading and data analysis
The RAPD profiles of each accession were obtained by the presence (1) or absence (0) of high intensity bands and the complement of the Nei & Li index (1 – IAB) (Nei & Li, 1979) was calculated as IAB = 2a/ (2a+b+c) where: a = number of bands present in both accessions, simultaneously; b = number of bands present only in accession A; c = number of bands present only in accession B.
Statistical analysis
Hierarchical clustering (closest neighbor) methods were used and optimization proposed by Tocher, quoted by Rao (1952) based on the matrix obtained from the arithmetical complement of the Nei & Li similarity index (1979). The statistical analyses were performed by the programs GENES, 0.1.0 version and STATISTICA version 95 (Statsoft Inc, Tulsa, Oklahoma, USA).
RESULTS AND DISCUSSION
RAPD Polymorphism
Thirty-seven primers were analyzed and a total of 167 amplification products (Table 2) was obtained with a mean of 4.51 bands per primer. This value is similar to the results reported by Virk et al. (1995) in rice, Sweeney & Danneberger (1994) in Poa annua L., Haley et al.
(1994) in common bean and Harvey & Botha (1996) in
Saccharum, in genetic divergence assessment by the
RAPD technique.
Ninety-four of 167 bands were polymorphic and 73 were monomorphic (2.54 polymorphic bands per primer and 1.97 monomorphic bands per primer). The OPAE-04 primer presented a high number of polymorphic bands (6) (Figure 1 and Table 2) together with the OPAF-10 and OPAF-11 primers.
Data Analysis
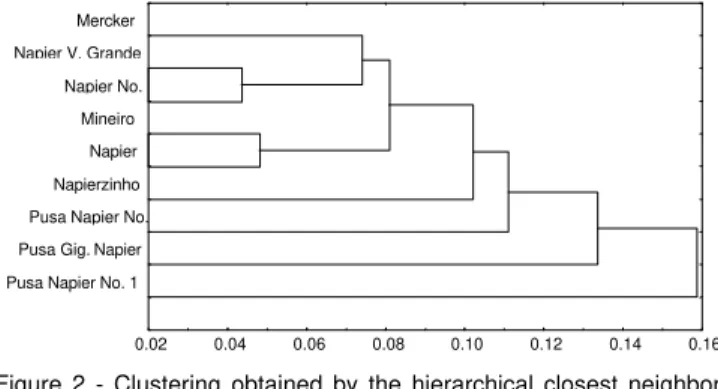
Analysis of the clustering by the Tocher optimization method based on the matrix of the complement of the Nei & Li index indicated three distinct groups, possibly forming heterotic groups (Table 3). The clustering by the closest neighbor hierarchical method (Figure 2) was very similar to that obtained by the Tocher method and only differed in the final disposition of the groups and the greater discrimination among the accessions.
Generally reduced separation was observed among the Mercker and the Napier type cultivars (Figure 2), contrary to information in the literature about the start of its introduction in Brazil, when two cultivars with well defined characteristics were known, Mercker and Napier (Otero, 1961). The Mercker accession (number 2 of the elephantgrass BAG) used in this study may not be an accession from the Mercker group, but rather from the Napier group as its original identification was probably lost during introduction to the Active Germplasm Bank.
The Mineiro cultivar clustered with the Napier cultivar by Tocher clustering (Group 1, Table 3), and were also placed together on the same branch of the dendrogram obtained by the hierarchical closest neighbor method (Figure 2). The Napier and Mineiro accessions were also observed within the same patterns of isoenzymatic bands by the isoenzymatic standard obtained by Daher et al. (1997a), and this confirms that the Mineiro cultivar is derived from selection among Napier cultivar progenies, currently forming one of the cultivars that occupies greatest cultivated area (Pereira, 1993).
The Napier accessions Volta Grande (4) and Napier no. 2 (8) were also very similar, based on the results of this study (Figure 2) and on the results obtained with the isoenzymatic markers in Daher et al. (1997a).
Figure 1 - λ phage marker digested with EcoRI and Hind III and band profiles generated by RAPD with the OPAE-04 primer in 1.2% agarose gel involving the nine elephant grass accessions described in Table 1.
λ 2 4 6 8 15 25 27 30 71
Figure 2 - Clustering obtained by the hierarchical closest neighbor method based on the arithmetical complement of the Nei & Li similarity index of nine elephant grass cultivars
(Pennisetum purpureum Schum.) assessed by LMGV/
CCTA/UENF, in Campos dos Goytacazes, RJ.
Pusa Napier No. 1 Pusa Gig. Napier Pusa Napier No.
Napierzinho Napier Mineiro Napier No. Napier V. Grande Mercker
Table 3 – Cluster analysis by the Tocher Optimization method obtained based on the arithmetical complement of the Nei & Li similarity index of nine elephant grass cultivars (Pennisetum purpureum Schum.) assessed by LMGV/CCTA/UENF, in Campos dos Goytacazes, RJ.
aThe number sequence indicates the entry of the clone in the group. bTable 1 lists the clones.
Similarly, the distribution of the Pusa Napier no. 2 (6), Pusa Gigante Napier (15) and Pusa Napier no. 1 (25) accessions in distinct and more distant groups compared to the other accessions (Groups 1, 2 and 3, respectively) in Table 3 and on independent branches, as shown in the dendrogram (Figure 2), was in line with the clustering obtained using the isoenzymatic markers presented in Daher et al. (1997a) where these were also placed in distinct groups. Furthermore, this illustrates the agreement between the genetic composition, expressed by the molecular markers (isoenzymes and RAPD) and the geographic diversity, related to the Indian origin of these materials confirming the more distant positioning of the Pusa Napier no. 2 (6), Pusa Gigante Napier (15) and Pusa Napier no. 1 (25) accessions compared to the others.
When the seven highest dissimilarity values (complement of the Nei & Li index) detected by RAPD were compared with the seven highest dissimilarity values (complement of the Jaccard index) detected by the isoenzymatic systems in Daher et al. (1997a), only two combinations did not coincide (2 x 15 and 8 x 15) while the accession pairs 8 x 25, 4 x 25, 25 x 27, 15 x 25 remained the most divergent in the two assessments (Table 4). On the other hand, only two pairs of accessions (4x8 and 27x30) coincided among the seven lowest values by least dissimilarity values.
The Pearson correlation coefficient among the dissimilarity estimates (Divergence) obtained by the RAPD technique and isoenzymes was 0.5176, and was significant by the t test (P < 0.01). This
indicates the consistency of both methods in obtaining genetic divergence estimates among elephantgrass accessions.
The use of compound samples was effective to conclude on the interpopulation genetic diversity. However, individual samples will have to be used to understand the intrapopulation genetic variability.
Table 2 - Primers from the Series OPERON Technologies with the respective numbers of polymorphic and monomorphic bands.
Primer from the Series OPERON Technol.
Number of polymorphic
band s
Number of mo nomorphic
band s
Total number of bands per
primer
OPAE-01 4 4 8
OPAE-02 1 1 2
OPAE-03 5 3 8
OPAE-04 6 1 7
OPAE-05 4 0 4
OPAE-06 5 5 1 0
OPAE-07 3 2 5
OPAE-08 4 2 6
OPAE-09 3 0 3
OPAE-10 2 3 5
OPAE-11 2 1 3
OPAE-12 2 1 3
OPAE-13 2 3 5
OPAE-14 1 1 2
OPAE-15 3 2 5
OPAE-16 4 2 6
OPAE-17 0 2 2
OPAF-04 5 3 8
OPAF-05 4 4 8
OPAF-06 1 4 5
OPAF-07 2 3 5
OPAF-10 6 0 6
OPAF-11 6 1 7
OPAF-12 5 1 6
OPAF-13 2 2 4
OPAF-14 1 2 3
OPAF-17 1 2 3
OPAF-18 1 1 2
OPAF-19 0 1 1
OPAG-02 2 3 5
OPAG-10 0 2 2
OPAG-11 3 0 3
OPAG-12 1 2 3
OPAG-13 0 1 1
OPK-04 2 1 3
OPL-16 1 3 4
OPO-19 0 4 4
TOTAL 9 4 7 3 167
Table 4 - Relationship of the seven first pairs of accessions that presented the greatest and least dissimiliarity estimates by the RAPD technique (arithmetical complement of the Nei & Li similarity index) and isoenzymes (arithmetical complement of the Jacard).
Value
Highest Lowest
Nei & Li Jacard Nei & Li Jacard 8 x 2 5 2 x 2 5 4 x 8 27 x 3 0 4 x 2 5 4 x 2 5 27 x 3 0 6 x 8 2 x 1 5 6 x 2 5 2 x 4 4 x 8 25 x 2 7 8 x 2 5 4 x 2 7 4 x 6 2 x 2 5 15 x 2 5 8 x 3 0 15 x 3 0 15 x 2 5 25 x 2 7 4 x 3 0 15 x 2 7 8 x 1 5 25 x 3 0 2 x 8 8 x 1 5
Cluster Cultivars
1
Napier de Volta Grande (4 )a,b, Napier n° 2 (8),
M e r c k e r (2 ) , Mi n e i ro (2 7 ) , Na p i e r ( 3 0 ) , Napierzinho (71) e Pusa Napier n° 2 (6) 2 Pusa Gigante Napier (15)
CONCLUSIONS
The markers enabled each one of the cultivars to be discriminated indicating that they are genetically different. The use of compound samples showed the existence of genetic diversity among the cultivars called Napier.
The genetic distance estimates obtained from RAPD DNA markers and the isoenzymatic markers were highly correlated, indicating the consistency of the methods for assessing the genetic divergence among elephantgrass accessions.
ACKNOWLEDGMENTS
To Embrapa Dairy Cattle for providing the cultivars used in this study. This work was supported by FENORTE.
REFERENCES
ALCÂNTARA, P.B.; ALCÂNTARA, V.B.G.; ALMEIDA, J.E. Estudo de vinte e cinco prováveis variedades de capim-elefante (Pennisetum purpureum
Schum.) Boletim da Indústria Animal, v.37, p.279-302, 1980. AUGUSTIN, E.; TCACENCO, F.A. Isoenzimatic characterization of
elephantgrass (Pennisetum purpureum Schum.) germplasm. Revista Brasileira de Genética, v.16, p.685-96, 1993.
BACH, E.E.; ALCÂNTARA, V.B.G.; ALCÂNTARA, P.B.; VEASEY, E.A. Análises bioquímicas e isoenzímicas de variedades de capim-elefante (Pennisetum purpureum Schum.) Scientia Agricola, v.52, p.19-25, 1998.
BOTREL, M.A.; XAVIER, D.F.; CARVALHO, M.M.; DAHER, R.F.; GOMES, F.T. Caracterização morfológica e agronômica de algumas cultivares de capim-elefante. Juiz de Fora: EMBRAPA-CNPGL, 1995. 24p. (Documentos, 60)
BRUNKEN, J.N. A systematic study of Pennisetum Sect. Pennisetum
(Graminea). American Journal of Botany, v.64, p.161-176, 1977. CARVALHO, M.M.; MOZZER, O.L.; SILVA, J.B.; FERREIRA, J.G. Identificação
de variedades e híbridos de capim-elefante (Pennisetum purpureum
Schum.) In: REUNIÃO DA SOCIEDADE BRASILEIRA DE ZOOTECNIA, 9., Viçosa, 1972. Anais. Viçosa: SBZ, 1972. p.209-210.
DAHER, R.F.; MORAES, C.F.; CRUZ, C.D.; PEREIRA, A.V.; XAVIER, D.F. Diversidade morfológica e isozimática em capim-elefante (Pennisetum purpureum Schum.). Revista Brasileira de Zootecnia, v.26, p.255-64, 1997a.
DAHER, R.F.; MORAES, C.F.; CRUZ, C.D.; PEREIRA, A.V.; XAVIER, D.F. Seleção de caracteres morfológicos discriminantes em capim-elefante (Pennisetum purpureum Schum.) Revista Brasileira de Zootecnia, v.26,
p.265-270, 1997b.
DOYLE, J.J.; DOYLE, J.L. Isolation of plant DNA from fresh tissue. Focus, v.12, p.13-15, 1987.
FERREIRA, M.E.; GRATTAPAGLIA, D. Introdução ao uso de marcadores moleculares em análise genética. 2.ed. Brasília: EMBRAPA, CENARGEN, 1996. 220p. (Documento, 20)
HALEY, S.D.; MIKLAS, P.N.; AFANADOR, L.; KELLY, J.D. Random amplified polymorfic DNA (RAPD) marker variability between and within gene pools of common bean. Journal of the American Society for Horticultural Science, v.119, p.122-125, 1994.
HARVEY, M.; BOTHA, F.C. Use of PCR-based methodologies for the determination of DNA diversity between Saccharum varieties. Euphytica, v.89, p.257-265, 1996.
MANARA, N.T.F. Citogenética de variedades do capim-elefante (Pennisetum purpureum Schum.) Piracicaba, 1973. 97p. Dissertação (Mestrado) – Escola Superior de Agricultura “Luiz de Queiroz”, Universidade de São Paulo.
MOZZER, O.L.; CARVALHO, M.M.; ENRICH, E.S. Competição de variedades e híbridos de capim-elefante (Pennisetum purpureum Schum.) para formação de capineiras em solo de cerrado. Pesquisa Agropecuária Brasileira. Série Agronômica, v.5, p.395-403, 1970.
NEI, M.; LI, W.H. Mathematical model for studying genetic variation in terms of restriction endonucleases. Proceedings of the National Academy of Science of the USA, v.76, p.5269-5273, 1979.
OTERO, J.R. Informações sobre algumas plantas forrageiras. 2.ed. Rio de Janeiro: SAI, 1961. 334p.
PEDREIRA, J.V.S.; CAMPOS, B.E.S. Competição de cinco variedades de capim-elefante Pennisetum purpureum Schum. Boletim da Indústria Animal, v.32, p.325-329, 1975.
PEREIRA, A.V. Escolha de variedades de capim-elefante. In: SIMPÓSIO SOBRE MANEJO DE PASTAGEM, 10., Piracicaba, 1993. Anais.
Piracicaba: FEALQ, 1993. p.47-62.
RAO, R.C. Advanced statistical methods in biometric research. New York: Jonh Wiley and Sons, 1952. 390p.
SWEENEY, P.M.; DANNEBERGER, T.K. Random amplified polymorphic DNA in perennial ryegrass: A comparison of bulk samples vs. individuals.
HortScience, v.29, p.624-626, 1994.
TCACENCO, F.A. Seleção de caracteres para a classificação de três cultivares de capim-elefante. Pasturas Tropicales, v.10, p.14-19, 1988. TCACENCO, F.A.; BOTREL, M. de A. Identificação e avaliação de acessos e
cultivares de capim-elefante. In: CARVALHO, M.M.; ALVIM, M.J.; XAVIER, D.F.; CARVALHO, L. de A. (Ed.) Capim-elefante: Produção e utilização. Coronel Pacheco: EMBRAPA, CNPGL, 1994. p.1-30.
VIRK, P.S.; FORD-LLOYD, B.V.; JACKSON, M.T.; NENBURY, H.J. Use of RAPD for the study of diversity within plant germplasm collections.
Heredity, v.74, p.170-179, 1995.
WILLIAMS, J.G.; KUBELIK, A.R.; LIVAK, K.J.; RAFALSKI, L.A.; TINGEY, S.V. DNA polymorphism amplified by arbitrary primers are useful as genetic markers. Nucleic Acids Research, v.18, p.6531-6535, 1990.