Hypothesis testing of genetic similarity based on RAPD data using
Mantel tests and model matrices
Flávia Melo Rodrigues
1, José Alexandre Felizola Diniz-Filho
2, Luiz Artur Mendes Bataus
3and Rogério Pereira Bastos
21
Programa de Pós-Graduação em Biologia (Genética), ICB, Universidade Federal de Goiás, Goiânia,
GO, Brazil.
2
Departamento de Biologia Geral, ICB, Universidade Federal de Goiás, Goiânia, GO, Brazil.
3Departamento de Ciências Fisiológicas, ICB, Universidade Federal de Goiás, Goiânia, GO, Brazil.
Abstract
Clustering and ordination procedures in multivariate analyses have been widely used to describe patterns of genetic distances. However, in some cases, such as when dealing with Jaccard coefficients based on RAPD data, these techniques may fail to represent genetic distances because of the high dimensionality of the genetic distances caused by stochastic variation in DNA fragments among the units analyzed (species or populations). In this note, we show how Mantel tests can be used to test hypotheses about genetic distances and avoid problems with multivariate data representation. The procedure is illustrated with RAPD data comparing 20 anuran species from the cerrado, in which Jaccard genetic distances were compared to three model matrices linking the species at distinct taxonomic levels.
Key words:Anura, clustering, genetic distances, Mantel test, RAPD. Received: January 24, 2001; accepted: November 4, 2002.
Introduction
The multivariate analysis of genetic distances in pop-ulation genetics and molecular systematics has been one of the most important tools for recovering spatial or taxo-nomic structure in data (Lessa, 1990; Swoffordet al., 1996; Meyer, 1997). Among the many analytical procedures available, the unweighted pair-group method using arith-metic averages (UPGMA) and, more recently, the neigh-bor-joining (NJ) clustering algorithms, as well as some ordination techniques, such as principal coordinates (PCORD) and non-metric multidimensional scaling (NMDS), have been widely used to describe genetic dis-tances and to assess the structure of genetic data in a re-duced dimensional space.
When dealing with multivariate analyses, it is always desirable to verify the distortions in the output caused by the dimensional reduction process, and to determine whether the representation of genetic distances in one, two or three dimensions is in fact informative. In UPGMA clus-tering, the most commonly used measure of this distortion is the cophenetic correlation coefficient, which measures
the correspondence between the original genetic distances among samples and the distances defined along the phenogram (Sneath and Sokal, 1973; Rodrigues and Diniz-Filho, 1998). A similar approach can be used to eval-uate the results from ordination displays, although in this case there are also other specific measures of distortion, such as the accumulated explanatory power of the eigen-values in PCORD or the “stress” value (S) in NMDS (John-son and Wichern 1992).
Different microevolutionary processes acting at the populational level, especially those generating clinal or re-ticulated patterns of genetic variation across geographic space, always produce patterns of population differentia-tion that are difficult to represent in a few dimensions by clustering or ordination techniques (Lessa, 1990; Rodri-gues and Diniz-Filho, 1998). Stochastic evolutionary pro-cesses at higher taxonomic levels, such as independent evolution by Brownian motion of quantitative characters or gene frequencies (Hansen and Martins, 1996; Diniz-Filho, 2000), generate a similar difficulty in representing genetic distances among species. Another problem in using these multivariate procedures is that they are usually applied in an exploratory way, without a formal statistical test of the hypotheses about the relationships among populations or species (Neff and Marcus, 1980). The main problem with
standard statistical tests used to compare genetic distances directly is that the elements of genetic distance matrices are not independent, such that Type I errors are inflated to an unknown degree (Manly, 1997).
Despite these problems, in most cases the cophenetic correlations from UPGMA clustering of genetic distances, based on isozyme data from local populations, are elevated (Rodrigues and Diniz-Filho, 1998). However, using ran-dom amplified polymorphic DNA (RAPD) to assess genetic variability may be slightly more complicated com-pared to isozymes since the nature of the data may generate a large amount of random variation, especially at higher taxonomic levels (Hilliset al., 1996). More seriously, many papers deal with individuals (and not with allele frequen-cies in local populations or samples) and try to cluster or or-dinate them (see for example Colombo et al., 2000). Although careful inspection of the results could eliminate part of this random noise (such as choosing only the stron-ger, repeatable bands) (see Dominguez, 1998), this is usu-ally a subjective procedure and does not necessarily avoid the problems of high dimensionality in the genetic structure itself.
In these cases, the association or correlation between the variables used (frequencies or presence/absence of bands) is low and, consequently, the Jaccard coefficients commonly used to estimate genetic similarity among indi-viduals are defined in a genetic space with a very high num-ber of orthogonal dimensions. Thus, despite the usefulness of RAPD in assessing patterns of genetic divergence among local populations (Swoffordet al., 1996; Sunnucks, 2000; Russel et al., 2002), the clustering and ordination techniques commonly used may fail to accurately represent genetic distances, especially when dealing with Jaccard co-efficients calculated among individuals. This problem can often be detected as a low cophenetic correlation coeffi-cient, a low support of many clusters following bootstrap-ping of the genetic distances, and low relative eigenvalues of the ordination axes (see Lessa, 1990; Rodrigues and Diniz-Filho, 1998).
Mantel tests have been widely used to evaluate pat-terns of genetic distance, especially to test the statistical significance of matrix correlation between genetic and geo-graphic distances (Smouseet al., 1986; Manly, 1985, 1997; Diniz-Filho, 1998, 2000). In this note, we show how Man-tel tests can be used in a more general way to test different hypotheses about genetic distances. This procedure can be very useful when dealing especially with RAPD data in which the elevated number of dimensions makes the visual inspection of patterns difficult and complicates the testing of hypotheses using standard clustering and ordination techniques.
Mantel tests and model matrices
The Mantel test (Z) of matrix correspondence is given by:
Z =ΣiΣj(EijMij)
Where Eijand Mijare theith andjth elements of the
square symmetric matricesMandEbeing compared. The statistical significance of this association is measured by a randomization procedure in which the order of the elements in one of these matrices is randomly permutated several times and a Z-value is calculated for each permutation (Manly, 1985, 1997; Diniz-Filho, 1998).
Because the Z-value of the Mantel test is only a sum of products between the elements of the matrices, its value depends on the number of samples and on the magnitude of the numbers in the matrices (different scales of geographic distances, for example, that can be measured in meters or kilometers). However, it is possible to show that this Z-value is in fact the non-centered numerator of the Pearson product-moment correlation coefficient between the elements ofMandE(Manly, 1985). Since the means and variances of these elements remain unchanged with the permutations, the Z-value and the Pearson correlation maintain a monotonic relationship. In other words, the Mantel test, by randomization of the Z-values, is a proce-dure to test the statistical significance of the matrix correla-tion coefficient. The advantage of using the matrix correlation instead of Z-value as a descriptor of the rela-tionship is that it varies between -1.0 and 1.0, such that the strength of the association between the two matrices is eas-ier to interpret.
Most applications of the Mantel test and matrix corre-lation deal with continuous distance or similarity values, such as pairwise genetic, geographic or environmental dis-tances between local populations (Diniz-Filho, 1998, 2000; Telleset al. 2001). However, it is possible to compare the genetic distances with discrete matrices in which the ele-ments are one or zero, indicating that samples are “linked” or not, respectively. The pattern of links established in one of the matrices, which we term here the “model matrix”, al-lows one to test different hypotheses about structure in ge-netic distances.
analysis of variance (ANOVA) (a completely random de-sign), and tests by randomization if pairwise genetic dis-tances between individuals within a locality are smaller than the genetic distances between individuals at different localities. In other words, one can test whether localities are genetically different, is a manner analogous to one-way analysis of molecular variance (AMOVA).
There are two main advantages of this general ap-proach using the Mantel test, when compared to clustering and ordination procedures: 1) Hypotheses can be tested sta-tistically instead of by visual inspection of the genetic dis-tances in a phenogram or reduced dimensional space, and 2) this procedure uses all information in the genetic dis-tances, making it less sensitive to the distortions caused by dimensional reduction. Consequently, this approach is still useful when dealing with high-dimensional systems that cannot be represented in a few ordination axes.
Genetic divergence among Anuran species assessed by RAPD
To illustrate the procedures described above, we ana-lyzed the RAPD data of 20 species of frogs collected in cen-tral Brazil. Specimens were collected at two sites in the state of Goiás (Florestal Experimental Station - EFLEX, in the municipality of Silvânia and on “Lagoa Grande” farm, in the municipality of Pontalina). The species were distrib-uted in nine genera and three families (Hylidae, Leptodactylidae and Bufonidae). Although the RAPD tech-nique is better applied to compare local populations or closely related species rather than distant species as done here (Swoffordet al., 1996; Sunnucks, 2000), the high level of polymorphism obtained in this dataset strongly inflated the number of dimensions in the genetic similarity and thus furnished a very useful example of how to use the Mantel test with model matrices. Data obtained at the populational level may have the same problems, especially when analyz-ing many primers and fragments in individuals from
differ-ent populations (see Colomboet al., 2000, for a recent ex-ample).
DNA was isolated from blood and liver using the ex-traction procedures described by Sambrooket al. (2001), with a few modifications. The PCRs were done in a 20µL reaction volume containing 30 ng of genomic DNA, 10 ng of primer, 1.5 units ofTaqDNA polymerase (Pharmacia), 2.5 mM of each dNTP and 10 mM Tris-HCl, pH 8.0, 50 mM KCl and 2.5 mM MgCl2. Fifty arbitrary primers
were tested, of which nine were chosen because of their am-plification pattern the quantity of fragments produced, their quality and their reproducibility for all species. DNA was amplified in a thermocycler (PTC-100 MJ Research) pro-grammed as follows: 94 °C for 5 min, followed by 40 cy-cles of 30 s at 94 °C, 1 min at 35 °C and 1 min at 72 °C, with a final stage of 3 min at 72 °C, and then maintained at 4 °C prior to analysis. The amplification products were analyzed by electrophoresis in 1.5% agarose gels, stained with ethidium bromide (0.5µg/mL). Fragments were visualized under UV light and photographed for further codification. Only strong, reproducible bands were used.
A total of 133 fragments were obtained from the nine primers and coded as one or zero to indicate their presence or absence in each species, respectively. All of the frag-ments were polymorphic, with a size ranging from 100 to 1700 bp. The number of fragments per primer varied from 7 to 24 (Table I). The Jaccard coefficients were used to estab-lish a pairwise genetic similarity matrix between individu-als (i.e., species) that was initially analyzed by UPGMA clustering and different ordination procedures using ver-sion 1.5 of the software NTSYS-Pc (Rohlf, 1989).
All standard clustering and ordination procedures failed to produce an adequate representation of the genetic similarity. The cophenetic correlation of the UPGMA was 0.680, a relatively low value by standard criterion (usually only values above 0.8 provide a reasonable representation of similarity). The explanation power of the first two
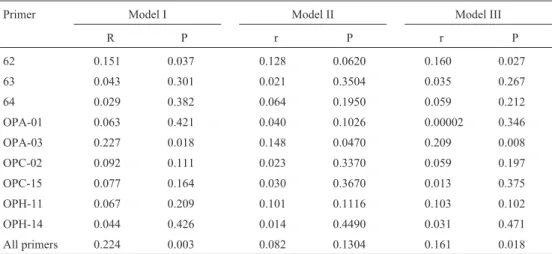
eigen-Table I- Matrix correlations (r) and their Type I errors (P) obtained using Mantel tests with 5000 random permutations compare of genetic similarities (Jaccard coefficient) based individual primer and overall RAPD data in each model matrix expresses a distinct relationship model for the species.
Primer Model I Model II Model III
R P r P r P
62 0.151 0.037 0.128 0.0620 0.160 0.027
63 0.043 0.301 0.021 0.3504 0.035 0.267
64 0.029 0.382 0.064 0.1950 0.059 0.212
OPA-01 0.063 0.421 0.040 0.1026 0.00002 0.346
OPA-03 0.227 0.018 0.148 0.0470 0.209 0.008
OPC-02 0.092 0.111 0.023 0.3370 0.059 0.197
OPC-15 0.077 0.164 0.030 0.3670 0.013 0.375
OPH-11 0.067 0.209 0.101 0.1116 0.103 0.102
OPH-14 0.044 0.426 0.014 0.4490 0.031 0.471
values obtained using principal coordinate analysis was only 16.8%, and indeed both eigenvalues were lower than null expectation under a broken-stick distribution (see Jackson, 1993). These results indicated a large amount of random variation in the data and a poor structure, such that visual inspection for patterns world have been useless. Even representin the Jaccard coefficients using non-metric multidimensional scaling (NMDS), a powerful non-linear ordination technique, failed, with a stress value equal to 0.697 and 0.629, after optimizing the ordination solution in two and three dimensions, respectively. In NMDS, only stress values less than 0.01 are considered adequate (John-son and Wichern, 1992), and this low value cannot be achieved even when representing data in five dimensions (the maximum capacity for NMDS in NTSYS 1.5).
Before abandoning the data as useless for revealing any relationship among species, we sought to develope hy-potheses of relatedness among these species and to create model matrices to represent them. The most obvious model of relationships was the standard taxonomic classification of the species, which at least partly reflect evolutionary pat-terns over time. We first created a model matrix (Model I) with a value of one if a given pair of species belonged to the same genus and zero elsewhere. We used the same reason-ing to create another model matrix representreason-ing the connec-tions among species in terms of their families (Model II). Finally, a third matrix Model III was constructed by com-bining the two previous matrices, in which a value of 1.0 was assigned to pairs of species in the same genus, 0.5 was assigned to species in different genera but in the same fam-ily, and zero indicated that a the pair of species being com-pared belonged to different families. The three relationships expressed by the model matrices are shown in Figure 1.
Mantel tests were then used to assess the statistical significance of the matrix correlation between the Jaccard similarity matrix and the model matrices. Statistical signifi-cance was tested using 5,000 random permutations. To de-termine which primer contributed most to the overall genetic structure, we also constructed different Jaccard similarity matrices using the fragments obtained from each primer (Table I). Primers 062 and OPA-03 tended to differ-entiate species in different genera and families, although the ability to discriminate as revealed by the squared corre-lation coefficient (R2), was usually low, indicating a large amount of random variation. The R2values, which were usually very low (frequently less than 5%), were equivalent to the intraclass correlations in ANOVA (Sokal and Rohlf, 1995), indicating that the relative amount of variation among groups (taxa) was very low compared to unique variation at the species level.
One interesting aspect of these analyses was that the accumulation of the two taxonomic levels used to create Model III, did not increase the magnitude of R2when com-pared to Models I and II, indicating that the two levels were
not additive in the expression of the genetic variability. In-deed, the species seemed to be almost independent for these data and the hierarchical structure at the genus and family levels had only a small effect when compared to the
tion within each lineage. The high level of polymorphism indicated that the species are very different in their RAPD markers and more or less equidistant in the hyperspace cre-ated by these data. This probably occurred because the spe-cies diverged a long time ago, such that common fragments of RAPD were lost by random processes and any phylogen-etic signal was destroyed. In agreement, with this, paleon-tological and molecular data indicate that two of the families analyzed here diverged more than 50 million of years ago (Hayet al., 1995; Hedges and Maxson, 1993).
Despite the difficulties in using RAPD data to estab-lish phylogenetic or taxonomic relationships in the exam-ple of very distantly related species used here, the main purpose of this paper was to describe alternative multi-variate procedures for analyzing highly dimensional genetic distances, especially when these are based on indi-viduals. This approach may be used to select only more in-formative primers for further clustering and ordination analyses. Associating the Mantel test with model matrices allows one to explore alternative hypotheses of the genetic relationship among individuals using explicit statistical tests and not simply visual inspection of the results from multivariate analyses.
Acknowledgments
The authors thank Leandro R. Monteiro and Apa-recido Divino da Cruz for helpful discussions and sugges-tions to previous versions of this work, and Mariana Pires de Campos Telles for critical reading of previous versions of the manuscript. Financial support was provide by CAPES (master’s degree scholarship to F.M.R.), CNPq (research fellowships to J.A.F.D.F. and R.P.B. and PCOPG 520804/99-6) and FUNAPE/UFG (grant to F.M.R.).
References
Cheverud JM, Wagner GP, Dow MM (1989) Methods for the comparative analysis of variation patterns. Syst Zool 38:201-213.
Colombo C, Second G and Charrier A (2000) Diversity within American cassava germ plasm based on RAPD markers. Genet Mol Biol 23:189-200.
Diniz-Filho JAF (1998) Análise de autocorrelação espacial: inferências microevolutivas e aplicações em genética de populações. In: Duarte FAM (ed) Série Monografias 6, So-ciedade Brasileira de Genética, Ribeirão Preto, pp 83-145. Diniz-Filho JAF (2000) Métodos Filogenéticos Comparativos.
Holos, Ribeirão Preto, 162 pp.
Dominguez PA (1998) An evaluation of RAPD fragment repro-ductibility and nature. Mol Ecol 7:1347-1357.
Hansen TF and Martins EP (1996) Translating between micro-evolutionary process and macromicro-evolutionary patterns: the correlation structure of interspecific data. Evolution 50:1404-1417.
Hay JM, Ruvinsky H, Hedges SB and Maxson LR (1995) Phylo-genetic relationships of amphibian families inferred from
DNA sequences of mitochondrial 12S and 16S ribosomal RNA genes. Mol Biol Evol 12:928-937.
Hedges SB and LR Maxson (1993) A molecular perspective on lissamphibian phylogeny. Herpet Monogr 7:42-45. Hillis DM, Mable BK and Moritz C (1996) Applications of
mo-lecular systematics: the state of the field and a look to the fu-ture. In: Hillis DM, Moritz C, Marble BK (eds) Molecular Systematics. 2nd ed. Sinauer Press, Sunderland, Massachu-setts, pp 515-543.
Jackson DA (1993) Stopping rules in principal component analy-sis: a comparison of heuristic and statistical approaches. Ecology 74:2204-2214.
Johnson RA and Wichern DW (1992) Applied Multivariate Sta-tistical Analysis. 3nd. ed. Chapman and Hall, London, 642 pp.
Lessa E (1990) Multidimensional analysis of geographic genetic structure. Syst Zool 39:242-252.
Manly BFJ (1985) The Statistics of Natural Selection. Chapman and Hall, London, 484 pp.
Manly BFJ (1997) Randomization, Bootstrap and Monte Carlo Methods in Biology. Chapman and Hall, London, 424 pp. Meyer D (1997) Análise filogenética de seqüências de DNA. In:
Amorim DS (ed) Elementos Básicos de Sistemática Filo-genética. Holos, Ribeirão Preto, pp 187-212.
Neff NA and Marcus LF (1980) A Survey of Multivariate Methods for Systematics. Privately published, New York, 234 pp.
Rodrigues FM and Diniz-Filho JAF (1998) Hierarchical structure of distances: effects of matrix size, spatial distribution and correlation structure among gene frequencies. Genet Mol Biol 21:233-240.
Rohlf FJ (1989) NTSYS: Numerical Taxonomy and Multivariate Analysis System. Exeter softwares, New York.
Russel JD, Waycott M, Chappill JA and James SH (2002) Molec-ular phylogenetic analysis of the evolution of complex hibri-dity inIsotoma petraea.Evolution 56:1296-1302.
Sambrook J, Fritsch EF and Maniatis T (1989) Molecular Clon-ing: a Laboratory Manual. 2nd. ed. Cold Spring Harbor Lab-oratory Press, New York, 999 pp.
Smouse PE, Long JC and Sokal RR (1986) Multiple regression and correlation extensions of the Mantel test of matrix corre-spondence. Syst Zool 35:627-632.
Sneath PHA and Sokal RR (1973) Numerical Taxonomy. W.H. Freeman, San Francisco, 576 pp.
Sokal RR and Rohlf FJ (1995) Biometry, 3rd. ed. W.H. Freeman, New York, 887 pp.
Sokal RR, Smouse PE and Neel JV (1986) The genetic structure of a tribal population, the Yanomama indians. XV. Patterns inferred by autocorrelation analysis. Genetics 114:259-287. Sunnucks P (2000) Efficient genetic markers for population
biol-ogy. Trends Ecol Evol 15:199-203.
Swofford DL, Olsen GJ, Waddell PJ and Hillis DM (1996) Phy-logeny inference. In: Hillis DM, Moritz C and Marble BK (eds) Molecular Systematics. Sinauer Press, Sunderland, Massachusetts, pp 407-514.