INTRODUCTION
Genetic improvement of the common bean (Phaseolus vulgaris L.) in Latin America has been char-acterized by conservative breeding strategies designed to adhere to rigorous consumer preferences for seed size, shape and color, and to overcome constraints, mainly dis-eases, that affect common bean production in the tropics (Voysest et al., 1994). These factors have reduced the germplasm sources used in hybridizations and have lim-ited the genetic variability available for breeding programs. The cultivars, however, are characterized by ex-tensive genetic variation. Currently, this variability is or-ganized into two main germplasm groups represented by Middle American (Central and North America) and Andean South American (south of the Andes) domestica-tion centers. These groups have been subdivided into races, based mainly on morphological, agronomical, and bio-chemical evaluation of the corresponding germplasm (Singh et al., 1991). After this classification, it became evident that the materials used in hybridizations were simi-lar. Recent studies with DNA markers have confirmed the existence of these two germplasm groups represented by the above domestication centers (Miklas and Kelly, 1992; Skroch et al., 1992a,b; Sonnante et al., 1994; Tohme et al., 1996). Few studies, however, have commented on the subdivision of these centers into races.
Considering the importance of these races for germplasm management and genetic improvement, and the hypothesis that a greater combination ability is expected in inter-racial crossings (Nienhuis and Singh, 1988; Singh et al., 1991), it is important that this racial classification and the genetic variability involved be evaluated by alter-native techniques, such as RAPD markers, to assist in the management and utilization of this germplasm.
For genetic improvement, the usefulness of mo-lecular markers will increase as their capacity to predict the behavior of crosses in field experiments also increases. Such prediction is possible when there is an association between the loci controlling molecular traits and those controlling morpho-agronomical traits.
The number of studies in which an evaluation of genetic divergence using molecular markers is associated with other techniques frequently used by plant breeders is limited. Diallel crosses have traditionally been employed to choose parents in hybridization programs. In such crosses, the specific combination ability (SCA) is used as an indicator of the variability present among crosses, since this ability is a function of the divergence among the par-ents and of the occurrence of dominance (Falconer, 1981). Thus, one means of verifying the potential of RAPD mark-ers as predictors of variability among crosses is by corre-lating the divergence evaluated by these markers with the SCA of a diallel. Another important association is with heterosis, since the existence of this parameter also de-pends on the divergence among cultivars. If these correla-tions are elevated, one may infer that the markers are good predictors of a population’s behavior.
The genetic divergence of 27 common bean culti-vars from different races was evaluated using RAPD mark-ers. The level of association of this divergence with some indirect variability estimates obtained in field experiments
GENETIC DIVERGENCE AMONG COMMON BEAN CULTIVARS FROM
DIFFERENT RACES BASED ON RAPD MARKERS*
Jair Moura Duarte, João Bosco dos Santos and Leonardo Cunha Melo
A
BSTRACTThe genetic divergence of 27 common bean (Phaseolus vulgaris L.) cultivars from different races was evaluated using RAPD markers. The association of this divergence with some indirect variability estimates obtained in field experiments was also assessed. Genetic distances were calculated using Sorensen-Dice’s similarity coefficient, displayed in a dendrogram (UPGMA method), and by projection in two-dimensional space. Analysis of molecular variance (AMOVA) was used to evaluate the distribution of variance between and within domestication centers. RAPD marker genetic diversity within these centers was also calculated. The correlations between estimates of genetic distances obtained with RAPD markers and estimates of Mahalanobis’ generalized distances, specific combination ability, and midparent heterosis obtained from morpho-agronomical traits were also determined. RAPD markers were efficient in separating cultivars according to domestication centers. How-ever, only for Middle American domestication center was there good agreement between the grouping obtained and the proposed classification of races. The genetic divergence obtained with these markers was similar to that provided by morpho-agronomical traits. RAPD markers, however, were not efficient in predicting the specific combination ability and midparent heterosis expressed in crosses.
*Part of a thesis presented by J.M.D. to the Universidade Federal de Lavras, Lavras, MG, in partial fulfillment of the requirements for the Master’s de-gree.
was also estimated to evaluate the usefulness of these mark-ers as predictors of morpho-agronomical variability among cultivars.
MATERIAL AND METHODS
Germplasm
Twenty-seven common bean cultivars belonging to five of the six races described by Singh et al. (1991) were used in this study (Table I).
RAPD
Fifteen seeds of each cultivar were germinated in a greenhouse, and 2 g of immature unifoliate leaves was used for extracting DNA essentially as described by Nienhuis et al. (1995). The DNA concentration was determined us-ing a DNA fluorometer (Hoeffer Scientific, San Francisco, CA, USA).
The RAPD reaction mixture was as described by Nienhuis et al. (1995). The reactions were performed in glass capillary tubes in a thermal cycler (Idaho Technol-ogy, Idaho Falls, ID, USA) programmed to cycle 40 times
under the following conditions: for the first two cycles, denaturation for 60 s at 91oC, annealing for 7 s at 42oC,
and elongation for 70 s at 72oC; the subsequent 38 cycles
were run with the denaturation time reduced to 1 s at 91oC.
The 40 cycles were followed by a 4-min hold at 72oC.
After amplification, the reaction products were separated by electrophoresis in 1.0% agarose gels, stained with ethidium bromide, and photographed under ultraviolet light with Polaroid 667 film.
A total of 33 primers (Operon Technologies, Inc., Alameda, CA, USA) were used based on the band resolu-tion and polymorphism they provided. Informaresolu-tion on spe-cific primers is available from the authors. Polymorphic bands were classified as intense, medium, or faint, based on resolution and degree of amplification (visual evalua-tion). Only bands classified as intense or medium were included in the analysis.
Data analysis
The DNA bands were scored as 0 (absence) or 1 (presence). Estimates of genetic similarity were expressed as Sorensen-Dice’s coefficient of similarity (Dice, 1945; Sorensen, 1948) using the equation GSij = 2a/(2a + b + c),
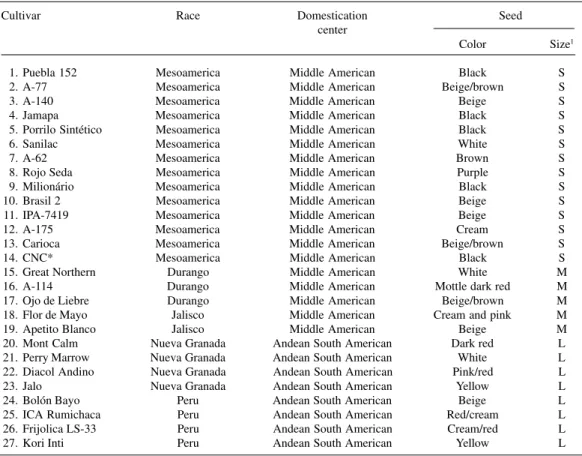
Table I - Common bean cultivars, their races, domestication centers and seed characteristics.
Cultivar Race Domestication Seed
center
Color Size1
1. Puebla 152 Mesoamerica Middle American Black S
2. A-77 Mesoamerica Middle American Beige/brown S
3. A-140 Mesoamerica Middle American Beige S
4. Jamapa Mesoamerica Middle American Black S
5. Porrilo Sintético Mesoamerica Middle American Black S
6. Sanilac Mesoamerica Middle American White S
7. A-62 Mesoamerica Middle American Brown S
8. Rojo Seda Mesoamerica Middle American Purple S
9. Milionário Mesoamerica Middle American Black S
10. Brasil 2 Mesoamerica Middle American Beige S
11. IPA-7419 Mesoamerica Middle American Beige S
12. A-175 Mesoamerica Middle American Cream S
13. Carioca Mesoamerica Middle American Beige/brown S
14. CNC* Mesoamerica Middle American Black S
15. Great Northern Durango Middle American White M
16. A-114 Durango Middle American Mottle dark red M
17. Ojo de Liebre Durango Middle American Beige/brown M
18. Flor de Mayo Jalisco Middle American Cream and pink M
19. Apetito Blanco Jalisco Middle American Beige M
20. Mont Calm Nueva Granada Andean South American Dark red L 21. Perry Marrow Nueva Granada Andean South American White L 22. Diacol Andino Nueva Granada Andean South American Pink/red L
23. Jalo Nueva Granada Andean South American Yellow L
24. Bolón Bayo Peru Andean South American Beige L
25. ICA Rumichaca Peru Andean South American Red/cream L 26. Frijolica LS-33 Peru Andean South American Cream/red L
27. Kori Inti Peru Andean South American Yellow L
* CNC = Compuesto Negro Chimaltenango; 1S = Small (100 seeds < 25 g); M = Medium (100 seeds ≥ 25 g to ≤ 40 g); L
where GSij is the genetic similarity between two cultivars, i and j, a is the number of bands present in both i and j, b is the number of bands present in i and absent in j, and c is the number of bands present in j and absent in i. This defi-nition of similarity excludes bands that are absent in both cultivars since mutual absence cannot necessarily be at-tributed to a common cause and therefore to similarity. Weighting by a factor of two the bands that coincide al-lows better differentiation of cultivars with a low level of genetic similarity.
Conversion to genetic distance (GD) was done us-ing the equation GDij = 1 - GSij. Errors associated with each genetic distance were calculated according to Skroch et al. (1992b) using the equations: variance (V) = nd(1 - d)/ (n - 1) and estimated standard error (E) = (V/n)1/2, where V corresponds to the variance of the genetic distance between each pair of cultivars, d is the genetic distance between each pair of cultivars, and n corresponds to the total num-ber of bands used to estimate genetic distance.
The 27 x 27 matrix of GD estimates was analyzed by the UPGMA option of the software NTSYS-PC, ver-sion 1.70 (Rohlf, 1992). Dendrograms were created with the TREE program of NTSYS. This matrix also was re-duced to two dimensions by projecting the cultivars in two-dimensional space (Cruz and Viana, 1994) using the soft-ware GENES (Cruz, 1997).
Analysis of molecular variance
The analysis of molecular variance (AMOVA) pro-cedure (Excoffier et al., 1992) was used to calculate the variance between and within domestication centers. This technique treats genetic distances as deviations from a group mean position, and uses the squared deviations as variances. The total sums of squares of genetic distances can then be partitioned into components that represent the within-domestication center and the between-domestica-tion center mean squares. The resulting test statistic, ΦST, is the ratio of the between-domestication center mean square to the total mean square and represents the correla-tion between random genetic accessions within a group relative to random accessions from the population at large. While performing AMOVA, the distribution of dis-tances between cultivars was found to be very far from normal. Therefore, the level of significance of ΦST was tested by random permutations, as recommended by Excoffier et al. (1992). In this procedure, the cultivars were assigned to domestication centers randomly and the ΦST was determined. This process was repeated 10,000 times, with different random assignments of the cultivars to do-mestication centers for each repetition; a distribution of ΦST values for randomly assigned was thus generated. This distribution was compared with the value for the actual grouping of cultivars determined for domestication cen-ters. These analyses were performed using the software AMOVA 1.55 (Excoffier, 1995).
RAPD marker diversity
For each RAPD band, marker diversity (h) was estimated within each domestication center (Middle Ameri-can and Andean South AmeriAmeri-can) as Nei’s gene diversity at a locus: h = (1 - ∑x2)n/(n - 1) = 2pqn/(n - 1), where p is
the frequency of presence and q is the frequency of ab-sence of RAPD amplification at a locus and n is the num-ber of cultivars evaluated, averaged over all loci (Nei, 1987). The maximum diversity for each domestication center was obtained with the equation n/[2(n - 1)].
Comparison between RAPD markers and morpho-agronomical traits
Using results presented by Abreu (1997) for Mahalanobis’ distance, specific combination ability and midparent heterosis (as %), for 13 of the cultivars pre-sented in Table I (Mont Calm, A-62, Brazil 2, Perry Mar-row, Great Northern, A-114, A-175, Diacol Andino, Ca-rioca, Compuesto Negro Chimaltenango, Flor de Mayo, Ojo of Liebre and Apetito Blanco), Spearman’s correla-tions were estimated for the genetic distances obtained with RAPD markers and the estimates mentioned previously. The aim of these comparisons was to evaluate the useful-ness of RAPD markers as predictors of morpho-agrono-mical variability in the cultivars studied.
RESULTS AND DISCUSSION
RAPD reaction
The 33 primers used generated 265 amplification products (bands), with an average of 8.03 bands per primer. Of these, 137 were polymorphic (4.15 bands per primer) and 128 were monomorphic (3.88 bands per primer). The number of polymorphic bands varied from one for the prim-ers OPA-02 and OPQ-04 to eight for the primprim-ers OPD-08 and OPV-10.
The level of polymorphism was superior to previ-ous reports for the common bean (Skroch et al., 1992a,b; Haley et al., 1994; Beebe et al., 1995; Vasconcelos et al., 1996), but was similar to that obtained by Johns et al. (1997). This intraspecies polymorphism is dependent on the level of divergence among the genotypes studied. The elevated level of polymorphism may have been in-fluenced because the primers used were strictly pre-se-lected with regard to the number and quality of the am-plification products.
The 137 polymorphic bands used were more than sufficient for an adequate evaluation of genetic divergence. In a study of 60 common bean cultivars from Chile, Johns et al. (1997) used bootstrapping to show that 50 bands sampled randomly produced the same clustering as ob-tained with 106 bands. Other studies that used bootstrapping have also shown that with ≥ 100 RAPD
markers the coefficient of variation of genetic distances among genotypes stabilizes (Nienhuis et al., 1995).
Evaluation of genetic divergence
The mean genetic distance for 351 distances was 0.44 ± 0.03 (range, 0.03-0.91). The smallest genetic dis-tance obtained was for cultivars belonging to Mesoamerica race (Jamapa x Porrilo Sintético) and the largest was for cultivars belonging to distinct domestication centers (Milionário x Jalo). In general, all the larger distances were obtained for cultivars belonging to distinct domestication centers, and in only two cases (Jamapa x Porrilo Sintético and Bolón Bayo x Kori Inti) was the difference not sig-nificant from zero.
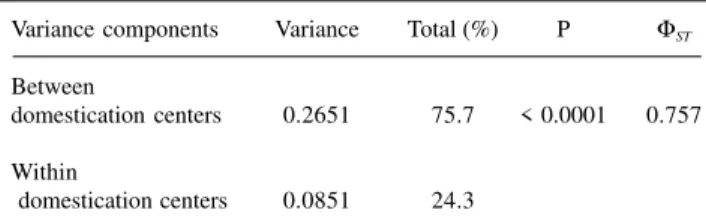
Based on the matrix of genetic distances, three dis-tinct procedures (analysis of molecular variance or AMOVA, clustering through UPGMA and projection of the distances in two-dimensional space) were used to evalu-ate the efficiency of RAPD markers in grouping the culti-vars according to the classification by domestication cen-ters and races. The greatest variation determined by AMOVA (75.7%) occurred among domestication centers, with a ΦST value of 0.757 (Table II). A permutational test to evaluate the significance of this component showed that it was highly significant; among 10,000 random permuta-tions, the highest ΦST obtained was 0.293. These results confirm that there is considerable genetic differentiation among cultivars from different domestication centers, as also shown by other studies (Miklas and Kelly, 1992; Skroch et al., 1992a,b; Haley et al., 1994; Vasconcelos et al., 1996).
The clustering obtained by UPGMA method is shown in Figure 1. The dendrogram clearly separates cul-tivars from the two domestication centers, and confirms the AMOVA results.
Within the Middle American domestication cen-ter, the greatest differentiation occurred between culti-vars of the Durango/Jalisco races and culticulti-vars of the Mesoamerica race. The only exception was for the A-114 cultivar (Durango race) which clustered with other cultivars from the Mesoamerica race. Similar results were obtained by Abreu (1997) who analyzed
morpho-agronomical traits and found that this cultivar grouped closer to cultivars from the Mesoamerica race than the Durango race. These results suggest the need for a re-evaluation of the classification of the A-114 cultivar in the Durango race.
There was no marked grouping of cultivars in the races that composed the Andean South American domes-tication center, although the smaller genetic distances in this domestication center occurred among cultivars belong-ing to same race (Perry Marrow x Jalo and Bolón Bayo x Kori Inti).
These results indicate that cultivars grouped in this race are highly related and are coherent with the findings of Sonnante et al. (1994), who used minisatellite molecu-lar markers to show that among the known races of the common bean, the highest genetic similarity was between the Nueva Granada and Peru races. These two races had a closer relationship with wild common beans from this do-mestication center than with cultivated common beans from the Chile race.
Figure 1 also shows that there are two subgroups among the cultivars of the Mesoamerica race. These sub-groups indicate a tendency for the separation of cultivars according to seed color, beige in the case of A-77, Ca-rioca, IPA-7419 and A-140, and predominantly black in the case of Jamapa, Porrilo Sintético, Compuesto Negro Chimaltenango and Milionário. This separation of culti-vars according to seed color was also observed by Beebe et al. (1995), who verified that breeding lines and culti-vars of black and red common beans constituted distinct populations when analyzed using RAPD markers. These authors concluded that gene selection for seed color has recovered a considerable part of the genome by linkage drag, which causes cultivars with the same seed color to be more related within a determined group.
The division of cultivars from the Mesoamerica race into subgroups was also observed by Singh et al. (1991), who identified two subgroups within this race based on differences in certain morphological and biochemical traits.
Figure 2 shows the projection of the genetic dis-tances among the 27 common bean cultivars in two-di-mensional space. Essentially the same tendency represented by the dendrogram is observed, i.e., a clear separation among cultivars from Middle American and Andean South American domestication centers and, within the Middle American domestication center, a certain differentiation among cultivars from the Mesoamerica race compared with cultivars from the Durango/Jalisco races. There was no tendency of cultivars to separate according to races in the Andean South American domestication center. The corre-lation between the original distances and those represented in the dispersion graph was 0.995. The stress value, a pa-rameter which determines the goodness-of-fit of the graphic projection, was 11.5%, and was considered to be good (Kruskal, 1964).
Table II - Analysis of molecular variance of 27 common bean cultivars based on RAPD markers.
Variance components Variance Total (%) P ΦST
Between
domestication centers 0.2651 75.7 < 0.0001 0.757
Within
domestication centers 0.0851 24.3
Figure 1 - Dendrogram of common bean cultivars based on RAPD data using UPGMA.
Figure 2 - Projection of the genetic distance between 27 common bean cultivars onto two-dimensional space. Identification of the cultivars is defined in Table I. 5
4
9 13 10 6 2
14 3
11 1 812
7 16
15 17 18
19
23 22
21 20
25 24 26
27
-0.10 0.00 0.10 0.20 0.30
0.00 0.20 0.40 0.60 0.80 1.00
Dimension 1
Dimension
2
Mesoamerica
Durango
Jalisco
Nueva Granada
Peru
The number of cultivars representative of the dif-ferent races in this study varied; a large proportion of the cultivars were from the Mesoamerica race and there was none from the Chile race. Nevertheless, the results show that cultivars in the Middle American domestication cen-ter tend to separate according to their proposed races, as indicated by RAPD. In the Andean South American do-mestication center, this tendency was not well defined.
The organization of the common bean germplasm into races was originally based on a large group of traits, including biochemical markers (phaseoline and isoen-zymes) (Singh et al., 1991). The strong multilocus asso-ciations observed meant that these was generally a good correlation between the classification based on morpho-logical and biochemical traits, although in some cases (< 5%), this classification was not equivalent. This discrep-ancy between biochemical data and morpho-agronomic, geographical, and ecological data was attributed to hybrid-ization and recombination, or to independent mutations in evolutionarily distinct lineages, which resulted in cultivars with identical isoenzymatic profiles.
The polymorphism of RAPD markers in this study may be related to regions of the genome that do not codify genes (Ferreira and Grattapaglia, 1995) and, when defin-ing races, greater weight was given to adaptational traits (Singh et al., 1991). These factors could explain some of the inconsistencies between RAPD analysis and the pro-posed classification by race. In addition, the low number of cultivars studied for the Andean South American do-mestication center could have compromised subdivision into races.
The inability to group the Andean South Ameri-can cultivars into races does not invalidate the current con-cept of races, particularly since the proposed classifica-tion of cultivars into races is not definitive (Singh et al., 1991). Domestication efforts have been multiple in space and time (and probably are still taking place in some Andean regions), and only relatively small samples of primitive landraces have been studied in detail at the mo-lecular level. Thus, as more populations of wild and culti-vated beans are examined using molecular approaches and through breeding programs, refinement of the current clas-sification is expected.
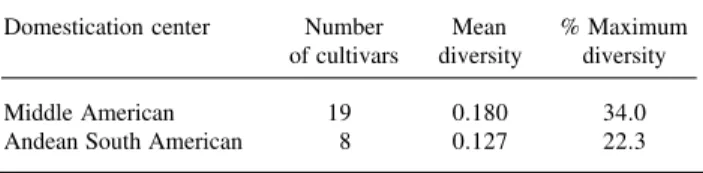
Genetic RAPD marker diversity
The basis of genetic diversity is sequence varia-tion in the base pairs of DNA. RAPD markers reveal se-quence variation by the differential amplification of DNA fragments (Nienhuis et al., 1995). The estimates of diver-sity in common bean cultivars based on RAPD marker for the two domestication centers studied are shown in Table III. A higher mean diversity (0.180) was observed for Middle American cultivars; this group also had a higher percentage of diversity (34%) in relation to the maximum diversity. These results agree with those of Vasconcelos et
al. (1996), who suggested that Middle American cultivars were more divergent than Andean South American culti-vars.
Since most of the Middle American cultivars stud-ied were from the Mesoamerica race, the mean diversity for this domestication center reflected the diversity of cul-tivars in this race. This finding suggests that there is enough diversity within Mesoamerica race to allow significant genetic gain from intraracial crosses. In Brazil, where most of the adapted cultivars belong to this race, this conclu-sion may have practical applications.
Comparison between RAPD markers and morpho-agronomical traits
Some of the cultivars in Table I were studied by Abreu (1997) in a diallel mating design in which estimates for the Mahalanobis’ distance, specific combination abil-ity, and midparent heterosis for grain yield were obtained. Comparison of these estimates with the genetic distances obtained using RAPD markers was therefore possible.
The correlation between genetic distances obtained with RAPD markers and SCA was -0.02, and for midparent heterosis the value was -0.39. These results were similar to those reported by Abreu (1997) for the correlation be-tween Mahalanobis’ generalized distance and SCA or midparent heterosis, using the same cultivars. The esti-mates of genetic divergence were, therefore, not useful in predicting the SCA and average heterosis of crosses. As pointed out by Abreu (1997), correlation is an estimate that demands variability in the two parameters involved. In the above case, the variability in SCA and heterosis was small, mainly because the F4 generation was used, in which the frequency of segregating loci is only 1/8 of that in heterozygosis in F1 generation.
Studies have shown that the measurements of ge-netic divergence obtained from morpho-agronomical traits are not useful for choosing parents when some of the cul-tivars evaluated are not adapted (Ferreira, 1993; Sarawat et al., 1994; Abreu, 1997). A similar situation occurs when the divergence is evaluated using RAPD markers which are not influenced by the environment and, therefore, ac-curately assess the genetic divergence of the population. Another possible explanation for why we did not obtain consistently positive and significant correlations between genetic distance and SCA and midparent heterosis is
be-Table III - RAPD marker diversity of common bean cultivars within domestication centers.
Domestication center Number Mean % Maximum of cultivars diversity diversity
Middle American 19 0.180 34.0
cause we do not know what linkage associations exist be-tween markers and genes that control morpho-agronomical traits. For a trait like yield, it is likely that there were many controlling genes spread throughout the genome. It is likely that many markers in this study were not linked to yield genes and there were probably many yield genes that were not linked to markers. Both cases have been shown theo-retically to reduce the association between genetic distance and hybrid performance (Charcosset et al., 1991; Bernardo, 1992).
The correlation between the genetic distances ob-tained with RAPD and the Mahalanobis’ distances was 0.89, indicating that the markers provide similar estimates of genetic divergence to those obtained using morpho-agronomical data. This elevated correlation also shows that there is a strong multilocus association between molecu-lar and morpho-agronomical traits in these cultivars. Thus, RAPD markers were efficient indicators of morphologi-cal divergence.
CONCLUSIONS
RAPD markers were efficient in separating culti-vars according to domestication center. However, only for the Middle American domestication center was there a good agreement between the grouping obtained and the proposed classification of races. An evaluation of genetic divergence using RAPD markers gave results similar to those obtained from morpho-agronomical traits. RAPD markers were not efficient in predicting the specific com-bination ability and midparent heterosis of crosses.
ACKNOWLEDGMENTS
Research supported by CAPES and FAPEMIG.
RESUMO
Avaliou-se a divergência genética de 27 cultivares de feijão (Phaseolus vulgaris L.) de diferentes raças, verificando-se ainda o grau de associação desta divergência com algumas estimativas indiretas de variabilidade obtidas em experimentos no campo. As distâncias genéticas foram obtidas pelo complemento do coeficiente de similaridade de Sorensen-Dice e a representação simplificada destas distâncias realizada a partir de um dendrograma (método UPGMA) e pela projeção no espaço bidimensional. Foi realizada uma análise de variância molecular para partição da variância entre e dentro dos centros de domesticação, e calculada a diversidade genética do marcador RAPD dentro destes centros. Também foram estimadas correlações entre as estimativas de distâncias genéticas obtidas a partir destes marcadores com estimativas de distâncias generalizadas de Mahalanobis, capacidade específica de combinação e heterose média, obtidas a partir de características moragronômicas. Verificou-se que os marcadores RAPD fo-ram eficientes na separação dos cultivares, de acordo com os centros de domesticação. Considerando as raças, no entanto, apenas para o centro de domesticação mesoamericano houve uma
boa correspondência entre o agrupamento obtido e a classificação proposta. A avaliação da divergência genética por meio destes marcadores forneceu resultados similares aos obtidos, a partir de características morfo-agronômicas, mas estes não foram eficientes na predição da capacidade específica de combinação e da heterose dos cruzamentos.
REFERENCES
Abreu, A.F.B. (1997). Predição do potencial genético de populações segregantes do feijoeiro utilizando genitores inter-raciais. Doctoral thesis, Universidade Federal de Lavras, Lavras.
Beebe, S.E., Ochoa, I., Skroch, P., Nienhuis, J. and Tivang, J. (1995). Genetic diversity among common bean breeding lines developed for Central America. Crop Sci.35: 1178-1183.
Bernardo, R. (1992). Relationship between single-cross performance and molecular marker heterozygosity. Theor. Appl. Genet. 83: 628-634.
Charcosset, A., Lefort-Buson, M. and Gallais, A. (1991). Relationship between heterosis and heterozygosity at marker loci: a theoretical computation. Theor. Appl. Genet. 81: 571-575.
Cruz, C.D. (1997). Programa Genes: Aplicativo Computacional em Genética e Estatística.Universidade Federal de Viçosa, Viçosa.
Cruz, C.D. and Viana, J.M.S. (1994). A methodology of genetic diver-gence analysis based on sample unit projection on two-dimensional space. Rev. Bras. Genet.17: 69-73.
Dice, L.R. (1945). Measures of the amount of ecologic association between species. Ecology 26: 297-302.
Excoffier, L. (1995). AMOVA 1.55 (Analysis of Molecular Variance). Uni-versity of Geneva, Geneva.
Excoffier, L., Smouse, P.E. and Quattro, J.M. (1992). Analysis of mo-lecular variance inferred from metric distances among DNA haplotypes: Application to human mitochondrial DNA restriction data.
Genetics 131: 479-491.
Falconer, D.S. (1981).Introduction to Quantitative Genetics. Longman, London.
Ferreira, D.F. (1993). Métodos de avaliação da divergência genética em milho e suas relações com os cruzamentos dialélicos. Master’s the-sis, Escola Superior de Agricultura de Lavras, Lavras.
Ferreira, M.E. and Grattapaglia, D. (1995). Introdução ao Uso de Marca-dores RAPD e RFLP em Análise Genética.EMBRAPA/CENARGEN, Brasília.
Haley, S.C., Miklas, P.N., Afanador, L. and Kelly, J.D. (1994). Random amplified polymorphic DNA (RAPD) marker variability between and within gene pools of common bean. J. Am. Soc. Hortic. Sci.119: 122-125.
Johns, M.A., Skroch, P.W., Nienhuis, J., Kinrichsen, P., Bascur, G. and
Muñoz-Schick, C. (1997). Gene pool classification of common bean landraces from Chile based on RAPD and morphological data. Crop Sci.37: 605-613.
Kruskal, J.B. (1964). Multidimensional scaling by optimizing goodness of fit to a non-metric hypothesis. Psychometrika29: 1-27.
Miklas, P. and Kelly, J. (1992). Identifying bean DNA polymorphisms us-ing the polymerase chain reaction. Bean Improv. Coop.35: 21-22.
Nei, M. (1987). Molecular Evolutionary Genetics. Columbia University Press, New York.
Nienhuis, J. and Singh, S.P. (1988). Genetic of seed yield and its compo-nents in common bean (Phaseolus vulgaris L.) of Middle-American origins. I. General combining ability. Plant Breeding 101: 143-154.
Nienhuis, J., Tivang, J., Sckroch, P. and Santos, J.B. dos (1995). Genetic relationships among cultivars and lines of lima bean (Phaseolus lunatus L.) as measured by RAPD markers. J. Am. Soc. Hort. Sci. 120: 300-306.
Rohlf, F.J. (1992). Numerical Taxonomy and Multivariate Analysis Sys-tem. Version 1.70. Exeter Software, Setauket, NY.
Sarawat, P., Stoddard, F.L. and Marshall, D.R. (1994). Genetic distance and its association with heterosis in peas. Euphytica73: 255-264.
Singh, S.P., Gepts, P. and Debouck, D.G. (1991). Races of common bean (Phaseolus vulgaris, Fabaceae). Econ. Bot. 45: 379-396.
relation-ship among Phaseolus vulgaris genotypes based on RAPD marker data. Bean Improv. Coop.35: 23-24.
Skroch, P.W., Tivang, J. and Nienhuis, J. (1992b). Analysis of genetic relationships using RAPD marker data. In: Applications of RAPD Technology to Plant Breeding. Joint Plant Breeding Symposia Series, Minneapolis, 1992. CCSA, ASHS, and AGA, Madison, pp. 26-30.
Sonnante, G., Stockton, T., Nodari, R.O., Becerra Velásquez, V.L. and
Gepts, P. (1994). Evolution of genetic diversity during the domesti-cation of common-bean (Phaseolus vulgaris L.). Theor. Appl. Genet. 89: 629-635.
Sorensen, T. (1948). A method of establishing groups of equal amplitude in plant sociology based on similarity of species content and its appli-cation to analyses of the vegetation on Danish commons. K. Dan.
Vidensk. Selsk. Biol. Skr. 5: 1-34.
Tohme, J., Gonzalez, D.O., Beebe, S. and Duque, M.C. (1996). AFLP analysis of gene pools of a wild bean core collection. Crop Sci. 36: 1375-1384.
Vasconcelos, M.J.V., Barros, E.G. de, Moreira, M.A. and Vieira, C.
(1996). Genetic diversity of the common bean Phaseolus vulgaris L. determined by DNA-based molecular markers. Braz. J. Genet. 19: 447-451.
Voysest, O., Valência, M.C. and Amezquita, M.C. (1994).Genetic diver-sity among Latin American Andean and Mesoamerican common bean cultivars. Crop Sci. 34: 1100-1110.