ABSTRACT: Over the past few years, the use of probiotics, which are capable of exerting ben-eficial effects on the composition of intestinal microbiota, has increased. Cheeses have been suggested as a better carrier of probiotic bacteria than other fermented milk products. The ef-fect of added cultures of probiotic lactic acid bacteria on the quality of a Brazilian goat semi-hard cheese (coalho) was assessed during 21 days of storage at 10 ºC as follows: C1, Lactococcus lactis subsp. lactis and L. lactis subsp. Cremoris (standard cheese); C2, Lactobacillus acidophi-lus (LA-5); C3, Lactobacillus paracasei (Lactobacillus casei-01); C4, BBifidobacterium lactis (BB-12); and C5, L. acidophilus, L. paracasei and B. lactis. Differences in some physico-chemical, ex-perimental texture and proteolysis parameters were found among the assessed cheeses. All of them presented high luminosity (L*) with predominance of the yellow component (b*). Numbers of lactic acid bacteria in the cheeses were greater than 107 cfu g–1 during storage. Cheeses with
the added probiotic strains alone and in co-culture were better accepted than cheeses without the probiotic strains. It is suggested that goat “coalho” cheese could be a potential carrier of probiotic lactic acid bacteria.
Keywords: dairy product, probiotic microorganisms, quality evaluation
Introduction
In recent years, consumers have become more in-terested in the general quality of foods. Most consumers are concerned not only about safety and nutritional value but also about health benefits (Saarela et al., 2002). The Food and Agriculture Organization defines food-related probiotics as living organisms that, upon ingestion in certain numbers, exert health benefits to the consumer’s health beyond inherent basic nutrition (FAO, 2001).
Probiotics are efficacious in treatment of gastro-intestinal disorders, respiratory infections and allergic symptoms (Wohlgemuth et al., 2010) and also reduce blood cholesterol and improve immunity (Shah, 2007). The minimal population of the probiotic bacteria to en-sure a favorable impact on health is 107 cfu g–1 or mL–1 of food at the time of consumption (De Vuyst, 2000). Fur-thermore, a probiotic strain must be amenable to food-grade production on an industrial scale, remain under good viability and functionality during storage and food consumption (Mätö et al., 2006), resist the bile salts and acidic conditions of the upper gastrointestinal tract (Cruz et al., 2009), adhere to the intestinal epithelium of hosts and possess antagonistic activity against bacterial patho-gens (Lin et al., 2006).
Strains belonging to the genera Lactobacillus [L. acidophilus (LA-5), L. paracasei (L. casei-01)] and Bifido-bacterium [B. lactis (BB 12), B. longum (1941)] have been evaluated for probiotic properties with satisfactory re-sults (Buriti et al., 2005a; Buriti et al., 2005b; Buriti et al., 2007b; Ong and Shah, 2009; Phillips et al., 2006; Souza and Saad, 2009). These bacterial strains are nor-mal constituents of the intestinal flora and present a long history of safe application in foods.
Considering the survival and viability of probiotic cultures, fermented dairy products, such as cheeses, yo-gurts and fermented milks, are promising food delivery systems for these cultures. Cheese has been suggested as a better carrier of probiotic bacteria than other fermented milk products due to its pH, higher content of fat and solid consistency, which offer greater protection to these micro-organisms in the gastrointestinal tract (Ong et al., 2006).
“Coalho” cheese is a Brazilian product that has been produced for over 150 years in various states of the northeast region of Brazil. Coalho cheese is a semi-hard cheese with medium-to-high moisture produced from raw or pasteurized cow or goat milk. It is obtained after milk coagulation using rennet or proper coagulat-ing enzymes, which are sometimes complemented with selected lactic acid bacteria. Coalho cheese is commonly marketed after seven days of storage at 10 °C (Brasil, 1997). This product has a high commercial value be-cause its production technology is simple, the yield is high and consumers readily purchase it.
Probiotic bacteria, such as lactobacilli, bifidobac-teria and enterococci, have been successfully incorpo-rated into different cheese varieties, such as cheddar (McBrearty et al., 2001), Gouda (Gomes et al., 1998), Crescenza (Gobbetti et al., 1998), cream cheese (Buriti et al., 2007a) and Minas fresh cheese (Buriti et al., 2005b; Vinderola et al., 2000). The addition of selected lactic acid bacteria in simple and mixed cultures in cheeses can improve bacterial viability and increase the acidifi-cation, flavor development and sensory characteristics of the cheese during storage (Buriti et al., 2005a; Buriti et al., 2005b; Buriti et al., 2007c).
Currently, there is a lack of studies emphasiz-ing the incorporation of probiotic cultures into coalho
Received November 01, 2011
Accepted March 08, 2012
1Universidade Federal da Paraíba/Centro de Ciências
da Saúde – Depto. de Nutrição – Lab. de Bromatologia.
2Universidade Federal da Paraíba/Centro de Ciências da Saúde
– Depto. de Nutrição – Lab. de Microbiologia de Alimentos, Campus I, Cidade Universitária – 58051-900 – João Pessoa, PB – Brasil.
*Corresponding author <[email protected]>
Edited by: Daniel Scherer de Moura
Technological, physicochemical and sensory characteristics of a Brazilian semi-hard
goat cheese and the influence of probiotics on the qual-ity parameters of the cheese during storage. Regarding these aspects, this study was performed with the main purpose of assessing the technological, physicochemical and sensory characteristics of coalho goat cheese supple-mented with Lactobacillus acidophilus (LA-5), Lactobacil-lus paracasei (L. casei-01) and Bifidobacterium lactis (BB 12) in single and mixed culture during cold storage. A secondary aim was to assess the viability of the added probiotic strains in the cheeses during the evaluated storage periods.
Materials and Methods
Cultures – The following freeze-dried commercial cul-tures used in the production of the cheeses were ob-tained in Valinhos, state of São Paulo , Brazil (22º58”14’ S; 46º59”45’ W): Lactococcus lactis subsp. Lactis and Lactococcus lactis subsp. cremoris (R704, batch 2937721) (non-probiotic cultures used as starter cultures in the standard method for the manufacture of coalho cheese); Lactobacillus acidophilus (LA-5, batch 2914230); Lactoba-cillus paracasei (L. casei-01, batch 2910976); and Bifido-bacterium lactis (BB 12, batch 2280202). Five bacterial cultures (10 mg L–1 of milk) were added during the pro-duction of the cheeses as follows: C1, L. lactis subsp. lactis and L. lactis subsp. cremoris; C2, L. acidophilus; C3, L. paracasei; C4, B. lactis; and C5, L. acidophilus, L. para-casei and B. lactis (1:1:1 ratio).
Manufacturing process of coalho goat cheeses – Coalho cheeses were manufactured in 10-L vats from commercial-ly pasteurized (65 °C per 15 min) goat milk heated to 45 ± 1 ºC and followed by direct acidification with lactic acid (0.85 mL 100 mL–1) in an amount of 0.25 mL L–1. The cul-tures of lactic acid bacteria were added at a concentration of 10 mg L–1 for direct vat inoculation. Calcium chloride (0.5 mL L–1) and a commercial coagulating agent (0.9 mL L–1) were also added to the vats. The vats were incubated at 36 °C until a firm curd was formed (approximately 40 min). The obtained gel was gently cut into cubes (1.5 to 2.0 cm), allowed to drain, placed in perforated rectan-gular containers (approximate capacity of 250 g), salted in brine (12 g L–1 NaCl), maintained at 36 °C under pres-sure for 4 h and vacuum packaged. The cheese obtained after storage at 10 °C for 24 h was regarded as the fi-nal product. Each cheese was manufactured three times (replicates), and all analyses were performed in triplicate. The results of the analysis are presented as averages of the data collected for each replicate. For each replication, the cheeses were manufactured from the same milk batch.
Analysis – Cheeses from each treatment were used for physicochemical and technological analyses. The cheeses were analyzed both immediately (day 1) and after 7, 14 and 21 days of storage at 10 ºC. Each day, three cheeses from the same batch and trial were unpacked. The sam-ples (25 g) were collected aseptically from parts of the
cheeses for microbiological analysis. For the instrumen-tal texture profile analysis, at least 0.5 cm of the rind of the cheeses was discarded, and the cheese samples were collected from the center to the outer part. The rest of the cheese was grated and immediately used for physico-chemical, microbiological and sensory analyses.
Yield and syneresis – The yield of each batch is ex-pressed as the fresh weight of the cheese obtained from each liter of milk used for its production (g of cheese L–1 of milk). The syneresis (expulsion of whey from co-agulum) was calculated as the weight of whey in grams released from each kilogram of cheese in the package after the various storage times, divided by the weight of cheese of the same package in grams and multiplied by 100 (Buriti et al., 2005b).
Gross composition and physicochemical analysis – Titratable acidity was determined according to the appropriate standard method (AOAC, 2005) and ex-pressed in terms of acidity in lactic acid (g 100 g–1). Water activity (Aw) was determined at 25 ºC. Moisture and dry matter contents were determined by drying 5 g of the samples at 105 °C until constant weight. The ash content was determined gravimetrically by heating the samples (3 g) at 550 ºC until complete combustion. The protein content was estimated by measuring the N con-tent by the Kjeldahl method and multiplying the value by a conversion factor (6.38) after drying the cheese samples (1 g). The fat content was determined by Ger-ber’s method, and sodium chloride (NaCl) content was analyzed using the Mohr method. The analysis of lac-tose was performed by the Fehling reducing method. All analyses were performed in triplicate according to the standard methods suggested by AOAC (2005).
Analysis of instrumental texture profile – The tex-tural properties of the cheeses were evaluated using a two-bite compression of cylindrical samples (diameter of 5.0 cm and height of 2.0 cm) with a probe of 25.4 mm. The employed compression ratio was 50 % deformation from the initial height of the sample at a rate of 1 mm s–1. The compression distance was 10 mm, the contact force was 5.0 g, and the time between cycles was 5 s. After being cut, the cheese samples were stored in boxes containing ice prior to testing. The measured param-eters consisted of hardness, springiness, adhesiveness, cohesiveness, chewiness and gumminess, which were obtained with the Texture Expert for Windows software version 1.20 (Stable Micro Systems).
Color evaluation – A CR-300 colorimeter was used for the instrumental color evaluation. The CIELab color scale (L*a*b*) was used with a D65 illuminant (standard day-light) at a 10° angle. The L*, a* and b* parameters were determined according to the standards set by the Interna-tional Commission on Illumination (CIE, 1986). Using ref-erence plates, the apparatus was calibrated in the reflec-tance mode with specular reflection excluded. A 10-mm quartz cuvette was used for the readings. Measurements were performed in triplicate using the inner section of the cheeses immediately after unpacking.
Counts of lactic acid bacteria – Initially, a sample (25 g) of each cheese was blended with 225 mL of peptone water (1 g per L) in a Bag Mixer and submitted to serial dilutions (101 – 10–5) with the same diluent. A sample (1 mL) of each dilution was plated onto DeMan-Rogosa-Sharpe agar using the pour plate method and incubated for three days at 37 °C in an anaerobic atmosphere (An-aerobic System Anaerogen, Oxoid). The counts were ex-pressed in colony forming units per gram of cheese (log cfu g–1) (FDA, 1992).
Sensory evaluation – Sensory evaluation was per-formed by three methods: the acceptance test, purchase intention and preference ranking test. These tests were performed using 50 non-trained panelists pre-selected according to interest with a habit of consuming coalho
cheese. All sensory evaluation assays were performed with the same panelists who worked in individual booths with controlled temperature and lighting conditions. Each panelist was served 20 g of each cheese on a small white plate coded with a random three-digit number, and the samples of the five types of cheese were served simultaneously using a blind method in a randomized sequence (assuring that each panelist was served with a specific order of samples) immediately after being taken out of the refrigerated storage. The panelists were asked to use low-salt crackers and water to cleanse their pal-ates between the samples. The acceptability of appear-ance, color, flavor, taste, texture and general percep-tion were evaluated on a 9-point unstructured hedonic scale ranging from 1 (dislike very much) to 9 (like very much). Purchase intention was evaluated using a 5-point unstructured hedonic scale ranging from 1 (certainly would not purchase) to 5 (certainly would purchase). For the preference ranking test, the panelists were asked to choose the most and least preferred sample based on their overall impressions.
Statistical analysis – The means of the results were evaluated using analysis of variance (ANOVA), and the Tukey test was used to compare differences (p < 0.05) among the technological, physicochemical, microbiolog-ical and sensory evaluations. Statistmicrobiolog-ical Analysis System (SAS, 1999) was used for the statistical analyses.
Results and Discussion
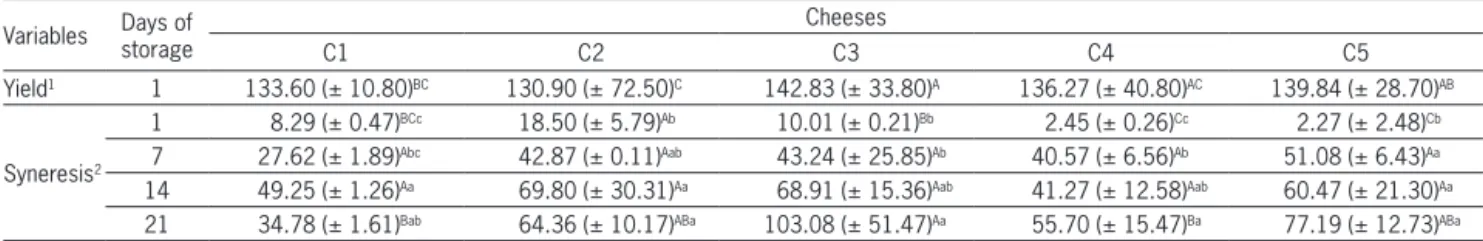
The yields and synereses for the coalho goat chees-es with added probiotic lactic acid bacteria during stor-age at 10 °C (Table 1) ranged from 130.90 to 142.83 g L–1. Higher yields (p < 0.05) were found for cheese C3 (L. paracasei) compared with cheeses C1 and C2.
The higher yield of C3 could be related to its low-er acidity aftlow-er one day of storage (Table 2). A similar result was observed with fresh white cheese supple-mented with L. paracasei (Buriti et al., 2005b). Gen-erally, cheeses produced through the direct addition of lactic acid to the milk (as in our study) resulted in higher yields and improved textures, and the products
Table 1 – Mean values (standard deviation) for yields of the final product and syneresis of coalho goat cheese with probiotic lactic acid bacteria during 21 days of storage at 10 °C.
Variables Days of storage
Cheeses
C1 C2 C3 C4 C5
Yield1 1 133.60 (± 10.80)BC 130.90 (± 72.50)C 142.83 (± 33.80)A 136.27 (± 40.80)AC 139.84 (± 28.70)AB
Syneresis2
1 8.29 (± 0.47)BCc 18.50 (± 5.79)Ab 10.01 (± 0.21)Bb 2.45 (± 0.26)Cc 2.27 (± 2.48)Cb
7 27.62 (± 1.89)Abc 42.87 (± 0.11)Aab 43.24 (± 25.85)Ab 40.57 (± 6.56)Ab 51.08 (± 6.43)Aa
14 49.25 (± 1.26)Aa 69.80 (± 30.31)Aa 68.91 (± 15.36)Aab 41.27 (± 12.58)Aab 60.47 (± 21.30)Aa
21 34.78 (± 1.61)Bab 64.36 (± 10.17)ABa 103.08 (± 51.47)Aa 55.70 (± 15.47)Ba 77.19 (± 12.73)ABa
Results are averages of three replicates of cheeses manufactured at different times; the following abbreviations are used: C1, cheese treated with Lactococcus lactis subsp. Lactis and Lactococcus lactis subsp. cremoris; C2, cheese treated with Lactobacillus acidophilus; C3, cheese treated with Lactobacillus paracasei; C4, cheese treated with Bifidobacterium lactis; and C5, cheese treated with L. acidophilus, L. paracasei and B. lactis.1 g of cheese L of milk–1; 2 g of whey kg of
cheese–1; a - c For each trial, different superscript lowercase letters within a column denote differences (p < 0.05) between values obtained for different days of
storage according Tukey’s test; A - CDifferent superscript capital letters within a row denote differences (p < 0.05) between the values obtained for the different trials
are more durable due to the delayed acidification (Ong et al., 2006). However, the use of this procedure could result in cheeses with high pH and moisture levels, which are more susceptible to spoilage by contaminat-ing microorganisms (Cunha et al., 2006).
All the cheeses presented increased (p < 0.05) sy-neresis after 21 days of storage (Table 1). The increased expulsion of the whey in cheeses C1, C3 and C4 during
storage could be the cause of the decreased moisture of these cheeses after 21 days of storage (p < 0.05) (Table 2). Buriti et al. (2005b) and Souza and Saad, (2009) also found increased syneresis in bovine fresh white cheese supplemented with L. paracasei and L. acidophilus. The syneresis rate is directly related to the acidity and, there-fore, inversely related to pH (Souza and Saad, 2009). As a consequence of the progressive increase in the
hydro-Table 2 – Mean values (standard deviation) for the gross composition and physicochemical characteristics of coalho goat cheese with probiotic lactic acid bacteria during 21 days of storage at 10 °C.
Variables Days of storage
Cheeses
C1 C2 C3 C4 C5
Moisture (g 100g–1)
1 57.57 (± 0.41)Ca 56.62 (± 0.51)Ca 57.64 (± 1.10)BCa 59.18 (± 0.73)ABa 60.27 (± 0.31)Aa
7 57.09 (± 0.15)Ca 57.48 (± 0.52)Ca 58.15 (± 0.88)BCa 58.83 (± 0.73)Ba 60.41 (± 0.05)Aa
14 54.97 (± 0.12)Cb 56.72 (± 1.09)Ba 54.39 (± 0.99)Cb 59.46 (± 0.32)Aa 59.29 (± 0.30)Ab
21 54.20 (± 0.11)Cb 56.06 (± 0.89)Ba 55.23 (± 0.09)Cb 56.76 (± 0.82)Bb 59.97 (± 0.14)Aa
Dry matter (g 100 g–1)
1 42.85 (± 0.17)Ac 43.47 (± 0.37)Aa 41.29 (± 0.36)Bb 40.39 (± 0.19)Bb 40.25 (± 0.94)Bb
7 42.91 (± 0.15)Ac 42.52 (± 0.52)Aa 41.85 (± 0.88)ABb 41.18 (± 0.73)Bb 39.56 (± 0.08)Cb
14 45.50 (± 0.12)Ab 43.28 (± 1.09)Ba 45.61 (± 0.99)Aa 43.23 (± 0.11)Ba 40.71 (± 0.30)Cb
21 45.80 (± 0.11)ABa 43.94 (± 0.89)CDa 44.78 (± 0.09)BCa 43.24 (± 0.82)Da 46.86 (± 0.31)Aa
Ashes (g 100 g–1)
1 4.03 (± 0.04)Ba 4.25 (± 0.07)Aa 4.02 (± 0.11)Ba 4.37 (± 0.14)Abc 4.24 (± 0.05)Aa
7 4.13 (± 0.15)Aa 4.25 (± 0.04)Aa 4.16 (± 0.19)Aa 4.32 (± 0.03)Ac 4.23 (± 0.06)Aa
14 4.13 (± 0.09)Ba 4.25 (± 0.04)Ba 4.20 (± 0.06)Ba 4.56 (± 0.09)Aab 4.25 (± 0.06)Ba
21 4.22 (± 0.20)Ba 4.10 (± 0.10)Bb 4.09 (± 0.11)Ba 4.70 (± 0.11)Aa 4.20 (± 0.02)Ba
Total protein (g 100 g–1)
1 21.82 (± 0.10)Ac 20.01 (± 0.16)Bc 20.32 (± 0.14)Bb 19.27 (± 0.32)Cb 18.42 (± 0.03)Db
7 22.73 (± 0.16)Ab 21.66 (±0.12)ABa 19.98 (± 0.96)CDb 21.12 (± 0.43)Ba 19.44 (± 0.26)Da
14 23.32 (± 0.37)Aa 20.69 (± 0.19)Cb 21.86 (± 0.60)Ba 20.96 (± 0.54)BCa 19.37 (± 0.64)Da
21 21.59 (± 0.24)Ac 21.27 (± 0.33)Aa 20.87 (± 0.47)Aab 21.70 (± 0.74)Aa 19.10 (± 0.16)Bab
Fat matter (g 100 g–1)
1 17.00 (± 0.00)Ab 16.50 (± 0.00)Bab 17.25 (± 0.29)Ab 15.13 (± 0.25)Cc 16.13 (± 0.25)Ba
7 18.63 (± 0.48)Aa 16.00 (± 0.58)Bb 18.63 (± 1.03)Aa 17.50 (± 0.00)Aa 16.13 (± 0.48)Ba
14 18.83 (± 0.41)Aa 17.50 (± 0.41)Ba 19.13 (± 0.25)Aa 15.75 (± 0.29)Cbc 16.17 (± 0.26)Ca
21 19.00 (± 0.45)Aa 16.75 (± 0.61)Bab 19.25 (± 0.65)Aa 16.63 (± 0.75)Bab 16.38 (± 0.25)Ba
Lactose (g 100 g–1)
1 1.54 (± 0.04)Ca 1.90 (± 0.02)Ba 2.08 (± 0.02)Aa 1.54 (± 0.04)Cc 2.09 (± 0.07)Aa
7 1.07 (± 0.00)Db 1.93 (± 0.02)Bb 1.56 (± 0.05)Cab 2.04 (± 0.07)Aa 1.85 (± 0.02)Bb
14 0.99 (± 0.02)Dc 1.68 (± 0.02)BCc 1.32 (± 0.34)CDb 2.12 (± 0.02)Aa 1.76 (± 0.10)ABbc
21 0.97 (± 0.02)Cc 2.03 (± 0.04)Aa 1.16 (± 0.37)BCb 1.94 (± 0.01)Ab 1.65 (± 0.02)Ac
NaCl (g 100 g–1)
1 0.61 (± 0.04)Bb 0.62 (± 0.06)Ba 0.58 (± 0.04)Bb 0.77 (± 0.05)Aa 0.55 (± 0.00)Bb
7 0.67 (± 0.05)Aab 0.59 (± 0.04)Ba 0.70 (± 0.03)Aa 0.65 (± 0.02)ABb 0.63 (± 0.03)ABa
14 0.66 (± 0.02)ABab 0.61 (± 0.03)BCa 0.59 (± 0.05)Cb 0.69 (± 0.01)Ab 0.60 (± 0.02)Ca
21 0.69 (± 0.01)Aa 0.53 (± 0.04)Ba 0.56 (± 0.01)Bb 0.65 (± 0.05)Ab 0.64 (± 0.03)Aa
pH
1 6.52 (± 0.16)Da 7.03 (± 0.02)BCab 7.16 (± 0.00)ABa 7.26 (± 0.01)Aab 6.93 (± 0.06)Ca
7 6.31 (± 0.30)Ba 7.12 (± 0.09)Aab 7.06 (± 0.02)Aab 7.16 (± 0.08)Ab 6.98 (± 0.01)Aa
14 6.01 (± 0.09)Da 7.25 (± 0.02)Aa 6.79 (± 0.05)Cb 7.16 (± 0.04)Ab 6.91 (± 0.05)Ba
21 6.22 (± 0.41)Ca 6.88 (± 0.25)ABb 6.35 (± 0.25)Cc 7.38 (± 0.11)Aa 6.53 (± 0.16)BCb
Titratable acidity (g 100 g–1)
1 0.53 (± 0.00)Bc 0.71 (± 0.00)Aa 0.18 (± 0.00)Dd 0.53 (± 0.00)Ba 0.36 (± 0.00)Cb
7 1.06 (± 0.00)Ab 0.53 (± 0.00)Cb 0.71 (± 0.00)Bc 0.44 (± 0.10)CDa 0.36 (± 0.00)Db
14 1.06 (± 0.00)Ab 0.53 (± 0.00)Bb 1.06 (± 0.00)Ab 0.35 (± 0.00)Ca 0.53 (± 0.00)Ba
21 1.23 (± 0.00)Ba 0.35 (± 0.00)Dc 1.24 (± 0.00)Aa 0.35 (± 0.00)Da 0.53 (± 0.00)Ca
Aw
1 0.971 (± 0.00)Aa 0.967 (± 0.00)Bab 0.970 (± 0.00)Ab 0.966 (± 0.00)Bb 0.962 (± 0.00)Cc
7 0.966 (± 0.00)Cb 0.969 (± 0.00)Ba 0.972 (± 0.00)Aab 0.963 (± 0.00)Db 0.971 (± 0.00)ABb
14 0.967 (± 0.00)Cb 0.966 (± 0.00)CDb 0.963 (± 0.00)Dc 0.973 (± 0.00)Ba 0.978 (± 0.00)Aa
21 0.966 (± 0.00)Bb 0.962 (± 0.00)Bc 0.978 (± 0.01)Aa 0.975 (± 0.01)Aa 0.976 (± 0.00)Aa
Results are averages of three replicates of cheeses manufactured at different times; the following abbreviations are used: C1, cheese treated with Lactococcus lactis subsp. Lactis and Lactococcus lactis subsp. cremoris; C2, cheese treated with Lactobacillus acidophilus; C3, cheese treated with Lactobacillus paracasei; C4, cheese treated with Bifidobacterium lactis; and C5, cheese treated with L. acidophilus, L. paracasei and B. lactis.a - c For each trial, different superscript lowercase
letters within a column denote differences (p < 0.05) between values obtained for different days of storage according to Tukey’s test; A - C Different superscript capital
gen ion concentration during acidification, the repulsive forces decrease and casein micelles begin to aggregate, followed by whey expulsion and establishment of the increased syneresis. However, in our study, this relation was found only for cheeses C3 and C5. Cheese C3 pre-sented the highest acidity in lactic acid (1.24 g 100 g–1) after 21 days of storage (Table 2), explaining the loss of whey (103.08 g kg–1) during the same storage period.
Differences in gross composition and physico-chemical characteristics of coalho goat cheese supple-mented with lactic acid bacteria during 21 days of cold storage were observed among the types of bacteria and throughout the time of storage (p < 0.05) (Table 2). The moisture content of cheeses C1, C3 and C4 decreased during storage time, concomitant with an increase in dry matter, both of which could be related to an increase in the percentage of protein.
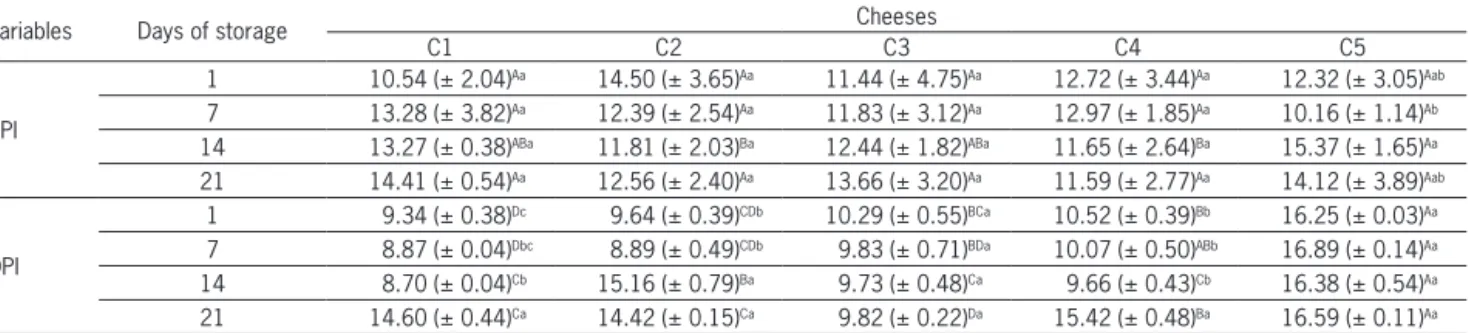
Lower values for lactose were observed in cheeses C1 (1.55 and 1.09 g 100 g–1 at 1 and 21 days, respec-tively), C3 (2.08 and 1.16 g 100 g–1, respectively) and C5 (2.09 and 1.65 g 100 g–1, respectively), suggesting a higher consumption of lactose by the starter culture and probiotic strains during storage, which may have been accompanied by greater lactic acid production (Table 2). Proteolysis is one of the major biochemical events for the development of proper flavor in cheeses during storage, mainly due to the production of peptides and free amino acids (Sousa et al., 2001).The mean values for the proteolysis parameters of coalho goat cheeses supplemented with different lactic acid bacteria during 21 days of cold storage are listed in Table 3. Storage time exhibited no influence (p > 0.05) on the extent of the proteolysis index - EPI (primary proteolysis), with the exception of cheese C5, in which EPI decreased (p < 0.05) after seven days of storage. This finding could be related to the processing of the cheeses, where the type and the amount of commercial coagulating agent was the same for all the produced cheeses, and there-fore, different proteolytic enzymes did not act on the casein in the cheeses, producing different high-molecu-lar-weight peptides.
Our findings are consistent with Gardiner et al. (1998) who did not observe differences in the proteolysis parameters between cheddar cheeses with and without L. paracasei during refrigerated storage. Similar results were also noted in semi-hard cheeses supplemented with L. acidophilus and L. paracasei (Bergamini et al., 2006). This same feature for primary proteolysis was also found in previous studies of cheddar cheese sup-plemented with Bifidobacterium bifidum and L. paracasei (Dinakar and Mistry, 1994; Gardiner et al., 1998), Gouda cheeses with Bifidobacterium spp. and L. acidophilus (Gomes et al., 1995) and goat cheeses with B. lactis and L. acidophilus (Gomes and Malcata, 1998).
Higher average values for the depth of the prote-olysis index - DPI (secondary proteprote-olysis) were found in cheese C5 (L. acidophilus, L. paracasei and B. lactis) at all storage times, suggesting that the combined use of the assayed bacteria could enhance the proteolysis of chees-es and provide an increased release of peptidchees-es (medium and small) and free amino acids. Only in the C1, C2 and C4 cheeses did increased secondary proteolysis occur over the assessed storage periods. The increased levels of secondary proteolysis in cheeses with L. acidophilus (LA-5) and B. lactis (BB-12) suggest that these strains present a more active peptidolytic system than the assayed strain of L. paracasei (L. casei-05). Similar results were also ob-served by Bergamini et al. (2009) who reported that L. paracasei exerted no influence on secondary proteolysis in semi-hard cheese after 60 days of storage. Enzymes are more likely to influence proteolysis in cheeses than the type of lactic acid bacteria used during processing (Buriti et al., 2005a; Gomes and Malcata, 1998). In fact, changes in proteolysis are mainly catalyzed by residual chymosin and, to a lesser extent, by other proteases pres-ent in the curd, such as plasmin, or proteases from the cell envelopes of the starter culture (Sousa et al., 2001); this was not observed in the present study.
All the evaluated cheeses, when submitted to proper temperatures, did not melt but reduced in diam-eter. Cheeses tend to melt and deform when exposed to heat at pH values below 5.7 (Sousa et al., 2001). The
Table 3 – Mean values (standard deviation) for proteolysis parameters of coalho goat cheese with probiotic lactic acid bacteria during 21 days of storage at 10 °C.
Variables Days of storage Cheeses
C1 C2 C3 C4 C5
EPI
1 10.54 (± 2.04)Aa 14.50 (± 3.65)Aa 11.44 (± 4.75)Aa 12.72 (± 3.44)Aa 12.32 (± 3.05)Aab
7 13.28 (± 3.82)Aa 12.39 (± 2.54)Aa 11.83 (± 3.12)Aa 12.97 (± 1.85)Aa 10.16 (± 1.14)Ab
14 13.27 (± 0.38)ABa 11.81 (± 2.03)Ba 12.44 (± 1.82)ABa 11.65 (± 2.64)Ba 15.37 (± 1.65)Aa
21 14.41 (± 0.54)Aa 12.56 (± 2.40)Aa 13.66 (± 3.20)Aa 11.59 (± 2.77)Aa 14.12 (± 3.89)Aab
DPI
1 9.34 (± 0.38)Dc 9.64 (± 0.39)CDb 10.29 (± 0.55)BCa 10.52 (± 0.39)Bb 16.25 (± 0.03)Aa
7 8.87 (± 0.04)Dbc 8.89 (± 0.49)CDb 9.83 (± 0.71)BDa 10.07 (± 0.50)ABb 16.89 (± 0.14)Aa
14 8.70 (± 0.04)Cb 15.16 (± 0.79)Ba 9.73 (± 0.48)Ca 9.66 (± 0.43)Cb 16.38 (± 0.54)Aa
21 14.60 (± 0.44)Ca 14.42 (± 0.15)Ca 9.82 (± 0.22)Da 15.42 (± 0.48)Ba 16.59 (± 0.11)Aa
Results are averages of three replicates of cheeses manufactured at different times; the following abbreviations are used: EPI, extent proteolysis index; DPI, depth of proteolysis index; C1, cheese treated with Lactococcus lactis subsp. lactis and Lactococcus lactis subsp. cremoris; C2, cheese treated with Lactobacillus acidophilus; C3, cheese treated with Lactobacillus paracasei; C4, cheese treated with Bifidobacterium lactis; and C5, cheese treated with L. acidophilus, L. paracasei and B. lactis.a - c For each
trial, different superscript lowercase letters within a column denote differences (p < 0.05) between values obtained for different days of storage according to Tukey’s test; A - C
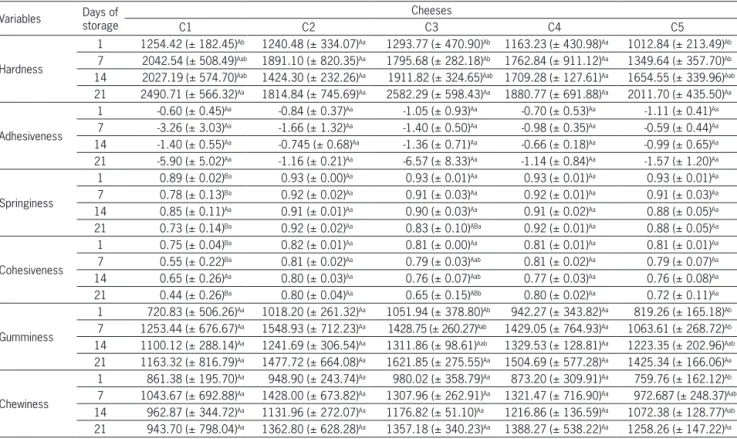
pH values (ranging from 6.22 to 7.26) measured in the cheeses may justify the decreased diameter observed in all the tested samples (Table 2). The mean values for the textural parameters of the coalho goat cheeses supple-mented with different lactic acid bacteria during 21 days of storage at 10 °C are shown in Table 4. After 21 days of storage, an increase (p < 0.05) in hardness was observed for cheeses C1, C3 and C5. Cheese C1 presented the low-est values (p < 0.05) for springiness and cohesiveness at 1, 7 and 21 days of storage. The gumminess increased in cheeses C3 and C5 during storage, while chewiness increased during storage only in cheese C5.
The increase in syneresis and decrease in mois-ture content during storage may have been related to the increase in the hardness of the cheeses (Bhaskara-charya and Shah, 2001). Buriti et al. (2005a) and Souza and Saad (2009) reported that Minas frescal cheese with L. acidophilus became harder during storage. The rate and level of acidification have a major impact on cheese texture due to demineralization of the casein micelles (Buriti et al., 2005a). In the present study, cheeses C1, C3 and C5 presented greater acidification during storage, which could have contributed to the increased hardness. Among the texture parameters analyzed in the present study, hardness was the most important, as cheeses with
brittle texture are normally rejected by consumers (Sou-za and Saad, 2009).
The L* value decreased (p < 0.05) in the all as-sessed cheeses during storage (Table 5). Cheeses C2, C3 and C4 showed an increase in the a* value during storage, and most of the cheeses also presented an increase in the b* value during storage. The L* parameter indicates light-ness and the capacity of the object to reflect or transmit light based on a scale ranging from 0 to 100. Therefore, higher lightness values result in clearer objects. The as-sessed samples had high luminosity (L*) with a predomi-nance of the yellow component (b*) rather than the green component (a*), suggesting that the white yellowness contributed the most to the color characteristics of the cheeses. Rohm and Jaros (1996) evaluated changes in the color of Emmental cheese during storage and noted a de-crease in L* and inde-creases in a* and b*.
No differences (p > 0.05) were found for the bac-terial counts between the types of cheese over the period of storage (Figure 1). The lactic acid bacteria counts in cheeses C2, C3, C4 and C5 were always higher than 6.5 log cfu g–1 after 1 day of storage, while after 21 days, these values were higher than 7 log cfu g–1 of cheese. Buriti et al. (2007c) noted decreases in the counts of lactic acid bacteria in Minas frescal cheese with a mixed culture of
Table 4 – Mean values (standard deviation) for textural parameters of coalho goat cheese with probiotic lactic acid bacteria during 21 days of storage at 10 °C.
Variables Days of storage
Cheeses
C1 C2 C3 C4 C5
Hardness
1 1254.42 (± 182.45)Ab 1240.48 (± 334.07)Aa 1293.77 (± 470.90)Ab 1163.23 (± 430.98)Aa 1012.84 (± 213.49)Ab
7 2042.54 (± 508.49)Aab 1891.10 (± 820.35)Aa 1795.68 (± 282.18)Ab 1762.84 (± 911.12)Aa 1349.64 (± 357.70)Ab
14 2027.19 (± 574.70)Aab 1424.30 (± 232.26)Aa 1911.82 (± 324.65)Aab 1709.28 (± 127.61)Aa 1654.55 (± 339.96)Aab
21 2490.71 (± 566.32)Aa 1814.84 (± 745.69)Aa 2582.29 (± 598.43)Aa 1880.77 (± 691.88)Aa 2011.70 (± 435.50)Aa
Adhesiveness
1 -0.60 (± 0.45)Aa -0.84 (± 0.37)Aa -1.05 (± 0.93)Aa -0.70 (± 0.53)Aa -1.11 (± 0.41)Aa
7 -3.26 (± 3.03)Aa -1.66 (± 1.32)Aa -1.40 (± 0.50)Aa -0.98 (± 0.35)Aa -0.59 (± 0.44)Aa
14 -1.40 (± 0.55)Aa -0.745 (± 0.68)Aa -1.36 (± 0.71)Aa -0.66 (± 0.18)Aa -0.99 (± 0.65)Aa
21 -5.90 (± 5.02)Aa -1.16 (± 0.21)Aa -6.57 (± 8.33)Aa -1.14 (± 0.84)Aa -1.57 (± 1.20)Aa
Springiness
1 0.89 (± 0.02)Ba 0.93 (± 0.00)Aa 0.93 (± 0.01)Aa 0.93 (± 0.01)Aa 0.93 (± 0.01)Aa
7 0.78 (± 0.13)Ba 0.92 (± 0.02)Aa 0.91 (± 0.03)Aa 0.92 (± 0.01)Aa 0.91 (± 0.03)Aa
14 0.85 (± 0.11)Aa 0.91 (± 0.01)Aa 0.90 (± 0.03)Aa 0.91 (± 0.02)Aa 0.88 (± 0.05)Aa
21 0.73 (± 0.14)Ba 0.92 (± 0.02)Aa 0.83 (± 0.10)ABa 0.92 (± 0.01)Aa 0.88 (± 0.05)Aa
Cohesiveness
1 0.75 (± 0.04)Ba 0.82 (± 0.01)Aa 0.81 (± 0.00)Aa 0.81 (± 0.01)Aa 0.81 (± 0.01)Aa
7 0.55 (± 0.22)Ba 0.81 (± 0.02)Aa 0.79 (± 0.03)Aab 0.81 (± 0.02)Aa 0.79 (± 0.07)Aa
14 0.65 (± 0.26)Aa 0.80 (± 0.03)Aa 0.76 (± 0.07)Aab 0.77 (± 0.03)Aa 0.76 (± 0.08)Aa
21 0.44 (± 0.26)Ba 0.80 (± 0.04)Aa 0.65 (± 0.15)ABb 0.80 (± 0.02)Aa 0.72 (± 0.11)Aa
Gumminess
1 720.83 (± 506.26)Aa 1018.20 (± 261.32)Aa 1051.94 (± 378.80)Ab 942.27 (± 343.82)Aa 819.26 (± 165.18)Ab
7 1253.44 (± 676.67)Aa 1548.93 (± 712.23)Aa 1428.75 (± 260.27)Aab 1429.05 (± 764.93)Aa 1063.61 (± 268.72)Ab
14 1100.12 (± 288.14)Aa 1241.69 (± 306.54)Aa 1311.86 (± 98.61)Aab 1329.53 (± 128.81)Aa 1223.35 (± 202.96)Aab
21 1163.32 (± 816.79)Aa 1477.72 (± 664.08)Aa 1621.85 (± 275.55)Aa 1504.69 (± 577.28)Aa 1425.34 (± 166.06)Aa
Chewiness
1 861.38 (± 195.70)Aa 948.90 (± 243.74)Aa 980.02 (± 358.79)Aa 873.20 (± 309.91)Aa 759.76 (± 162.12)Ab
7 1043.67 (± 692.88)Aa 1428.00 (± 673.82)Aa 1307.96 (± 262.91)Aa 1321.47 (± 716.90)Aa 972.687 (± 248.37)Aab
14 962.87 (± 344.72)Aa 1131.96 (± 272.07)Aa 1176.82 (± 51.10)Aa 1216.86 (± 136.59)Aa 1072.38 (± 128.77)Aab
21 943.70 (± 798.04)Aa 1362.80 (± 628.28)Aa 1357.18 (± 340.23)Aa 1388.27 (± 538.22)Aa 1258.26 (± 147.22)Aa
Results are averages of three replicates of cheeses manufactured at different times; the following abbreviations are used: C1, cheese treated with Lactococcus lactis subsp. lactis and Lactococcus lactis subsp. cremoris; C2, cheese treated with Lactobacillus acidophilus; C3, cheese treated with Lactobacillus paracasei; C4, cheese treated with Bifidobacterium lactis; and C5, cheese treated with L. acidophilus, L. paracasei and B. lactis. a - b For each trial, different superscript lowercase
letters within a column denote differences (p < 0.05) between values obtained for different days of storage according to Tukey’s test;A – B Different superscript capital
L. lactis subsp. Lactis and L. lactis subsp. Cremoris after 21 days of refrigerated storage. However, other authors have reported increases in the populations of lactic acid bacteria (e.g., L. paracasei and L. acidophilus) in Minas frescal cheese during storage (Buriti et al., 2005b; Souza and Saad 2009). Similarly, Ryhänen et al. (2001) found counts of L. acidophilus over 6.0 log cfu g–1 in Festivo cheese during 16 weeks of storage. Yilmaztekin et al. (2004) reported counts of L. acidophilus La-5 in white-brined cheese approximately 6.0 log cfu g–1 after 90 days of storage. Vinderola et al. (2000) tested the addition of L. acidophilus in mixed culture with different
bifidobac-teria (Bifidobacterium sp., B. bifidum, and B. longum) to Argentinian fresco cheese and observed counts of L. aci-dophilus above 6.0 log cfu g–1 after 60 days of storage.
In this study, all cheeses presented counts of lac-tic acid bacteria higher than 107 cfu g–1 (7.0 log cfu g–1) after seven days of cold storage, which is considered the minimum count of probiotic bacteria required at the mo-ment of intake to assure a favorable impact on consumer health (De Vuyst, 2000; Talwalkar et al., 2004). Some characteristics of low-ripened white cheeses, such as the coalho cheese, suggest that these matrices are suitable carriers of probiotic lactic acid bacteria: i) temperatures exceeding 45 °C applied in the processing inhibit the survival of contaminating bacteria, and the matrices pro-vide an appropriate physical structure for the protection of the probiotic cultures during the storage; ii) they con-tain high amounts of the proteins, lipids, vitamins and minerals needed for the survival and multiplication of probiotic cultures; and iii) they are slightly acidic, which enables the growth of lactic acid bacteria and inhibits microorganisms that commonly cause spoilage and food-borne diseases (Buriti et al., 2005a; Buriti et al., 2005b).
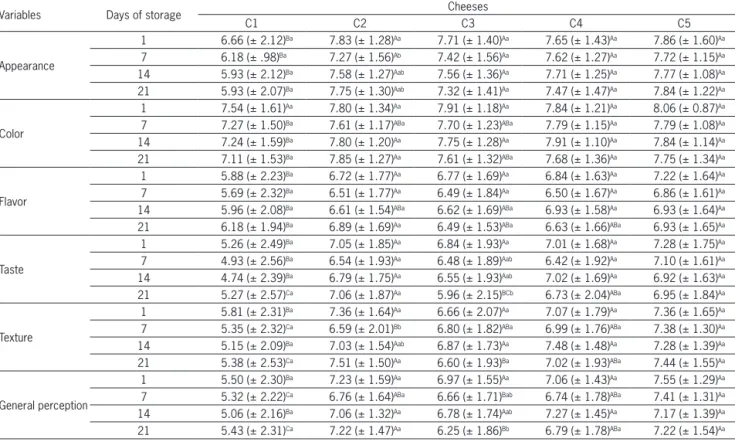
The lowest (p < 0.05) values for appearance, flavor, taste, texture and general perception were found for cheese C1 (standard) at all evaluated storage periods (Table 6). No differences (p > 0.05) in appearance, color or flavor were found between cheeses C2, C3, C4 and C5 in the evaluated storage period. Cheese C5 had higher values (p < 0.05) than C3 for general perception after 21 days of storage. A decrease (p < 0.05) in the scores for general perception for C3 was observed over the storage time.
When asked to report about the intent to pur-chase, the panelists reported differences between cheese C1 and the other cheeses at all storage periods. The re-sponses fell between “possibly would not purchase” and “maybe would purchase/maybe would not purchase”.
Table 5 – Mean values (standard deviation) for the color evaluation parameters for coalho goat cheese with probiotic lactic acid bacteria during 21 days of storage at 10 °C.
Color Days of storage Cheeses
C1 C2 C3 C4 C5
L
1 93.50 (± 0.30)Aa 92.63 (± 0.30)Ba 93.38 (± 0.16)Aa 92.67 (± 0.15)Ba 92.50 (± 0.25)Ba
7 92.81 (± 0.13)ABb 92.23 (± 0.15)Ca 93.30 (± 0.33)Aab 92.70 (± 0.30)BCa 92.51 (± 0.21)BCa
14 92.51 (± 0.27)ABb 92.52 (± 0.19)ABa 92.84 (± 0.21)Abc 92.60 (± 0.18)ABa 92.42 (± 0.33)Ba
21 91.36 (± 0.23)Bc 91.48 (± 0.21)Bb 92.73 (±0.35)Ac 91.71 (± 0.80)Bb 91.69 (± 0.20)Bb
a
1 -3.18 (± 0.08)Ba -3.09 (± 0.00)ABb -3.04 (± 0.05)Abc -3.14 (± 0.04)ABc -3.08 (± 0.02)ABa
7 -3.12 (± 0.17)ABa -3.17 (± 0.28)Bb -3.09 (± 0.21)ABc -2.78 (± 0.04)Ab -3.09 (± 0.12)ABa
14 -2.88 (± 0.21)Ba -2.86 (± 0.08)ABab -2.81 (± 0.06)ABb -2.65 (± 0.03)Aa -3.04 (± 0.02)Ba
21 -2.88 (± 0.23)Ba -2.68 (± 0.14)Ba -2.34 (± 0.17)Aa -2.74 (± 0.06)Bb -3.18 (± 0.14)Ba
b
1 9.17 (± 0.82)Ac 8.87 (± 0.02)Ac 9.37 (± 0.05)Aa 9.03 (± 0.04)Ac 9.49 (± 0.16)Ac
7 9.46 (± 0.37)Ac 9.60 (± 0.11)Abc 9.61 (± 0.50)Aa 9.20 (± 0.05)Abc 9.70 (± 0.40)Abc
14 10.31 (± 0.24)Ab 10.32 (± 0.71)Aab 9.70 (± 0.33)ABa 9.58 (± 0.20)Bb 10.33 (± 0.07)Ab
21 11.16 (± 0.32)Aa 10.70 (± 0.47)ABa 9.76 (± 0.14)Ca 10.48 (± 0.24)Ba 11.09 (± 0.33)Aa
Results are averages of three replicates of cheeses manufactured at different times; the following abbreviations are used: C1, cheese treated with Lactococcus lactis subsp. lactis and Lactococcus lactis subsp. cremoris; C2, cheese treated with Lactobacillus acidophilus; C3, cheese treated with Lactobacillus paracasei; C4, cheese treated with Bifidobacterium lactis; and C5, cheese treated with L. acidophilus, L. paracasei and B. lactis.a - c For each trial, different superscript lowercase
letters within in column denote differences (p < 0.05) between values obtained for different days of storage according to Tukey’s test; A - C Different superscript capital
letters within a row denote differences (p < 0.05) between the values obtained for the different trials according to Tukey’s test.
The intent to purchase was similar for cheeses C3 and C5 during the evaluated storage periods, where the he-donic term was between “maybe would purchase/maybe would not purchase” and “purchase”. There was an in-crease in purchase intention for cheeses C2 and C4 dur-ing the assessed storage period, where the hedonic term was “possibly purchase”.
In the preference ranking test, cheese C5 was the most preferred, and cheese C1 was the least pre-ferred (p < 0.05) after 21 days of storage. Cheeses C2, C3 and C4 were similarly (p > 0.05) classified as being moderately desirable. Under certain conditions, L. lac-tis (which was present in the starter culture added to cheese C1) rapidly ferments available carbon sources into lactic acid and converts sugars into other organ-ic compounds, such as formate, acetate and ethanol, negatively influencing the sensory properties of un-ripened cheeses, such as the coalho cheese (Even et al., 1999). Moreover, the different profile of second-ary proteolysis (depth of proteolysis index) found in cheeses manufactured with some strains of probiotic lactic acid bacteria could cause a satisfactory impact on the sensory characteristics of these cheeses, par-ticularly in their flavor, when compared with cheeses
manufactured without the addition of these strains. Although cheese C1 had also presented increased sec-ondary proteolysis, the higher acidity developed in this cheese over the storage period could have overcome the possible positive effects of secondary proteolysis on its sensory characteristics, resulting in a decrease in the sensory acceptance of the product.
Conclusions
The addition of a standard starter culture of L. lactis subsp. lactis and L. lactis subsp. cremoris in coalho goat cheese resulted in a more acidic product. The addition of the assayed strains of probiotic lactic acid bacteria in co-culture resulted in higher prote-olysis rates and depths. Coalho goat cheese may be a good carrier for the delivery of probiotic lactic acid bacteria because the cheeses presented viable counts of the added bacteria during 21 days of cold storage at levels higher than those recommended for health benefits. Coalho goat cheeses with the added probiotic lactic acid strains alone and in co-culture were better accepted in the sensory evaluation than cheeses with-out the probiotic strains.
Table 6 – Mean (standard deviation) sensory scores1 for coalho goat cheese with probiotic lactic acid bacteria treatments after storage at 10 °C.
Variables Days of storage Cheeses
C1 C2 C3 C4 C5
Appearance
1 6.66 (± 2.12)Ba 7.83 (± 1.28)Aa 7.71 (± 1.40)Aa 7.65 (± 1.43)Aa 7.86 (± 1.60)Aa
7 6.18 (± .98)Ba 7.27 (± 1.56)Ab 7.42 (± 1.56)Aa 7.62 (± 1.27)Aa 7.72 (± 1.15)Aa
14 5.93 (± 2.12)Ba 7.58 (± 1.27)Aab 7.56 (± 1.36)Aa 7.71 (± 1.25)Aa 7.77 (± 1.08)Aa
21 5.93 (± 2.07)Ba 7.75 (± 1.30)Aab 7.32 (± 1.41)Aa 7.47 (± 1.47)Aa 7.84 (± 1.22)Aa
Color
1 7.54 (± 1.61)Aa 7.80 (± 1.34)Aa 7.91 (± 1.18)Aa 7.84 (± 1.21)Aa 8.06 (± 0.87)Aa
7 7.27 (± 1.50)Ba 7.61 (± 1.17)ABa 7.70 (± 1.23)ABa 7.79 (± 1.15)Aa 7.79 (± 1.08)Aa
14 7.24 (± 1.59)Ba 7.80 (± 1.20)Aa 7.75 (± 1.28)Aa 7.91 (± 1.10)Aa 7.84 (± 1.14)Aa
21 7.11 (± 1.53)Ba 7.85 (± 1.27)Aa 7.61 (± 1.32)ABa 7.68 (± 1.36)Aa 7.75 (± 1.34)Aa
Flavor
1 5.88 (± 2.23)Ba 6.72 (± 1.77)Aa 6.77 (± 1.69)Aa 6.84 (± 1.63)Aa 7.22 (± 1.64)Aa
7 5.69 (± 2.32)Ba 6.51 (± 1.77)Aa 6.49 (± 1.84)Aa 6.50 (± 1.67)Aa 6.86 (± 1.61)Aa
14 5.96 (± 2.08)Ba 6.61 (± 1.54)ABa 6.62 (± 1.69)ABa 6.93 (± 1.58)Aa 6.93 (± 1.64)Aa
21 6.18 (± 1.94)Ba 6.89 (± 1.69)Aa 6.49 (± 1.53)ABa 6.63 (± 1.66)ABa 6.93 (± 1.65)Aa
Taste
1 5.26 (± 2.49)Ba 7.05 (± 1.85)Aa 6.84 (± 1.93)Aa 7.01 (± 1.68)Aa 7.28 (± 1.75)Aa
7 4.93 (± 2.56)Ba 6.54 (± 1.93)Aa 6.48 (± 1.89)Aab 6.42 (± 1.92)Aa 7.10 (± 1.61)Aa
14 4.74 (± 2.39)Ba 6.79 (± 1.75)Aa 6.55 (± 1.93)Aab 7.02 (± 1.69)Aa 6.92 (± 1.63)Aa
21 5.27 (± 2.57)Ca 7.06 (± 1.87)Aa 5.96 (± 2.15)BCb 6.73 (± 2.04)ABa 6.95 (± 1.84)Aa
Texture
1 5.81 (± 2.31)Ba 7.36 (± 1.64)Aa 6.66 (± 2.07)Aa 7.07 (± 1.79)Aa 7.36 (± 1.65)Aa
7 5.35 (± 2.32)Ca 6.59 (± 2.01)Bb 6.80 (± 1.82)ABa 6.99 (± 1.76)ABa 7.38 (± 1.30)Aa
14 5.15 (± 2.09)Ba 7.03 (± 1.54)Aab 6.87 (± 1.73)Aa 7.48 (± 1.48)Aa 7.28 (± 1.39)Aa
21 5.38 (± 2.53)Ca 7.51 (± 1.50)Aa 6.60 (± 1.93)Ba 7.02 (± 1.93)ABa 7.44 (± 1.55)Aa
General perception
1 5.50 (± 2.30)Ba 7.23 (± 1.59)Aa 6.97 (± 1.55)Aa 7.06 (± 1.43)Aa 7.55 (± 1.29)Aa
7 5.32 (± 2.22)Ca 6.76 (± 1.64)ABa 6.66 (± 1.71)Bab 6.74 (± 1.78)ABa 7.41 (± 1.31)Aa
14 5.06 (± 2.16)Ba 7.06 (± 1.32)Aa 6.78 (± 1.74)Aab 7.27 (± 1.45)Aa 7.17 (± 1.39)Aa
21 5.43 (± 2.31)Ca 7.22 (± 1.47)Aa 6.25 (± 1.86)Bb 6.79 (± 1.78)ABa 7.22 (± 1.54)Aa
1Scored according to a hedonic scale ranging from 1 (dislike very much) to 9 (like very much).
Results are averages of three replicates of cheeses manufactured at different times; the following abbreviations are used: C1, cheese treated with Lactococcus lactis subsp. lactis and Lactococcus lactis subsp. cremoris; C2, cheese treated with Lactobacillus acidophilus; C3, cheese treated with Lactobacillus paracasei; C4, cheese treated with Bifidobacterium lactis; and C5, cheese treated with L. acidophilus, L. paracasei and B. lactis.a - b For each trial, different superscript lowercase
letters within in column denote differences (p < 0.05) between values obtained for different days of storage according to Tukey’s test; A - C Different superscript capital
Acknowledgements
To the Conselho Nacional de Desenvolvimento Científico e Tecnológico – CNPq (Brazil) and the Minis-tério da Agricultura, Pecuária e Abastecimento (Brazil) for financial support.
References
Andreatta, E.; Fernandes, A.M.; Santos, M.V.; Lima, C.G.; Mussarelli, C.; Marquesi, M.C.; Oliveira, C.A.F. 2007. Effects of milk somatic cell count on physical and chemical characteristics of mozzarella cheese. Australian Journal of Dairy Technology 62: 166–170.
Association of Official Analytical Chemists - International [AOAC]. 2005. Official Methods of Analysis. 18ed. AOAC,Gaithersburg, MD, USA.
Bergamini, C.V.; Hynes, E.R.; Zalazar, C.A. 2006. Influence of probiotic bacteria on the proteolysis profile of a semi-hard cheese. International Dairy Journal 16: 856–866.
Bergamini, C.V.; Hynes, E.R.; Palma, S.B.; Sabbag, N.G.; Zalazar, C.A. 2009. Proteolytic activity of three probiotic strains in semi-hard cheese as single and mixed cultures: Lactobacillus acidophilus, Lactobacillus paracasei and Bifidobacterium lactis. International Dairy Journal 19: 467–475.
Bhaskaracharya, R.K.; Shah, N.P. 2001. Texture and microstructure of skim milk Mozzarella cheeses made using fat replacers. Australian Journal of Dairy Technology 56: 9–14.
Brasil. Ministério da Agricultura e Abastecimento. Ordinance No. 352 of 1997: approves technical regulation for the identity and quality of “coalho” cheese. Diário Oficial da União, Brasília, DF, Brazil (in Portuguese).
Buriti, F.C.A.; Rocha, J.S.; Saad, S.M.I. 2005a. Incorporation of Lactobacillus acidophilus in Minas fresh cheese and its implications for textural and sensorial properties during storage. International Dairy Journal 15: 1279–1288.
Buriti, F.C.A.; Rocha, J.S.; Assis, E.G.; Saad, S.M.I. 2005b. Probiotic potential of Minas fresh cheese prepared with the addition of Lactobacillus paracasei. LWT. Food Science and Technology 38: 173–180.
Buriti, F.C.A.; Cardarelli, H.R.; Saad, S.M.I. 2007a. Biopreservation by Lactobacillus paracasei in co-culture with Streptococcus thermophilus in potentially probiotic and synbiotic fresh cream– cheeses. Journal of Food Protection 70: 228–235.
Buriti, F.C.A.; Cardarelli, H.R.; Filisetti, T.M.C.C.; Saad, S.M.I. 2007b. Symbiotic potential of fresh cream cheese supplemented with inulin and Lactobacillus paracasei in co-culture with
Streptococcus thermophiles. Food Chemistry 104: 1605–1610. Buriti, F.C.A.; Okazaki, T.Y.; Alegro, J.H.A.; Saad, S.M.I. 2007c.
Effect of a probiotic mixed culture on texture profile and sensory performance of Minas fresh cheese in comparison with the traditional products. Archivos Latinoamericano de Nutrición 57: 179–185.
Commission Internationale de l’Éclairage [CIE]. 1986. Colourimetry. 2ed. CIE Publication, Vienna, Austria.
Cruz, A.G.; Buriti, F.C.A.; Souza, C.H.B.; Faria, J.A.F.; Saad, S.M.I. 2009. Probiotic cheese: Health benefits, technological and stability aspects. Trends in Food Science and Technology 20: 344–354.
Cunha, C.R.; Viotto, W.H.; Viotto, L.A. 2006. Use of low concentration factor ultrafiltration retentates in reduced fat ‘‘Minas Frescal’’ cheese manufacture: effect on composition, proteolysis, viscoelastic properties and sensory acceptance. International Dairy Journal 16: 215–224.
De Vuyst, L. 2000. Technology aspects related to the application of functional starter cultures. Food Technology and Biotechnology 38: 105–112.
Dinakar, P.; Mistry, V.V. 1994. Growth and viability of
Bifidobacterium bifidum in cheddar cheese. Journal of Dairy Science 77: 2854–2864.
Even, S.; Garrigues, C.; Loubiere, P.; Lindley, N.D.; Cocaign-Bousquet, M. 1999. Pyruvate metabolism in Lactococcus lactis
is dependent upon glyceraldehydes-3-phosphate dehydrogenase activity. Metabolism and Engineering 1: 198–205.
Food and Agriculture Organization. [FAO]. 2001. Evaluation of health and nutritional properties of probiotics in food including powder milk with live lactic acid bacteria. FAO/WHO, Roma, Italy.
Food and Drug Administration [FDA]. 1992. Bacteriological Analytical Manual. 7ed. AOAC International, Arlington, VA, USA.
Gardiner, G.; Ross, R.P.; Collins, J.K.; Fitzgerald, G.; Stanton, C. 1998. Development of a probiotic Cheddar cheese containing human-derived Lactobacillus paracasei strains. Applied and Environmental Microbiology 64: 2192–2199.
Gobbetti, M.; Corsetti, A.; Smacchi, E.; Zocchetti, A.; De Angelis, M. 1998. Production of Crescenza cheese by incorporation of bifidobacteria. Journal of Dairy Science 81: 37–47.
Gomes, A.M.P.; Malcata, F.X.; Klaver, F.A.M.; Grande, H.J. 1995. Incorporation and survival of Bifidobacterium sp. Strain Bo and Lactobacillus acidophilus strain Ki in a cheese product. Netherland Milk and Dairy Journal 49: 71–95.
Gomes, A.M.P.; Vieira, M.M.; Malcata, F.X. 1998. Survival of probiotic microbial strains in a cheese matrix during ripening: simulation of rates of salt diffusion and microorganism survival. Journal of Food Engineering 36: 281–301.
Gomes, A.M.P.; Malcata, F.X. 1998. Development of probiotic cheese manufactured from goat milk: response surface analysis via technological manipulation. Journal of Dairy Science 81: 1492–1507.
Koca, N.; Metin, M.N. 2004. Textural, melting and sensory properties of low-fat fresh kashar cheeses produced by using fat replacers. International Dairy Journal 14:365–373. Laguna, L.E.; Landim, F.G.S. 2003. Starting a small big
agro-industrial business with goat milk and derivatives. Embrapa Informação Tecnológica, Brasília, DF, Brazil (in Portuguese). Lin, W.H.; Hwang, C.F.; Chen, L.W.; Tsen, H.Y. 2006. Viable
counts, characteristic evaluation for commercial lactic acid bacteria products. Food Microbiology 23: 74–81.
Mätö, J.; Alakomi, H.; Vaari, A.; Virjajärvi, I.; Saarela, M. 2006. Influence of processing conditions on Bifidobacterium animmalis
subsp. lactis with a special focus on acid tolerance and factors affecting it products. International Dairy Journal 16: 1029–1037. McBrearty, S.; Ross, R.P.; Fitzgerald, G.F.; Collins, J.K.; Wallace,
Ong, L.; Henriksson, A.; Shah, N.P. 2006. Development of probiotic cheddarcheese containing Lactobacillus acidophilus, Lb. casei, Lb. paracasei and Bifidobacterium spp. and the influence of these bacteria on proteolytic patterns and production of organic acid. International Dairy Journal 16: 446–456.
Ong, L.; Shah, N.P. 2009. Probiotic cheddar cheese: influence of ripening temperatures on survival of probiotic microorganisms, cheese composition and organic acid profiles. LWT – Food Science and Technology 42: 1260–1268.
Park, J.; Rosenau, R.; Peleg, M. 1984. Comparison of four procedures of cheese melt ability evaluation. Journal of Food Science 49: 1158–1162.
Phillips, M.; Kailasapathy, K.; Tran, L. 2006. Viability of commercial probiotic cultures (L. acidophilus, Bifidobacterium sp., L. casei, L. paracasei and L. rhamnosus) in cheddar cheese. International Journal of Food Microbiology 108: 276–280.
Rohm, H.; Jaros, D. 1996. Colour of hard cheese. 1. Description of colour properties and effects of maduration. Zeitschrift fur Lebensmittel Untersuchung Forschung 203: 241–244.
Ryhänen, E.L.; Pihlanto-Leppälä, A.; Pahkala, E. 2001. A new type of ripened, low-fat cheese with bioactive properties. International Dairy Journal 11: 441–447.
Saarela, M.; Lähteenmäki, L.; Crittenden, R.; Salminen, S.; Mattila-Sandholm, T. 2002. Gut bacteria and health food: the European perspective. International Journal of Food Microbiology 78: 99–117.
SAS Institute. 1999. SAS User’s Guide: Statistics; Version 8.0. SAS Institute, Cary, NC, USA.
Shah, N.P. 2007. Functional cultures and health benefits. International Dairy Journal 17: 1262–1277.
Sousa, M.J.; Ardo, Y.; McSweeney, P.L.H. 2001. Advances in the study of proteolysis during cheese ripening. International Dairy Journal 11: 327–345.
Souza, C.H.B.; Saad, S.M.I. 2009. Viability of Lactobacillus acidophilus La-5 added solely or in co-culture with a yoghurt starter culture and implications on physico-chemical and related properties of Minas fresh cheese during storage. LWT - Food Science and Technology 42: 633–640.
Talwalkar, A.; Miller, C.W.; Kailasapathy, K.; Nguyen, M.H. 2004. Effect of packaging materials and dissolved oxygen on the survival of probiotic bacteria in yoghurt. International Journal of Food Science and Technology 39: 605–611.
Vinderola, C.G.; Prosello, W.; Ghiberto, D.; Reinheimer, J.A. 2000. Viability of probiotic (Bifidobacterium, Lactobacillus acidophilus and Lactobacillus casei) and nonprobiotic microflora in Argentinian fresco cheese. Journal of Dairy Science 83: 1905–1911.
Wohlgemuth, S.; Loh, G.; Blaut, M. 2010. Recent developments and perspectives in the investigation of probiotic effects. International Journal of Medical Microbiology 300: 3–10. Yilmaztekin, M.; Özer, B.H.; Atasoy, F. 2004. Survival of