Membrane Insertion for the Detection of
Lipopolysaccharides: Exploring the Dynamics
of Amphiphile-in-Lipid Assays
Loreen R. Stromberg1,2,3☯, Nicolas W. Hengartner4, Kirstie L. Swingle5, Rodney
A. Moxley6, Steven W. Graves1,3, Gabriel A. Montaño5☯, Harshini Mukundan1,2,3☯*
1Center for Biomedical Engineering, University of New Mexico, Albuquerque, New Mexico, United States of America,2Physical Chemistry and Applied Spectroscopy, Los Alamos National Laboratory, Los Alamos, New Mexico, United States of America,3The New Mexico Consortium, Los Alamos, New Mexico, United States of America,4Theoretical Biology and Biophysics, Los Alamos National Laboratory, Los Alamos, New Mexico, United States of America,5Center for Integrated Nanotechnologies, Los Alamos National
Laboratory, Los Alamos, New Mexico, United States of America,6School of Veterinary Medicine and Biomedical Sciences, University of Nebraska-Lincoln, Lincoln, Nebraska, United States of America
☯These authors contributed equally to this work.
Abstract
Shiga toxin-producingEscherichia coliis an important cause of foodborne illness, with cases attributable to beef, fresh produce and other sources. Many serotypes of the patho-gen cause disease, and differentiating one serotype from another requires specific identifi-cation of the O antigen located on the lipopolysaccharide (LPS) molecule. The amphiphilic structure of LPS poses a challenge when using classical detection methods, which do not take into account its lipoglycan biochemistry. Typically, detection of LPS requires heat or chemical treatment of samples and relies on bioactivity assays for the conserved lipid A por-tion of the molecule. Our goal was to develop assays to facilitate the direct and discrimina-tive detection of the entire LPS molecule and its O antigen in complex matrices using minimal sample processing. To perform serogroup identification of LPS, we used a method called membrane insertion on a waveguide biosensor, and tested three serogroups of LPS. The membrane insertion technique allows for the hydrophobic association of LPS with a lipid bilayer, where the exposed O antigen can be targeted for specific detection. Samples of beef lysate were spiked with LPS to perform O antigen specific detection of LPS fromE.
coliO157. To validate assay performance, we evaluated the biophysical interactions of LPS with lipid bilayers both in- and outside of a flow cell using fluorescence microscopy and fluorescently doped lipids. Our results indicate that membrane insertion allows for the quali-tative and reliable identification of amphiphilic LPS in complex samples like beef homoge-nates. We also demonstrated that LPS-induced hole formation does not occur under the conditions of the membrane insertion assays. Together, these findings describe for the first time the serogroup-specific detection of amphiphilic LPS in complex samples using a mem-brane insertion assay, and highlight the importance of LPS molecular conformations in detection architectures.
a11111
OPEN ACCESS
Citation:Stromberg LR, Hengartner NW, Swingle KL, Moxley RA, Graves SW, Montaño GA, et al. (2016) Membrane Insertion for the Detection of Lipopolysaccharides: Exploring the Dynamics of Amphiphile-in-Lipid Assays. PLoS ONE 11(5): e0156295. doi:10.1371/journal.pone.0156295
Editor:Maria Gasset, Consejo Superior de Investigaciones Cientificas, SPAIN
Received:January 25, 2016
Accepted:May 12, 2016
Published:May 26, 2016
Copyright:© 2016 Stromberg et al. This is an open access article distributed under the terms of the Creative Commons Attribution License, which permits unrestricted use, distribution, and reproduction in any medium, provided the original author and source are credited.
Data Availability Statement:All relevant data are within the paper and its Supporting Information files.
Introduction
Shiga toxin-producingEscherichia coli(STEC) is an important cause of foodborne illness with cases attributable to beef and fresh produce, among other sources [1]. There are many sero-types of STEC with a wide range of virulence, which are capable of infecting humans. Identifi-cation in part has relied upon detection of serotype, which in turn, relies on the identifiIdentifi-cation of external biomarkers on the bacterial cell.
Lipopolysaccharide (LPS) is the primary component of the outer membrane of Gram-nega-tive bacteria, and a key stimulator of the mammalian innate immune system [2–5]. LPS is among a class of molecules called pathogen-associated molecular patterns (PAMPs). PAMPs are bacterial products, often with redundant molecular structure, that are recognized by many host immune receptors, e.g., Toll-like receptors [6]. The bacterial membrane of anEscherichia coli(E.coli) cell is comprised of approximately 106LPS molecules, or about 75% of the outer membrane [7–9]. LPS, and more specifically the lipid A moiety is also known as endotoxin, and can induce septic shock in a variety of mammalian hosts through the activation of mono-cytes and macrophages that release a series of inflammatory cytokines [10–15] in response to invading pathogens.
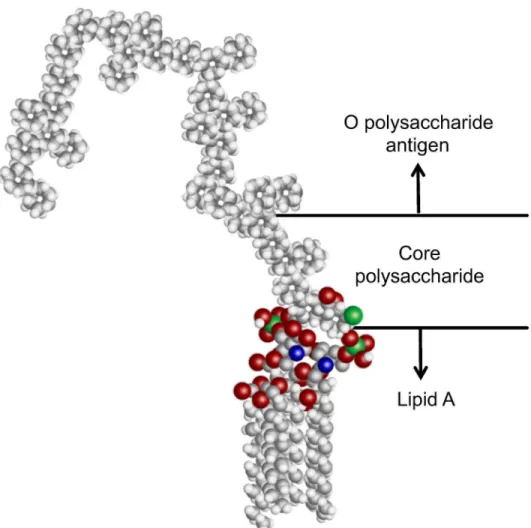
The structure and signaling mechanism of LPS has been well studied [16]. LPS is a nega-tively charged amphiphilic molecule that consists of three primary components (Fig 1). The hydrophobic lipid A tail is a highly conserved molecule consisting of 6–7 fatty acid tails [8]. The endotoxic effects of lipid A [9,16,17] are initiated by the binding of this component to host receptors and serum binding proteinsin vivo[13,18,19]. Lipid A is covalently attached to the less conserved core polysaccharide region, which in turn extends to the hypervariable O poly-saccharide antigen (O-ag) [16,17,20,21]. Typically, the O-ag consists of 1–50 subunits made of 1–7 glycosyl residues [21,22]. Among different serotypes and species, the O-ag can vary greatly in both identity and degree of branching of the glycosyl residues [21]. This variability is there-fore used for classifying a bacterial serotype. Interestingly, many of the PAMPs that stimulate host innate immune recognition, such as lipoarabinomannan fromMycobacterium tuberculo-sis, share a similar amphipathic structure [23,24]. Beyond LPS, detection of such amphiphilic signatures is critical to the understanding of host-pathogen biology.
Detection of LPS and identification of the O-ag is not always straightforward because of the variability in structure, and the possibility for conserved epitopes to present on multiple ser-ogroups of LPS [16,21,25]. Detection methods for LPS typically focus on quantification of lipid A or its biological activity, rather than identification of serogroup [26,27]. While this method of detection is valuable for determining endotoxin contamination in sterile injectables and implantable devices, it provides little value for diagnostic applications. Immunoassays that are capable of antigen discrimination are optimized for detection of protein antigens and do not take into account the amphiphilic biochemistry of lipoglycans, causing low sensitivity and repeatability [28,29]. Factors such as conserved hydrophobic regions, micelle aggregation, poor binding affinity of antibodies, and association with serum lipoproteins have made detection of LPS and similar lipoglycans difficult targets for antigen specific assays [19,28,30,31]. Detection of the O-ag with classical methods such as latex agglutination or immunomagnetic separation utilize cross reactive polyclonal antibodies, which can lead to misidentification of the serogroup [32–36]. Enzyme-linked immunosorbent assays for detection of both LPS and O-ag serogroup identification have also been developed, but require extensive sample preparation, multiple antibodies, and yet suffer from non-specific interactions of the antibodies [30,37–41]. Polymer-ase chain reaction is also a method for detecting the specific LPS transport and polysaccharide biosynthesis genes. However, cross reactivity between specific genes of particular serotypes has been noted [42–44], leading to misidentification of those serotypes. Additionally, residual
Research Center, an Energy Frontier Research Center funded by the United States Department of Energy, Office of Science, Basic Energy Sciences under Award No. DE-SC0001035. Nicholas Hengartner was supported by a Los Alamos National Laboratory Directed Research and Development (LDRD) award (project title, Integrative
Biosurveillance, PI Mukundan and McMahon). The funders had no role in study design, data collection and analysis, decision to publish, or preparation of the manuscript.
nucleic acids can indicate false positive results due to the presence of non-viable bacteria in samples [45].
Thus there is a need to improve current detection methods for identification of LPS O-ag. It has been well documented that amphiphiles, like LPS, interact both with lipid components of artificial membranes, as well as host serum-binding proteins [13,19,46–50]. Our team has pre-viously explored the amphiphilic biochemistry of biomarkers such as phenolic glycolipid and lipoarabinomannan, and developed a tailored method, membrane insertion, for their detection [47,48,51]. Previously, we have reported on the detection of lipoarabinomannan using mem-brane insertion and sandwich immunoassays, and characterized the interaction of the amphi-phile with lipid bilayers by atomic force microscopy (AFM) [47,48,51–53]. Our approach utilized a waveguide-based optical biosensor platform that was developed specifically for the ultra-sensitive detection of biomarkers [54,55]. This platform uses single mode planar optical waveguides functionalized with a lipid bilayer inside a flow cell to facilitate detection through the use of evanescent sensing and a fluorescently conjugated antibody [54–58]. This technique is based on the principle of exponential decay of the evanescent wave away from the surface of the waveguide material, which results in an excitation field that extends only 200 nm from the
Fig 1. Representative structure of the molecular components of LPS.The conserved, hydrophobic lipid A group, core polysaccharide, and hypervariable O polysaccharide antigen. The lipid A group of mostE.coli strains has 6 fatty acid tails which anchors LPS into the bacterial cell membrane, and is recognized by host receptor proteins.
surface of the waveguide. Therefore, only samples and fluorophores within the evanescent field are illuminated by incident light. This minimizes background signal, thereby increasing the sig-nal-to-noise (s:n) ratio of excited antibody-fluorophore conjugates bound to antigen at or near the surface of the waveguide. Waveguides are functionalized with supported lipid bilayer assemblies. Upon exposure to the amphipathic biomarker, the hydrocarbon tails passively dif-fuse through the aqueous matrix, and associate with the lipid bilayer, eliminating the need for capture antibodies [48,51]. In this manuscript, we show waveguide-based membrane insertion assays for detection of LPS O157 in ground beef lysate. Also presented are membrane insertion assays for detection of LPS from other serogroups, demonstrating broad applicability of this platform. For detection of LPS, this method helps to minimize exposure of conserved lipid A epitopes to cross reactive antibodies, while maximizing exposure of the highly specific O-ag to detection antibodies. Due to the heterogeneous nature of LPS, the inability to determine an accurate molecular weight or conformation of the antigens restricts the quantitative capability of assays for whole LPS. This is not a limitation of the assay or the platform, rather a critical issue with the detection of entire amphiphilic moieties by any methodology. Membrane inser-tion offers a reliable and direct strategy for the detecinser-tion of amphiphilic targets in complex backgrounds with minimal sample preparation at high s:n levels and low (μg/mL) limits of
detection. Detection of amphiphilic biomarkers is important for many pathophysiological measurements and in the study of host-pathogen biology, in addition to food safety.
To identify, describe, and delineate assay parameters, we have used biophysical methods to characterize the interaction of LPS with lipid bilayers. Lipid bilayers have been previously used to study the interactions of LPS in simple biomimetic systems [46,59]. Recent work from our team demonstrated LPS-induced deformations in 1,2-dioleoyl-sn-glycero-3-phosphocholine (DOPC) lipid bilayers based on ionic conditions [10]. These findings raised questions on the dynamics of the interaction of amphiphilic LPS with bilayers in membrane insertion assays. Since the detection antibodies would bind to the open glass substrate caused by hole formation, a high signal would result, which in the given scenario could be an effect of hole formation. In this manuscript, we address that question by devising a flow cell mimetic chamber to explore the interactions of LPS with lipid bilayers at conditions synonymous with our detection assays. Finally, we examine LPS-lipid bilayer dynamics using multiple serogroups of LPS to determine if the variable O-ag structure of the molecule affects the interactions with lipid bilayers, and explore the relevance to detection assays and the study of host-pathogen biology. Thus, we report membrane insertion as a reliable method for detection of entire LPS. The biochemistry of the target should be considered in all scenarios of detection as many factors can influence LPS micelle conformations and antigen presentation.
Results and Discussion
Detection of LPS with Membrane Insertion
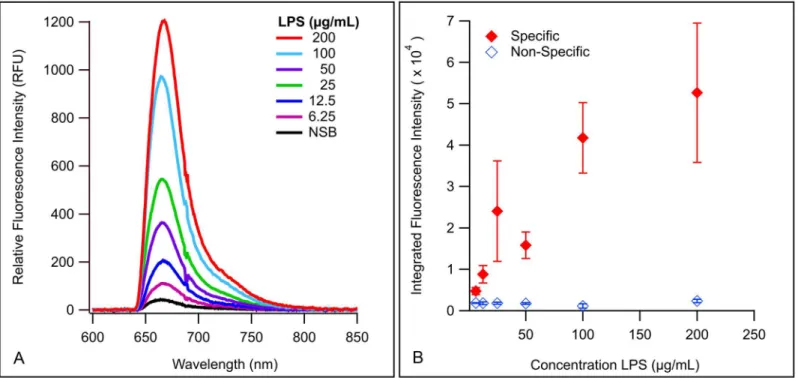
To determine the concentration range over which LPS can be reliably detected by membrane insertion, assays of LPS O157 were performed a minimum of three times over a concentration range of 6.25–200μg/mL LPS (Fig 2A), using polyclonal antibody (pAb) anti-E.coliO157
(O157) labeled with Alexa Fluor1647 (af647) as the detection antibody (pAb O157-af647). The limits of detection (LoD) for LPS O157 were calculated to be 4.80μg/mL usingEq (1)with
size and conformational presentation of the molecule. For one, LPS will present in a micellar conformation in aqueous solutions [17,60–63]. Beyond the critical micelle concentration (CMC) of LPS O157, the amphiphile would exist both as monomers and aggregates [64,65], making repeatable quantitation challenging [64]. LPS micelles can further vary based on the size of the O-ag chains, which can be full-length, truncated, or absent entirely, depending on bacterial strain and growth phase [17,60,66]. Furthermore, LPS can also present in different shapes of micelles, such as lamellar, cubic, and hexagonal inverted structures [67–70], which are dependent on antigen structure, pH, ion concentration, solution composition, and temper-ature [10,17,62,71]. All of the above factors contribute to the size or shape of the micelles, and influence the binding availability of epitopes for detection, which in turn affects the inter-assay variability (Fig 2B). While reasonable efforts to control for the size of micelles in the prepara-tions was taken (e.g. extended bath sonication [72] during testing of serogroup and beef lysate assays), we cannot be certain that LPS micelles in our assay systems are homogenous. This bio-chemical variability has limited the quantitative measurement of amphiphilic biomarkers in general [51,73]. Lastly, due to the stability of endotoxin [68,74] we cannot entirely discount the potential of endogenous endotoxin that may have been present on glassware, either from previ-ous assays or other environmental bacteria, even though rigorprevi-ous cleaning procedures were employed. This is also a relevant concern in beef lysates. We therefore only demonstrate the concentration range over which LPS can be reliably and repeatedly detected using mem-brane insertion. Memmem-brane insertion is not intended to provide a quantitative measurement of concentration, but to accurately detect LPS with minimal sample processing in complex sam-ples such as beef lysates. To determine that the variability between assays was caused by the variable nature of LPS, we employed rigorous statistical analysis of the data. Statistical regres-sion analysis of the uncorrected data sets and the residuals (Tables A-C inS1 File) from
Fig 2. Membrane insertion for detection of LPS O157.(A) Spectral curves demonstrating detection of various concentrations of LPS O157. (B) Integrated values of spectral curves plotted as single points with standard error of the mean. Closed diamonds indicate averaged integrated signal intensity, and open diamonds are integrated NSB.
multiple experiments demonstrate that factors such as antigen (LPS) concentration, choice of waveguide, power coupled into the waveguide, non-specific interaction of the antibodies with the lipid bilayer, and other systematic parameters do not account for the large deviations seen in detecting specific concentrations of LPS. The only significant factor resulting from the analy-sis is the antigen itself, though we also saw some significance associated with a single waveguide (Table C inS1 File). This suggests that variations in the CMC of the amphiphile, due to the het-erogeneous nature and other biophysical properties, affect the interaction of LPS with the lipid bilayer and the detection antibody. This is further substantiated by measurements of protein binding on the same instrumentation in this and previous studies that do not present with such variability. Therefore, we conclude that the variability in signal at specific concentrations is pri-marily dependent on the conformation of the LPS antigens, and not variability associated with the detection platform, methods, or other reagents.
To assess application for detecting contamination in food products, assays were performed in a complex sample matrix (e.g. beef lysate). The ability to detect LPS in beef products has his-torically required extensive processing and dilution of samples, and has only yielded informa-tion about endotoxin contaminainforma-tion with no clues as to pathogen virulence [75,76]. However, membrane insertion facilitates detection of whole, intact LPS, and discrimination of the O-ag present within the samples, which facilitates bacterial serotyping. Membrane insertion assays were performed in 1 mg/mL ground beef lysate at three concentrations over the range of 6.25–
50μg/mL LPS O157 (Fig 3). LoD for this assay was calculated to be 4.2μg/mL LPS O157. The
ratios between specific signal and NSB (s:n) at 6.25μg/mL (~4), and at 50μg/mL (~27) are
comparable, albeit slightly higher, to the those seen in the benchmark assay (Table 1). How-ever, the ratio at 25μg/mL (s:n~10) was lower than that observed in the benchmark assay
(Table 1). Despite this, the LoD for both assays are comparable (4.8μg/mLvs. 4.2μg/mL,
benchmark and beef lysate respectively). The changes in the presentation and micelle proper-ties of the antigen in complex physiological backgrounds can account for these observed differ-ences in s:n ratios. We attribute the increased signal at 6.25 and 50μg/mL to the possibility that
LPS is known to associate with lipoproteins [13,19,47,48,53], such as low-density and high-density lipoproteins (LDL and HDL respectively), in serum and muscle tissue [77]. Since these lipoproteins carry amphiphiles and can insert them into membranes [50,78], it is possible that HDL and LDL are serving to insert monomeric LPS or LPS-lipoprotein complexes into the DOPC lipid bilayers which could serve to increase detection of O-ag. HDL is a critical factor for both treatment and prognosis of septic patients [79] because of its ability to shuttle amphi-philic LPS in hosts. No data is readily available on the CMC of LPS O157, however, it is reason-able to assume it to be somewhat similar to the CMC of LPS O111:B4 (22μg/mL) [17]. This
means that at 6.25μg/mL, LPS would be present mostly as a monomer, and above 25μg/mL,
aggregates would be the primary conformation. At 25μg/mL mL the change in the s:n ratio
variation in measured detection signals of intact amphiphilic biomarkers such as LPS, and should be taken into account for the design and evaluation of diagnostic assays as well as the understanding of host-pathogen biology.
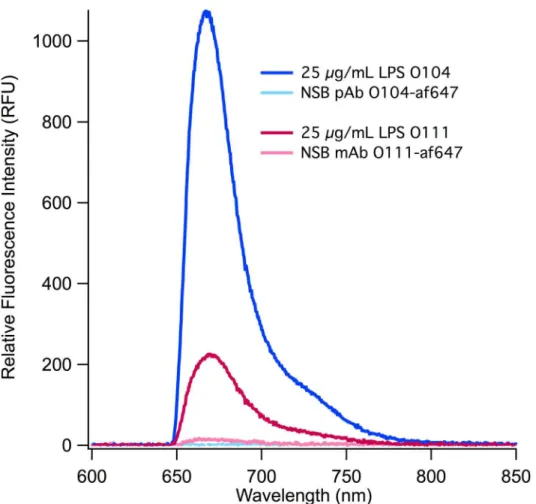
To demonstrate the broad applicability of membrane insertion assays, we tested LPS from other pathogenicE.coli(LPS O104:H4 and LPS O111:H11) using af647 labeled detection anti-bodies targeted against the specific O-ag (Fig 4), Sensitive detection is demonstrated in both cases with LPS O104 demonstrating a significantly higher (s:n~39) response than LPS O111 (s:n~6). This difference can largely be attributed to the sensitivity of the respective antibodies
Fig 3. Concentration dependent detection of LPS O157 in 1 mg/mL beef lysates.Detection of LPS in beef lysates shows an increase in signal to noise ratios as compared to those seen in the benchmark assay.
doi:10.1371/journal.pone.0156295.g003
Table 1. Signal to Noise Ratios of LPS Membrane Insertion Assays.
Signal:Noise Ratios
LPSμg/mL benchmark beef lysate*
6.25 2.6 4.1
12.5 5.2
-25 13.4 9.8
50 8.8 26.9
100 23.3
-200 29.5
-*LPS O157 was tested at 3 concentrations in beef lysates
[36]. Due to the large difference in s:n ratios in these assays, the limits of detection also demon-strate the same pattern (0.77 and 7.36μg/mL respectively). This is due in part to the low NSB
of both antibodies, but also the specificity of the antibodies for their specific epitopes. Both LoDs fall within the reported range for physiologically relevant concentrations of LPS [78]. The LoDs we report are also an order of magnitude lower than those demonstrated by Rangin
et al. [80,81] (2.2 mg/mL) when they reported specific detection of LPS in their benchmark assays using polydiacetylene liposome sensors. Our benchmark detection limit is also lower than that reported by Nieradkaet al. [82], (50μg/mL), who used self assembled monolayers to
discriminate between LPS from different strains ofHafnia alvei. We observed a much lower variability between the assay replicates (S1 Fig) as compared to the benchmark assay at 25μg/
mL LPS. We attribute this primarily to the increased sonication time during antigen prepara-tion that was implemented here, but also acknowledge that the O-ag of these LPS subtypes are much different from O157 and therefore may be more homogenous at this concentration. We would like to iterate that membrane insertion is the first to detect the O-ag of intact amphi-philic LPS directly in beef homogenates, as there is, there are not ideal comparisons for assay sensitivity and performance. The advantage of this method is not simply the sensitivity, but the ability to measure the entire moiety, which has significant physiological relevance.
Fig 4. O-ag targeted detection of LPS.Using membrane insertion, two types of LPS were detected using their complement antibodies, polyclonal anti-E.coliO104 (pAb O104) and monoclonal anti-E.coliO111 (mAb O111) labeled with af647.
A key factor that affects performance of any antibody-based assay is the sensitivity and specificity of the antibody being used. In membrane insertion, the amphiphilic antigen is pre-sented partitioned into a lipid bilayer, which mimics the physiological presentation of such antigensin vivo. The antibody targeting LPS O104 is a polyclonal, extracted from an animal immunized with whole bacteria, and likely is more suitable for recognizing LPS when pre-sented in a lipid carrier interface. In contrast, the antibody against LPS O111:H11, is monoclo-nal (mAb), and was raisedin vitro. Also, polyclonal antibodies have multiple paratopes that can bind several different epitopes on the antigen, as compared to mAbs that target a single epitope. The source animal for antibodies may also play a large role in antibody affinity and specificity, since it has been demonstrated that different animal types exhibit varied levels of sensitivity to LPS [11,83], which would affect antibody expression. The above factors in anti-body specificity and sensitivity are not unique to the two that are discussed here or to the membrane insertion approach, but indeed should be considered in the development of all assays involving detection antibodies.
Imaging LPS-Lipid Bilayer Interactions inside a Flow Cell
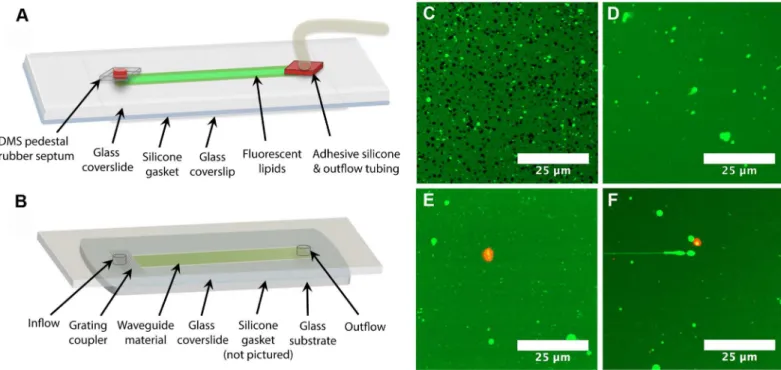
We have used fluorescence microscopy [10] as a tool to characterize amphiphile-lipid interac-tions, thereby building more robust membrane insertion assays for these difficult antigens. Pre-viously, we have shown that LPS O111:B4 can form holes in supported lipid bilayers [10,84] using fluorescence microscopy. It therefore became imperative to determine whether hole for-mation was a limitation of LPS membrane insertion assays. To investigate this, we developed an imaging compatible flow cell model (Fig 5A) that replicated the internal dimensions and functional surfaces of the flow cell used in our waveguide-based assays (Fig 5B). This model enabled direct imaging of lipid bilayers, as well as the specific binding of the fluorescent anti-bodies to LPS (Fig 5C–5F). We investigated the effects of LPS O111:B4 (Fig 5C and 5D) and LPS O157 at 100μg/mL, 50μg/mL, and 25μg/mL (Fig 5E and 5F), under the same conditions
as the waveguide assays. We found that with LPS O157, the lipids maintained excellent lateral fluidity (S3 Fig) and there was no hole formation in the bilayers at any of the tested concentra-tions, thereby eliminating our concerns. LPS O111:B4, on the other hand, formed holes in lipid bilayers (Fig 5C) within the flow cell, but only at higher concentrations of antigen (>50μg/
mL) (Fig 5D). No hole formation was observed at lower, more physiologically relevant concen-trations of LPS (Fig 5D). We were also able to generate composite images of the fluorescent lip-ids and the specific binding of pAb O157-af647 (Fig 5E and 5F) at localized spots within the flow cell for LPS O157. As demonstrated by the lack of overall red fluorescence (S4 Fig) in the images, the NSB of the antibody is quite low, while the specific binding intensity is saturated at localized positions. This data supports the low NSB signals seen in the membrane insertion assays, and serves as visual confirmation of antigen behavior.
Imaging LPS Subtypes on Glass Slides
Due to the differential effects we saw between LPS O111:B4 and LPS O157, we evaluated the effect of 50μg/mL LPS from various serogroups (O26, O45, O103, O104, O111, O113, O121,
structure of the O-ag chain affects the CMC of LPS [17], the size and shape of the micelle pro-duced in an aqueous medium can be different between LPS subtypes. Additionally, differ-ences in O-ag structure combined with possible chemical signature differdiffer-ences in the core polysaccharide of LPS [68] between strains could contribute to a variable charge distribution in the LPS [69,70]. This, in turn, could affect the delamination of the lipid bilayer by LPS micelles. Lastly, there is the potential for capsular K polysaccharide antigens to be co-expressed in these different preparations of LPS [85]. The differential effect seen when using different types of LPS is a key indicator that small changes in biochemistry and structure can have a large impact on the interface between LPS (and other amphiphiles) and lipid bilayers. In other independent research we are currently exploring the effect of other environmental
Fig 5. Assay performance inside flow cells.Schematics of (A) imaging flow cell and (B) waveguide flow cell. Major differences between these two flow cells include replacement of the waveguide glass substrate with a thin glass coverslip for imaging, and the addition of PDMS and silicone pedestals to create an airtight environment to preserve lipid integrity throughout an assay. (C) 100μg/mL and (D) 50μg/mL LPS O111:B4 incubated with BODIPY
labeled DOPC lipids. Composite images of (E) 50μg/mL and (F) 25μg/mL LPS O157 bound by fluorescently labeled pAb O157-af647.
doi:10.1371/journal.pone.0156295.g005
Fig 6. Imaging LPS O157 with lipid bilayers.(A) Bilayer prior to incubating with LPS O157. 50μg/mL LPS (B) O157, (C) O104, and (D) O111:
H11.
factors such as complex lipids, temperature, and pH on hole formation with different ser-ogroups of LPS, to be reported in future studies.
Here we have shown that LPS behaves in dramatically different ways under different condi-tions. We demonstrated that it can be sensitively detected in complex beef lysate samples using membrane insertion with higher s:n ratios than those seen in the benchmark assays, which highlighted the important roles of LPS binding proteins (from the lysate) and solution compo-sition, in the assay behavior. We also noted that the concentration dependent micelle proper-ties of LPS in aqueous media, affects the interaction with bilayers at specific concentrations, most notably around a published CMC value for LPS [17], and at higher concentrations where LPS is known to form supramolecular aggregates [69], therefore causing the assay to be non-linear. We also saw a concentration dependent effect in LPS-induced hole formation when we incubated LPS O111:B4 in the flow cell mimetic where we saw no deformities of the membrane at lower concentrations. Additionally, the absence of hole formation when using different types of LPS is also a key indicator that the behavior of very similar amphiphiles can be dramatically different. This data complements our previous results which demonstrate that simply changing from a monovalent to a divalent cation in the buffer solution can also effect amphiphile behav-ior when incubating with lipid bilayers [10]. Together, the results listed above indicate the criti-cal importance of controlling conditions to manage amphiphile behavior, especially when interfacing LPS with bilayers. The implications of these conclusions do not escape us, as many studies that use LPS do not take necessary steps to control amphiphile behavior, and may therefore achieve both unexpected and difficult to repeat results. These results may also help explain the difference in biological activities of different serogroups of LPS, which may not be solely attributable to the structure of lipid A [16]. Since LPS is globally used as an immune stimulant and a key indicator of bacterial infection, the continued study of this molecule is crit-ical for understanding host-pathogen interactions and developing better amphiphilic detection platforms.
These studies demonstrate the challenges associated with the measurement of amphiphilic biomarkers such as LPS. The biochemistry of LPS causes altered behavior of the molecule when small differences are made to its environmental system. This is an especially important consideration to take into account not just for LPS, but for all amphiphiles which may be indi-cators of infection or disease. Previous studies reporting the poor sensitivity of assays for the direct detection of LPS and other biomarkers in aqueous mileau, such as blood, have ignored their amphipathic biochemistry. With this manuscript and others, we hope to unravel the chal-lenges associated with the detection of such biomarkers in clinically relevant samples, and develop strategies to overcome them effectively in the future.
Materials and Methods
Materials
-glycero-3-phosphoethanolamine-N-(cap biotinyl) (sodium salt) -glycero-3-phosphoethanolamine-N-(cap-Biotin) were obtained from Avanti1
Polar Lipids (Alabaster, AL). C5-BODIPY1FL HPC (2-(4,4-difluoro-5,7-dimethyl-4-bora-3a,4a-diaza-s-indacene-3-pentanoyl)-1-hexadecanoyl-sn-glycero-3-phosphocholine) was purchased from Molecular Probes1(Eugene, OR). Sylgard1silicone elastomer kit (Dow Corning, Midland, MI) was used to pour a 90/10 mix of polydimethylsiloxane (PDMS). Alexa Fluor1647 labeling kits, Ultra-Pure™Glycerol, and HEPES were all from Life Technologies (Thermo Fisher Scientific, Grand Island, NY). Silicon oxynitrite waveguides were purchased from nGimat (Norcross, GA) and the functional surface of silicon dioxide was maintained by Spectrum Thin Films (Hauppauge, NY). Silicone gaskets for waveguide assembly were from Grace Bio-Labs (Bend, OR) and Secure seal spacers (9 mm diameter x 0.12 mm deep) were from Electron Microscopy Sciences (Hat-field, PA). Glass microscope slides, Gold Seal™cover glass, and sucrose were purchased from Thermo Fisher Scientific (Rockford, IL). Epoxy was from Gorilla Glue, Inc., (Cincinnati, OH), and Simple Truth1
organic ground beef was purchased from the local Kroger Stores (Los Ala-mos, NM). All reagents were of the highest quality for their intended purpose.
Waveguide Preparation
Single mode planar optical waveguides were cleaned and prepared as previously described [33,54,55,57,86,87]. In brief, the waveguides and coverslides were cleaned by bath sonication for 5 min each in chloroform, ethanol, then water. Waveguides and coverslides were dried under an argon stream and exposed to UV-ozone (UVOCS Inc., Montgomeryville, PA) for 40 min. Flow cells for immunoassays were immediately assembled using cleaned waveguides and coverslips which were bonded together by a silicone gasket with a laser cut channel in the cen-ter. Following assembly, the flow cells were injected with a preparation of lipid micelles, then incubated overnight at room temperature (RT), to facilitate vesicle fusion [57].
Micelle Preparation
Micelles for waveguide membrane insertion experiments were prepared by probe sonication as previously described [33,54,55,86,87]. 2 mM DOPC and 1% (mol/mol) cap-Biotin were pre-pared by deposition of chloroform-dissolved lipids into glass tubes, and evaporation of solvent under an argon stream. Biotin incorporation allows for the evaluation of bilayer integrity at the conclusion of assays [51,57]. Lipids were rehydrated in phosphate buffered saline (PBS), stirred for 2 hours (hr) at RT, 120 revolutions per minute (rpm) on an orbital shaker, followed by 10 freeze-thaw cycles. Finally lipids were probe sonicated for 6 min (1.0 s pulse on/off, 15% ampli-tude) using a Branson ultrasonic generator.
Micelles for fluorescent imaging were prepared in a similar fashion as those for waveguide experiments with the addition of 0.5–1% (mol/mol) of C5-BODIPY FL HPC to serve as a
fluo-rescent marker for imaging. Lipids in chloroform were vacuum dessicated overnight and subse-quently prepared in PBS, followed by 6 freeze-thaw cycles and 10 minutes of continuous probe sonication (tip dia. = 3 cm, 12 watts) (Sonicator 3000, Misonix, Farmingdale, NY)
Lipopolysaccharides, Beef Samples, and Antibodies
Except in the cases of concentration dependence assays, LPS stocks (5 mg/mL) were thawed and bath sonicated for 15 min, diluted to the working concentration in PBS and sonication was repeated prior to injection in the flow cell. For the benchmark assays on concentration depen-dence of LPS, the stocks were sonicated for 5 min, diluted to working concentration in PBS and resonicated for an additional 5 min prior to injection.
(0.5 M sucrose, 10 mM HEPES, 25 mM KCl, 1 mM EDTA, 10% v/v glycerol, 5 mg/mL concen-tration) [33]. The suspension was alternately vortexed (30 sec) and bath sonicated (30 s) until large protein aggregates were eliminated. Samples were diluted to 1 mg/mL in PBS immediately before use. The beef homogenate was used as a negative control, in order to evaluate back-ground fluorescence and assess antibody cross-reactivity with a crude matrix that simulates an actual test sample. Additionally we also spiked LPS directly into homogenates to determine detection capabilities in a beef sample [33].
Reporter antibodies for LPS were pAb anti-E.coliLPS O157 (pAb O157), pAb anti-E.coli
LPS O104:H4 (pAb O104) and mAb anti-E.coliO111:H11 (mAb O111). All reporter antibodies were fluorescently labeled with Alexa Fluor1647 (af647) per kit instructions. Molar ratio of dye to protein was measured using a NanoDrop™1000 (Thermo Scientific) and calculated (3.68 for LPS concentration assays, and 7.37 for beef lysate assays) per Alexa Fluor1kit instructions. Degree of labeling for pAb O104-af647 was 3.17 and that for mAb O111-af647 was 7. After labeling, antibodies were checked for activity using immunoblotting of 5 mg/mL LPS antigens onto nitrocellulose, and compared with immunoblotting results for antibodies prior to labeling.
LPS Membrane Insertion Assays
In all cases, unless stated otherwise, membrane insertion assays were performed in triplicate (minimum number of repeats) using the same concentrations of antibody, method of LPS preparation, and incubation times. All volumes (sample, antibody, beef lysate) were 200μL.
Concentration dependent LPS insertion assays were using LPS O157 and 25 nM pAb O157-af647 as the reporter antibody. Flow cells were prepared as described and blocked for 1 hr with 2% (w/v) BSA, then rinsed with 0.5% BSA/PBS. Incident light from a 635 nm laser, (power 440–443μW) was coupled into the waveguide using a diffraction grating. The
response signal was adjusted for maximum peak intensity using a spectrometer (USB2000, Ocean Optics, Winter Park, FL) interfaced with the instrument and an optical power meter (Thor Labs, Newton, NJ) [33,54,55,58]. The background signal associated with the lipid bilayer and protein block was recorded after which the flow cell was incubated (90 min) with pAb O157-af647 to determine NSB between the antibody and the lipid bilayer. The flow cell was rinsed with 2 mL of wash buffer (0.5% BSA/PBS) after all incubations. LPS was incubated for 2 hr to allow maximal association with the supported lipid bilayer. Excess LPS micelles were removed by washing and the signal recorded. Subsequently, reporter antibody was incu-bated for 90 min and rinsed, and the specific signal associated with antibody bound to LPS captured on the bilayer was recorded.
Membrane insertion assays for serogroups of LPS were performed in triplicate at a concen-tration of 25μg/mL, using pAb O157-af647 as the reporter antibody. This approach exploits
the cross-reactivity of a polyclonal antibody to the conserved O-ag regions of different ser-ogroups of LPS [36]. However, we raised the hypothesis that by use of antibodies specific for a particular LPS serogroup, we could potentially enhance the sensitivity and selectivity of detec-tion by targeting the variable O-ag region. To evaluate this, LPS O104 was tested under identi-cal conditions using 25 nM pAb O104-af647 as the reporter, and then compared to the signal using the non-specific pAb O157-af647. Additionally we also tested whether using mAb spe-cific to the O-ag would increase the spespe-cific signal and tested LPS O111:H11 with its respective mAbs.
LPS (6.25, 25, or 50μg/mL) was spiked into beef lysate and incubated for 2 hr. Specific signal
was recorded after 90 min incubation with the reporter antibody.
Imaging Inside of a Flow Cell
Due to previous observations that LPS could induce hole formation in DOPC lipid bilayers, we investigated this mechanism as a possible limitation of membrane insertion assays. To accom-plish this, we established a flow cell mimic to investigate the interactions of LPS with DOPC bilayers inside a flow cell of identical dimensions and functionalized surfaces as our waveguide biosensor (Fig 5A and 5B). For this, two holes were drilled into a glass slide and a 24x50 mm cover glass was used in place of the waveguide piece to allow imaging. Glass was cleaned in 30:10 sulfuric oxides for 40 min then rinsed repeatedly and bath sonicated 3 times (5 min/ each) in deionized water. The flow cell model was constructed from the two glass pieces with the addition of an attached outflow tube and a rubber septum to allow buffer exchange. PDMS (90:10 elastomer:curing agent) was poured into plastic petri dishes to a final height of ~4 mm, allowed to cure, and then cut into a square (~1 cm x 1 cm). To create an injection port, a rubber septum was inserted into the PDMS when it was approximately halfway cured. For the fluid outflow port, a 2 mm hole was made in a 1 cm2of self-adhesive silicone using a biopsy punch and tubing was inserted through the hole. PDMS and flow cell assembly was then exposed to UV-Ozone for 2 min after which PDMS/septum assembly and silicone were stuck to the glass slide and seams were sealed using epoxy. Epoxy was allowed to cure for 1 hr prior to deposition of 2 mM DOPC + 1% biotin + BODIPY1labeled lipid micelles. Lipids were deposited into the flow cell, the outflow tube was clamped shut, and the apparatus was incubated O/N at 4°C in the dark. Flow cell was rinsed with 10 mL PBS and imaged on an Olympus IX-81 motorized inverted microscope with excitation provided by a 488 nm Argon ion laser and green filter set. Fluorescence recovery after photobleaching (FRAP) was used to confirm lateral fluidity of lipid bilayers. LPS membrane insertion assays were then performed in the same manner as the wave-guide assays (duplicate repeats), with images recorded to determine hole formation (or lack thereof) under these conditions. In most cases, images were recorded at 1024 x 1024 pixels at a scan rate of 12.5μs/pixel. FRAP was performed on 512 x 512 pixel frames, using 5x zoom, at a
scan rate of 10μs/pixel.
Imaging LPS on Glass Slides
To determine differential interactions of various LPS serogroups on DOPC lipid bilayers, 9 mm secure seal spacers were adhered to clean glass cover slides and 2 mM DOPC + BODIPY1 micelles were deposited and incubated for 20 min as previously described [10]. Free lipid vesi-cles were rinsed away using 10 exchanges of PBS buffer (1 mL total volume) and then LPS was prepared and incubated with the bilayers for 20 min at RT, after which free LPS was rinsed away with 10 exchanges of buffer. A minimum of two replicates was obtained for each ser-ogroup of LPS. Negative and positive controls (LPS O111:B4 and buffer, respectively) were run in parallel to each experiment. FRAP and fluorescence imaging was used to determine the effect of the LPS groups on the fluidity and conformation of the bilayers. Data was optimized for contrast and brightness using ImageJ 1.48.
Data Processing
other cases, individual spectra replicates were integrated between the wavelengths of 550–850 nm, where the significant signal appears for detection with af647 and a long pass 647 nm filter, and then corrected for background noise levels. Integrated values were then averaged and used to calculate a s:n ratio. LoD were obtained by taking the average integrated NSB for all repli-cates in a set, determining the standard deviation (σ) of the replicates, adding 3σ, then
multi-plying by the sample concentration (μg/mL), and dividing by the integrated average specific
signal for that concentration (seeEq 1).
LoD¼ðNSBþ3sÞ½Sample
Specific ð1Þ
Statistical Analysis
Linear regression was used to relate the logarithm of the raw integrated intensities according to LPS concentration (LPSc), waveguide ID (wg#), power coupled (power), and type of measure-ment (background (mBG), non-specific (mNSB), specific, and specific (mSP)). Analysis of var-iance (ANOVA) was then used to determine the significance of the variables at the 5% level, (Table A inS1 File). Subsequently, to explain the observed heteroscedasticity, we regressed the absolute value of the residuals from the previous regression analysis onto the same set of explanatory variables (Table B inS1 File).
Model selection was performed using Akaike information criterion to determine the signifi-cance of the variables. Absolute values of the residuals of the means for LPSc, wg#, and power were processed with regression analysis (Table C inS1 File) using the type of measurement as a covariate.
Supporting Information
S1 Appendix. Integration algorithm for spectral data processing.Short algorithm used in IgorPro to individually integrate the raw spectral waves from an Ocean Optics Spectrometer. (PDF)
S1 Dataset. Integrated spectral values and data processing method.Excel spreadsheet which contains all the integrated values of the spectral curves and how those values were processed to obtain limits of detection and signal to noise ratios. Data was integrated using IgorPro 7 and algorithm available inS1 Appendix.
(XLSX)
S2 Dataset. Raw data of spectral curves.Excel spreadsheet that contains the spectra collected from a waveguide-based optical biosensor fitted with a USB 2000 Ocean Optics spectrometer. File contains 11 different tabs, and the replicates for each concentration or assay are contained within a single tab. Concentrations are clearly marked, and the waveguide number is written after each replicate number. E.g. N = 1/wg#.
(XLSX)
S1 Fig. Integrated intensities of O-ag targeted detection of LPS.Spectra fromFig 4were integrated and plotted to demonstrate the difference in values when using specific antibodies for detection. Error bars indicate standard error of the mean for the average of three replicates. (TIF)
S2 Fig. High concentration of LPS O157 in a flow cell.100μg/mL LPS O157 was incubated
S3 Fig. Lateral fluidity of bilayers after incubation with 100μg/mL LPS O157 inside a flow cell.(A) Time lapse series of DOPC-BODIPY bilayers that were photobleached and showed lateral fluidity during recovery. (B) Intensity profile graph of the overall average intensity and the recovery of the photobleached region. Incubating with LPS O157 does not cause hole for-mation or effect fluidity of the bilayers.
(TIF)
S4 Fig. Specific and non-specific binding of pAb O157-af647 inside a flow cell.(A) Com-posite 2 channel image of DOPC-BODIPY lipids and pAb O157-af647. White arrows indicate points of fluorescence intensity, and the white dotted line is the region of analysis graphed in D. Arrow 1 is a DOPC-BODIPY surface associated vesicle, and arrow 2 is specific binding of the reporter antibody. (B) Green channel of image A. (C) Red channel of image A. White arrows indicate points of non-specific binding. (D) Line intensity profile of dotted line in image A showing low non-specific binding and saturated intensity of the specific binding. Low NSB and high specific binding events allow for increased signal to noise ratios allowing sensi-tive detection of LPS membrane insertion.
(TIF)
S5 Fig. Effects of multiple serogroups of LPS on lipid bilayers.(A-I) 50μg/mL LPS O111:B4,
O26, O45, O103, O104, O111, O113, O121, and O145 respectively. (TIF)
S1 File. Statistical results and tables.Presents a brief overview of the results obtained from each ANOVA and the regression analysis of residuals.
(PDF)
Acknowledgments
The authors would like to thank several people who dedicated time towards helping with the ideas and development of this paper. Many thanks to Dr. Andrew Shreve, Dr. Peter Adams, Dr. Aaron Collins, Dr. Pearlson Prashanth, and Dr. Rama Sakamuri for method development, data analysis, imaging troubleshooting, and training. Additionally we would like to thank Mr. Aaron Anderson and Mr. Matthew Rush for their technical help and suggestions. Thank you to Dr. Zach Stromberg for re-purification of LPS O121. Thanks to Dr. Basil Swanson, Karen Grace and W. Kevin Grace, of LANL who developed the waveguide biosensor platform. Thanks to Drs. Swanson, Chaudhary, and Mukundan for conception, design, and testing of the membrane insertion assay. We also thank the STEC Center at Michigan State University, and Dr. John Luchansky for providing the STEC strains.
Author Contributions
Conceived and designed the experiments: LRS SWG GAM HM. Performed the experiments: LRS. Analyzed the data: LRS NWH KLS SWG GAM HM. Contributed reagents/materials/ analysis tools: RAM SWG GAM HM. Wrote the paper: LRS GAM HM. Statistical Analysis: NWH. Proofreading and Revisions: LRS KLS RAM SWG GAM HM.
References
1. Gyles CL. Shiga toxin-producingEscherichia coli: An overview. J Anim Sci. 2007; 85(13_suppl): E45– E62. doi:10.2527/jas.2006-508PMID:17085726
2. Aderem A, Ulevitch RJ. Toll-like receptors in the induction of the innate immune response. Nature. 2000; 406: 782–787. doi:10.1038/35021228PMID:10963608
3. Dobrovolskaia MA, Vogel SN. Toll receptors, CD14, and macrophage activation and deactivation by LPS. Microbes Infect. 2002; 4(9): 903–914. doi:10.1016/S1286-4579(02)01613-1PMID:12106783 4. Nikaido H, Vaara M. Molecular basis of bacterial outer membrane permeability. Microbiol Rev. 1985; 49
(1): 1–32. PMC373015. PMID:2580220
5. Takeda K, Akira S. Toll-like receptors in innate immunity. Int Immunol. 2005; 17(1): 1–14. doi:10.1093/ intimm/dxh186PMID:15585605
6. Akira S, Hemmi H. Recognition of pathogen-associated molecular patterns by TLR family. Immunol Lett. 2003; 85(2): 85–95 PMID:12527213
7. Galloway SM, Raetz CR. A mutant ofEscherichia colidefective in the first step of endotoxin biosynthe-sis. J Biol Chem. 1990; 265(11): 6394–6402. PMID:2180947.
8. Meredith TC, Aggarwal P, Mamat U, Lindner B, Woodard RW. Redefining the requisite lipopolysaccha-ride structure inEscherichia coli. ACS Chem Biol. 2006; 1(1): 33–42. doi:10.1021/cb0500015PMID: 17163638
9. Raetz CRH, Guan Z, Ingram BO, Six DA, Song F, Wang K, et al. Discovery of new biosynthetic path-ways: the lipid A story. J Lipid Res. 2009; 50(Suppl): S103–8. doi:10.1194/jlr.r800060-jlr200PMID: 18974037
10. Adams PG, Lamoureux LR, Swingle KL, Mukundan H, Montaño G. Lipopolysaccharide-Induced Dynamic Lipid Membrane Reorganization: Tubules, Perforations, and Stacks. Biophys J. 2014; 106 (11): 2395–2407. doi:10.1016/j.bpj.2014.04.016PMID:24896118
11. Berczi I, Bertok L, Bereznai T. Comparative studies on the toxicity ofEscherichia coli lipopolysaccha-ride endotoxin in various animal species. Can J Micro. 1966; 12(5): 1070–1071. PMID:5339644. 12. Cohen J. The immunopathogenesis of sepsis. Nature. 2002; 420(6917): 885–891. PMID:12490963. 13. Levine DM, Parker TS, Donnelly TM. Walsh A, Rubin AL. In vivo protection against endotoxin by
plasma high density lipoprotein. Proc Natl Acad Sci 14. USA. 1993; 90(24): 12040–12044. PMID: 8265667.
14. Raetz CR. Bacterial endotoxins: extraordinary lipids that activate eucaryotic signal transduction. J Bac-teriol. 1993; 175(18): 5745. PMID:8376321.
15. Takada H, Kotani S. Structural requirements of lipid A for endotoxicity and other biological activities. Crit Rev Microbiol. 1989; 16(6): 477–523. PMID:2663021.
16. Erridge C, Bennett-Guerrero E, Poxton IR. Structure and function of lipopolysaccharides. Microbes Infect. 2002; 4(8): 837–851. PMID:12270731.
17. Aurell CA, Wistrom AO. Critical aggregation concentrations of gram-negative bacterial lipopolysaccha-rides (LPS). Biochem Biophys Res Commun. 1998; 253(1): 119–123. doi:10.1006/bbrc.1998.9773 PMID:9875230
18. Schumann RR, Leong SR, Flaggs GW, Gray PW, Wright SD, Mathison JC, et al. Structure and function of lipopolysaccharide binding protein. Science. 1990; 249(4975): 1429–1431. PMID:2402637. 19. Vreugdenhil AC, Snoek AM, van't Veer C, Greve JW, Buurman WA. LPS-binding protein circulates in
association with apoB-containing lipoproteins and enhances endotoxin-LDL/VLDL interaction. J Clin Invest. 2001; 107(2): 225–234. doi:10.1172/JCI10832PMID:11160139
20. Nikaido H. Molecular basis of bacterial outer membrane permeability revisited. Microbiol Mol Biol Rev. 2003; 67(4): 593–656. doi:10.1128/mmbr.67.4.593-656.2003PMID:14665678
22. Whitfield C. Biosynthesis of lipopolysaccharide O antigens. Trends Microbiol. 1995; 3(5): 178–185. PMID:7542987.
23. Nigou J, Gilleron M, Puzo G. Lipoarabinomannans: from structure to biosynthesis. Biochimie. 2003; 85 (1–2): 153–166. PMID:12765785.
24. Sutcliffe I. Lipoarabinomannans—structurally diverse and functionally enigmatic macroamphiphiles of mycobacteria and related actinomycetes. Tuberculosis (Edinb). 2005; 54(4): 205–6.
25. Samuel G, Hogbin JP, Wang L, Reeves PR. Relationships of theEscherichia coliO157, O111, and O555 O-antigen gene clusters with those of Salmonella enterica and Citrobacter Freundii, which express identical O antigens. 2004; 186(19): 6536–43.
26. Hurley JC. Endotoxemia: methods of detection and clinical correlates. Clin Microbiol Rev. 1995; 8: 268–292. PMID:7621402.
27. Su W, Ding X. Methods of Endotoxin Detection. J Lab Autom. 2015; 20: 354–364. doi:10.1177/ 2211068215572136PMID:25720597
28. Sada E, Aguilar D, Torres M. Herrera T. Detection of lipoarabinomannan as a diagnostic test for tuber-culosis. J Clin Microbiol. 1992; 30(9): 2415–2418. PMID:1401008.
29. Boehme C, Molokova E, Minja F, Geis S, Loscher T, Maboko L, et al. Detection of mycobacterial lipoar-abinomannan with an antigen-capture ELISA in unprocessed urine of Tanzanian patients with sus-pected tuberculosis. Trans R Soc Trop Med Hyg. 2005; 99(12) 893–900. PMID:16139316.
30. Takahashi K, Fukada M, Kawai M, Yokochi T. Detection of lipopolysaccharide (LPS) and identification of its serotype by an enzyme-linked immunosorbent assay (ELISA) using poly-L-lysine. J Immunol Methods. 1992; 153(1–2): 67–71. doi:10.1016/0022-1759(92)90306-ePMID:1517602
31. Gutsmann T, Müller M, Carroll SF. Dual role of lipopolysaccharide (LPS)-binding protein in neutraliza-tion of LPS and enhancement of LPS-induced activaneutraliza-tion of mononuclear cells. Infect Immun. 2001; 69 (11) 6942–6950. PMID:11598069
32. Karch H, Bielaszewska M, Bitzan M, Schmidt H. Epidemiology and diagnosis of Shiga toxin-producing Escherichia coliinfections. Diagn Microbiol Infect Dis. 1999; 34(3): 229–243. PMID:10403103. 33. Lamoureux L, Adams P, Banisadr A, Stromberg Z, Graves S, Montaño G, et al. An optical biosensor for
detection of pathogen biomarkers from Shiga toxin-producingEscherichia coliin ground beef samples. Proc SPIE Int Soc Opt Eng BiOS. 2015; 9310: 931004–931004. doi:10.1117/12.2079658
34. Šafařiková M,Šafařik I. Immunomagnetic separation ofEscherichia coliO26, O111 and O157 from veg-etables. Lett Appl Microbiol. 2001; 33(1): 36–39. PMID:11442812
35. Sowers EG, Wells JG, Strockbine NA. Evaluation of commercial latex reagents for identification of O157 and H7 antigens ofEscherichia coli. J Clin Microbiol. 1996; 34(5): 1286–1289. PMID:8727921. 36. Stromberg LR, Stromberg ZR, Banisadr A, Graves SW, Moxley RA, Mukundan H. Purification and
char-acterization of lipopolysaccharides from six strains of non-O157 Shiga toxin-producingEscherichia coli. J Microbiol Methods. 2015; 116: 1–7. doi:10.1016/j.mimet.2015.06.008PMID:26093258
37. Brooks BW, Devenish J, Lutze-Wallace CL, Milnes D, Robertson RH, Berlie-Surujballi G. Evaluation of a monoclonal antibody-based enzyme-linked immunosorbent assay for detection ofCampylobacter fetusin bovine preputial washing and vaginal mucus samples. Vet Microbiol. 2004; 103(1–2): 77–84. PMID:15381269.
38. Hegde NV, Cote R, Jayarao BM, Muldoon M, Lindpaintner K, Kapur V, et al. Detection of the top six non-O157 Shiga toxin—producingEscherichia coliO groups by ELISA. Foodborne Pathog Dis. 2012; 9 (11): 1044–1048. doi:10.1089/fpd.2012.1231PMID:23134286
39. Mohammed AH, McCallus DE, Norcross NL. Development and evaluation of an enzyme-linked immu-nosorbent assay for endotoxin in milk. Vet Microbiol. 1988; 18(1): 27–39. PMID:3188375
40. Gall D, Nielsen K. Improvements to the competitive ELISA for detection of antibodies to Brucella abor-tus in cattle sera. J Immunoassay. 1994; 15(3): 277–291. PMID:7523456.
41. Alonso-Urmeneta B, Marin C, Aragón V, Blasco JM, Diaz R, Moriyón I. Evaluation of lipopolysaccha-rides and polysacchalipopolysaccha-rides of different epitopic structures in the indirect enzyme-linked immunosorbent assay for diagnosis of brucellosis in small ruminants and cattle. Clin Diagn Lab Immunol. 1998; 5(6): 749–754. PMID:9801329.
42. Bai J, Paddock ZD, Shi X, Li S, An B, Nagaraja T. Applicability of a multiplex PCR to detect the seven major Shiga toxin-producing Escherichia coli based on genes that code for serogroup-specific O-anti-gens and major virulence factors in cattle feces. Foodborne Pathog Dis. 2012; 9(6): 541–548. doi:10. 1089/fpd.2011.1082PMID:22568751
44. Son I, Binet R, Maounounen-Laasri A, Lin A, Hammack TS, Kase JA. Detection of five Shiga toxin-pro-ducing Escherichia coli genes with multiplex PCR. Food Microbiol. 2014; 40: 31–40. doi:10.1016/j.fm. 2013.11.016PMID:24549195
45. Fode-Vaughan KA, Maki JS, Benson JA, Collins MLP. Direct PCR detection ofEscherichia coliO157: H7. Lett Appl Microbiol. 2003; 37(3): 239–243. doi:10.1046/j.1472-765x.2003.01386.xPMID: 12904226
46. Alam JM, Yamazaki M. Spontaneous insertion of lipopolysaccharide into lipid membranes from aque-ous solution. Chem Phys Lipids. 2011; 164(2): 166–174. doi:10.1016/j.chemphyslip.2010.12.008 PMID:21195067
47. Mukundan H, Price DN, Goertz M, Parthasarathi R, Montaño GA, Kumar S, et al. Understanding the
interaction of Lipoarabinomannan with membrane mimetic architectures. Tuberculosis (Edinb). 2012; 92(1): 38–47. doi:10.1016/j.tube.2011.09.006
48. Sakamuri RM, Wolfenden MS, Anderson AS, Swanson B, Schmidt J, Mukundan H. Novel optical strate-gies for biodetection. Proc SPIE Int Soc Opt Eng NanoScience 2013; 8812: 881209-8812-09. doi:10. 1117/12.2029605
49. Wurfel MM, Kunitake ST, Lichenstein H, Kane JP, Wright SD. Lipopolysaccharide (LPS)-binding pro-tein is carried on lipopropro-teins and acts as a cofactor in the neutralization of LPS. J Exp Med. 1994; 180 (3): 1025–1035. doi:10.1084/jem.180.3.1025PMID:8064223
50. Wurfel MM, Wright SD. Lipopolysaccharide-binding protein and soluble CD14 transfer lipopolysaccha-ride to phospholipid bilayers: preferential interaction with particular classes of lipid. J Immunol. 1997; 158(8): 3925–3934. PMID:9103463.
51. Sakamuri RM, Capek P, Dickerson TJ, Barry CE, Mukundan H, Swanson B. Detection of stealthy small amphiphilic biomarkers. J Microbiol Methods. 2014; 103: 112–117. doi:10.1016/j.mimet.2014.05.012 PMID:24880131
52. Mukundan H, Kumar S, Price DN, Ray SM, Lee YJ, Min S, et al. Rapid detection ofMycobacterium tuberculosisbiomarkers in a sandwich immunoassay format using a waveguide-based optical biosen-sor. Tuberculosis (Edinb). 2012; 92: 407–416. doi:10.1016/j.tube.2012.05.009
53. Sakamuri RM, Price DN, Lee M, Cho SN, Barry CE 3rd, Via L, et al. Association of lipoarabinomannan with high density lipoprotein in blood: Implications for diagnostics. Tuberculosis (Edinb). 2013; 93(3): 301–307. doi:10.1016/j.tube.2013.02.015
54. Mukundan H, Kubicek JZ, Holt A, Shively JE, Martinez JS, Grace K, et al. Planar optical waveguide-based biosensor for the quantitative detection of tumor markers. Sens Actuators B Chem. 2009; 138 (2): 453–460. doi:10.1016/j.snb.2009.01.073
55. Mukundan H, Xie H, Anderson AS, Grace WK, Shively JE, Swanson B. Optimizing a waveguide-based sandwich immunoassay for tumor biomarkers: evaluating fluorescent labels and functional surfaces. Bioconjug Chem. 2009; 20(2): 222–230. doi:10.1021/bc800283ePMID:19173652
56. Kale RR, Mukundan H, Price DN, Harris JF, Lewallen DM, Swanson B, et al. Detection of Intact Influ-enza Viruses using Biotinylated Biantennary S-Sialosides. J Am Chem Soc. 2008; 130(26): 8169– 8171. doi:10.1021/ja800842vPMID:18529007
57. Martinez JS, Grace WK, Grace KM, Hartman N, Swanson BI. Pathogen detection using single mode planar optical waveguides. J Mater Chem. 2005; 15: 4639–4647. doi:10.1039/b502329g
58. Mukundan H, Anderson AS, Grace WK, Grace KM, Hartman N, Martinez J, et al. Waveguide-Based Biosensors for Pathogen Detection. Sensors (Basel). 2009; 9(7): 5783–5809. doi:10.3390/s90705783 59. McIntosh TJ. Short-range interactions between lipid bilayers measured by X-ray diffraction. Curr Opin
Struct Biol. 2000; 10(4): 481–485. doi:10.1016/S0959-440X(00)00118-4PMID:10981639
60. Bergstrand A, Svanberg C, Langton M, Nydén M. Aggregation behavior and size of lipopolysaccharide fromEscherichia coliO55:B5. Colloids Surf B Biointerfaces. 2006; 53(1): 9–14. doi:10.1016/j.colsurfb. 2006.06.007PMID:16934960
61. Santos NC, Silva AC, Castanho MA, Martins-Silva J, Saldanha C. Evaluation of lipopolysaccharide aggregation by light scattering spectroscopy. ChemBioChem. 2003; 4(1): 96–100 doi:10.1002/cbic. 200390020PMID:12512082
62. Din ZZ, Mukerjee P, Kastowsky M, Takayama K. Effect of pH on solubility and ionic state of lipopolysac-charide obtained from the deep rough mutant ofEscherichia coli. Biochemistry. 1993; 32(17): 4579– 4586. PMID:8485134.
63. Shnyra A, Hultenby K, Lindberg AA. Role of the physical state of Salmonella lipopolysaccharide in expression of biological and endotoxic properties. Infect Immun. 1993; 61(12): 5351–5360. PMID: 8225609.
65. Ruckenstein E, Nagarajan R. Critical micelle concentration. Transition point for micellar size distribu-tion. J Phys Chem. 1975; 79(24): 2622–2626. doi:10.1021/j100591a010
66. Nowotny A. Heterogeneity of endotoxins. Handbook of endotoxin; 1984; 1: 308–338.
67. Jucker BA, Harms H, Zehnder A. Polymer interactions between five gram-negative bacteria and glass investigated using LPS micelles and vesicles as model systems. Colloids Surf B Biointerfaces. 1998; 11(1): 33–45. doi:10.1016/S0927-7765(98)00029-0
68. Petsch D, Anspach FB. Endotoxin removal from protein solutions. J Biotechnol. 2000; 76(2–3): 97– 119. PMID:10656326.
69. Seydel U, Schromm AB, Blunck R, Brandenburg K. Chemical structure, molecular conformation, and bioactivity of endotoxins. Chem Immunol. 2000; 74: 5–24. PMID:10608079.
70. Schromm AB, Brandenburg K, Loppnow H, Moran AP, Koch MH, Rietschel ET, et al. Biological activi-ties of lipopolysaccharides are determined by the shape of their lipid A portion. Eur J Biochem. 2000; 267(7): 2008–2013. doi:10.1046/j.1432-1327.2000.01204.xPMID:10727940
71. Moroi Y. CMC range due to polydispersity of micelles. J Colloid Interface Sci. 1991; 141(2): 581–583. doi:10.1016/0021-9797(91)90355-C
72. Borovikova LV, Ivanova S, Zhang M, Yang H. Botchkina GI, Watkins LR, et al. Vagus nerve stimulation attenuates the systemic inflammatory response to endotoxin. Nature. 2000; 405(6785): 458–462. doi: 10.1038/35013070PMID:10839541
73. Reinhold RB, Fine J. A technique for quantitative measurement of endotoxin in human plasma. Proc Soc Exp Biol Med. 1971; 137(1): 334–340. PMID:4932052.
74. Sharma SK. Endotoxin detection and elimination in biotechnology. Biotechnol Appl biochem. 1986; 8 (1): 5–22. PMID:3548752.
75. Jay JM, Margitic S, Shereda AL, Covington HV. Determining endotoxin content of ground beef by the Limulus amoebocyte lysate test as a rapid indicator of microbial quality. J Appl Environ Microbiol. 1979; 38: 885–890. PMID:396886.
76. Jay JM. Rapid estimation of microbial numbers in fresh ground beef by use of the Limulus test. J Food Prot. 1981; 44(4): 275–278.
77. Harrison M, Moyna NM, Zderic TW, O'Gorman DJ, McCaffrey N, Carson BP, et al. Lipoprotein particle distribution and skeletal muscle lipoprotein lipase activity after acute exercise. Lipids Health Dis. 2012; 11: 64. doi:10.1186/1476-511X-11-64PMID:22672707
78. Viktorov AV, Yurkiv VA. Binding of lipopolysaccharide and complexes of lipopolysaccharide to serum low density lipoproteins to liver macrophages. Biomed Khim. 2007: 52(1): 36–43. doi:10.1134/ s1990750807010052
79. Chien JY, Jerng JS, Yu CJ, Yang PC. Low serum level of high-density lipoprotein cholesterol is a poor prognostic factor for severe sepsis. Crit Care Med. 2005; 33(8): 1688–1693. doi:10.1097/01.CCM. 0000171183.79525.6BPMID:16096442
80. Rangin M, Basu A. Lipopolysaccharide Identification with Functionalized Polydiacetylene Liposome Sensors. J Am Chem Soc. 2004; 126: 5038–5039. doi:10.1021/ja039822xPMID:15099065 81. Rangin M, Basu A. Supporting Information For: Lipopolysaccharide identification with functionalized
polydiacetylene liposome sensors. J Am Chem Soc. 2004; 126: S1–S9. doi/suppl/10.1021/ja039822x. 82. Nieradka K, Kapczyńska K, Rybka J, Lipiński T, Grabiec P, Skowicki M, et al. Microcantilever array
bio-sensors for detection and recognition of Gram-negative bacterial endotoxins. Sensors and Actuators B: Chemical. Elsevier B.V; 2014; 198: 114–124. doi:10.1016/j.snb.2014.03.023
83. Redl H, Bahrami S, Schlag G, Traber DL. Clinical detection of LPS and animal models of endotoxemia. Immunobiology. 1993; 187(3–5): 330–345. doi:10.1016/S0171-2985(11)80348-7PMID:8330902 84. Adams PG, Swingle KL, Paxton WF, Nogan JJ, Stromberg LR, Firestone MA, et al. Exploiting
lipopoly-saccharide-induced deformation of lipid bilayers to modify membrane composition and generate two-dimensional geometric membrane array patterns. Sci Rep. 2015; 5: 10331. doi:10.1038/srep10331 PMID:26015293
85. Whitfield C. Biosynthesis and Assembly of Capsular Polysaccharides inEscherichia coli. Annu Rev Biochem. 2006; 75: 39–68. doi:10.1146/annurev.biochem.75.103004.142545PMID:16756484 86. Mukundan H, Xie H, Price D, Kubicek-Sutherland JZ, Grace WK, Anderson AS, et al. Quantitative
multi-plex detection of pathogen biomarkers on multichannel waveguides. Anal Chem. 2010; 82(1): 136– 144. doi:10.1021/ac901497gPMID:20000585