AMTD
8, 5895–5936, 2015Relative absorption strengths of water vapour absorption
J. Lampel et al.
Title Page
Abstract Introduction
Conclusions References
Tables Figures
◭ ◮
◭ ◮
Back Close
Full Screen / Esc
Printer-friendly Version Interactive Discussion
Discussion
P
a
per
|
Discussion
P
a
per
|
Discussion
P
a
per
|
Discussion
P
a
per
|
Atmos. Meas. Tech. Discuss., 8, 5895–5936, 2015 www.atmos-meas-tech-discuss.net/8/5895/2015/ doi:10.5194/amtd-8-5895-2015
© Author(s) 2015. CC Attribution 3.0 License.
This discussion paper is/has been under review for the journal Atmospheric Measurement Techniques (AMT). Please refer to the corresponding final paper in AMT if available.
On the relative absorption strengths of
water vapour in the blue
wavelength range
J. Lampel1,a, D. Pöhler1, J. Tschritter1, U. Frieß1, and U. Platt1
1
Institute of Environmental Physics, University of Heidelberg, Heidelberg, Germany a
now at: Max Planck Institute for Chemistry, Mainz, Germany
Received: 19 April 2015 – Accepted: 22 May 2015 – Published: 16 June 2015
Correspondence to: J. Lampel ([email protected])
AMTD
8, 5895–5936, 2015Relative absorption strengths of water vapour absorption
J. Lampel et al.
Title Page
Abstract Introduction
Conclusions References
Tables Figures
◭ ◮
◭ ◮
Back Close
Full Screen / Esc
Printer-friendly Version Interactive Discussion
Discussion
P
a
per
|
Discussion
P
a
per
|
Discussion
P
a
per
|
Discussion
P
a
per
|
Abstract
In recent updates of the HITRAN water vapour H2O spectroscopic compilation
cover-ing the blue spectral region (here: 394–480 nm) significant changes for the absorption bands at 416 and 426 nm were reported. In order to investigate the consistency of the different cross-sections calculated from these compilations, H2O vapour column
den-5
sity ratios for different spectral intervals were retrieved from Long-path and Multi-Axis – Differential Optical Absorption Spectroscopy (DOAS) measurements. We observed a significant improvement of the DOAS evaluation when using the updated HITRAN water vapour absorption cross-sections for the calculation of the reference spectra. In particular the magnitudes of the residual spectra as well as the fit errors were reduced.
10
However we also found that the best match between measurement and model is reached when the absorption cross-section of groups of lines are scaled by factors ranging from 0.5 and 1.9, suggesting that the HITRAN water vapour absorption compi-lation still needs significant corrections. For this spectral region we present correction factors for HITRAN 2009, HITRAN 2012, HITEMP and BT2 derived from field
mea-15
surements. Additionally, upper limits for water vapour absorption in the UV-A range from 330–390 nm are given.
1 Introduction
Precise knowledge of the atmospheric water vapour absorption is not only crucial to calculate Earth’s radiation budget since water vapour is the largest contributor to
20
the natural greenhouse effect (Myhre et al., 2013), but water vapour absorptions also needs to be known at high precision when retrieving other atmospheric absorbers from spectroscopic measurements in the UV/VIS wavelength range. If their absorptions overlap, this can lead to errors in measurements of several trace-gases. Due to tech-nical limitations and since the absorption cross-sections are small in the region below
25
experimen-AMTD
8, 5895–5936, 2015Relative absorption strengths of water vapour absorption
J. Lampel et al.
Title Page
Abstract Introduction
Conclusions References
Tables Figures
◭ ◮
◭ ◮
Back Close
Full Screen / Esc
Printer-friendly Version Interactive Discussion
Discussion
P
a
per
|
Discussion
P
a
per
|
Discussion
P
a
per
|
Discussion
P
a
per
|
tal data is sparse. Numerous absorption lines in the blue spectral region included in absorption line databases like HITRAN 2009 (Rothman et al., 2009), HITRAN 2012 (Rothman et al., 2013) and HITEMP (Rothman et al., 2010) are therefore based on the-oretical calculations only. According to Tennyson et al. (2013) and references therein, validation measurements of individual water absorption lines are only available at
wave-5
lengths longer than 395.7 nm (25 337 cm−1), but a large fraction of the absorption lines included in the databases in this region is not validated by measurements.
More recently water vapour absorption was also observed (Maksyutenko et al., 2012) and modeled (Polyansky et al., 2012) in the UV range below 370 nm. The HITEMP absorption line database for H2O (Rothman et al., 2010) relies to a large extend on
10
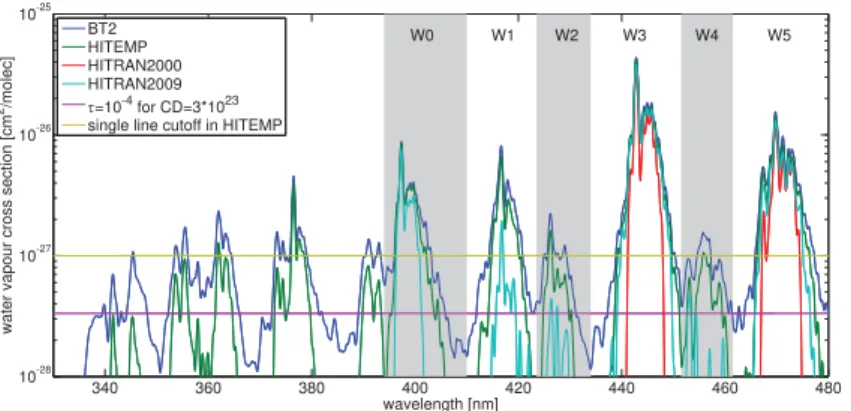
theab initio line list BT2 calculated by Barber et al. (2006). An overview of the cross-sections from HITRAN 2009, HITEMP and BT2 is shown in Fig. 1. Convoluted to a representative resolution of 0.5 nm, the differences between the HITRAN 2012 cross-section and the HITEMP cross-cross-section are negligible, therefore they are treated as equivalent here.
15
A widely used approach to measure trace gases in the atmosphere of the Earth is the technique of differential optical absorption spectroscopy (DOAS) (Platt and Stutz, 2008). Typically, absorption spectra covering 100–200 nm sections in the UV or visi-ble spectral range are recorded by a grating spectrometer at a spectral resolution of 0.3–1 nm. Suitable evaluation of differential absorption structures allows quantitatively
20
determining column densities and concentrations of numerous trace gas species, even if their spectral features overlap. This allows for simultaneous evaluation of several trace gases in the atmosphere at high temporal resolution.
Absorption path lengths for different DOAS setups range from several 100 m to sev-eral 10 km in the free troposphere. Optical densities (OD) can be often be resolved
25
down to 1×10⁻⁴(e.g. Platt and Stutz, 2008; Coburn et al., 2011), which in turn means
that water absorption lines can be observed up to an accuracy of 5×10⁻²⁸cm2molec−1
AMTD
8, 5895–5936, 2015Relative absorption strengths of water vapour absorption
J. Lampel et al.
Title Page
Abstract Introduction
Conclusions References
Tables Figures
◭ ◮
◭ ◮
Back Close
Full Screen / Esc
Printer-friendly Version Interactive Discussion
Discussion
P
a
per
|
Discussion
P
a
per
|
Discussion
P
a
per
|
Discussion
P
a
per
|
While absorption structures due to known absorbers can be readily disentangled, problems can arise from unknown spectral features. One example – as mentioned above – are the uncertainties of the weak absorption features of water vapour in the blue spectral region.
Frequently the actual water vapour content during the measurements is not of
pri-5
mary interest, but nevertheless water needs to be corrected for when evaluating the absorption spectra. For example, weak water absorptions can be found in the typical evaluation range of iodine monoxide (ca. 414–440 nm). Iodine oxide (IO) is playing a role in atmospheric chemistry and creation of cloud condensation nuclei. Elevated IO levels can be found in coastal areas (e.g. Seitz et al., 2010) as well as on the open
10
ocean (e.g. Read et al., 2008; Großmann et al., 2013), the free troposphere (e.g. Dix et al., 2013) and polar regions (e.g. Frieß et al., 2010; Schönhardt et al., 2012). For a typical tropospheric water vapour slant column density (SCD) found in moderate cli-mate of SH2O=4×10
23
molec cm−2 the resulting optical density is 2.5×10⁻³ (when
taking the cross-section data from HITEMP) at a spectral resolution of 0.5 nm . Optical
15
densities due to IO in the tropical marine boundary layer are five times weaker, i.e. of the order of 4×10⁻⁴, thus to avoid possible errors in the retrieval of IO due to
incom-plete correction of the water vapour absorption, precise knowledge of the water vapour absorption cross-section is essential. Older versions of HITRAN such as HITRAN 2000 did not even include any absorptions in this spectral range.
20
Even more important is the correction of water vapour absorptions for the retrieval of glyoxal (e.g. Sinreich et al., 2010; Mahajan et al., 2014, and references therein), which can be evaluated in the spectral range from 432–458 nm. For a typical tropo-spheric water vapour SCD ofSH2O=4×10
23
molec cm−2
the resulting OD is 1.7×10⁻²
in this wavelength range at a spectral resolution of 0.5 nm, while the typical
gly-25
oxal dSCD as reported by Sinreich et al. (2010) for the marine boundary layer of 1.5×10¹⁵molec cm−2 correspond to 8×10⁻⁴ and thus is ten times weaker than the
AMTD
8, 5895–5936, 2015Relative absorption strengths of water vapour absorption
J. Lampel et al.
Title Page
Abstract Introduction
Conclusions References
Tables Figures
◭ ◮
◭ ◮
Back Close
Full Screen / Esc
Printer-friendly Version Interactive Discussion
Discussion
P
a
per
|
Discussion
P
a
per
|
Discussion
P
a
per
|
Discussion
P
a
per
|
and/or increasing the measurement error. At the spectral region of maximum absorp-tion of glyoxal the difference between the water vapour absorption cross-sections found in HITRAN 2000 and HITEMP for a typicalSH2O=4×10
23
molec cm−2is about 4×10⁻⁴
and amounts to one half of the reported glyoxal absorption.
Water vapour absorption can also have an impact on the spectral retrieval of the
5
oxygen dimer O4 (also called O2–O2) around 477 nm. Its column densities can be
used to constrain radiative transfer simulations in remote sensing application and to obtain height profile information of aerosol extinction and trace gas concentrations (e.g. Frieß et al., 2006).
Water vapour column densities have been measured in the blue wavelength range
10
from satellite (Wagner et al., 2013b; Wang et al., 2014) as well as from ground-based instruments (Wagner et al., 2013a). Here the 7νabsorption at 442 nm from HI-TRAN 2004 has been used for retrieving the atmospheric water vapour column density. These measurements require precise water vapour absorption cross-sections as well to minimize retrieval errors.
15
If significant absorptions of water vapour are present below 370 nm, these could have an effect on the spectral evaluation of measurements of e.g. BrO, Formaldehyde, HONO, SO2 and O4. Based on currently available cross-section data no atmospheric
water vapour absorptions in this spectral range have been reported for DOAS mea-surements so far.
20
2 Measurement campaigns
The data which was analysed here were collected during two field campaigns, where different instruments were used.
1. During the SOPRAN cruise M91 with the research vessel “Meteor” Multi-Axis (MAX-)DOAS data was collected in the Peruvian upwelling region in December
25
AMTD
8, 5895–5936, 2015Relative absorption strengths of water vapour absorption
J. Lampel et al.
Title Page
Abstract Introduction
Conclusions References
Tables Figures
◭ ◮
◭ ◮
Back Close
Full Screen / Esc
Printer-friendly Version Interactive Discussion
Discussion
P
a
per
|
Discussion
P
a
per
|
Discussion
P
a
per
|
Discussion
P
a
per
|
2. Longpath (LP)-DOAS Measurements were analysed for water vapour using data from the intensive campaign called “HaloCaVe” at the Cape Verde Atmospheric Observatory (CVAO, Carpenter et al., 2010) during summer and fall 2010.
The sites of both campaigns were located far away from any strong anthropogenic pollution, thus interferences due to e.g. high NO2mixing ratios on the data evaluation
5
should be negligible.
3 The DOAS method
The DOAS method (Platt and Stutz, 2008) relies on attenuation of light from suitable light sources by absorbers within the lightpath according to Lambert-Beer’s lawI(λ)=
I0(λ) exp(−τ(λ)).
10
The optical densityτ(λ) is calculated from a reference spectrumI0(λ) and a
measure-ment spectrum I(λ), τ(λ)=−ln I(λ)
I0(λ). In order to remove broad-band Mie and Rayleigh
extinction, the OD is subdivided in a narrow-band (differential) and a broad-band part,
τ(λ)=τB(λ)+τd(λ).τd(λ) is expressed by a sum of the differential parts of possible
ab-sorbers with their differential absorption cross-sectionsσd,i(λ) and concentrationsci of
15
absorber (i.e. trace gas)i.
τd(λ)=L
X
i
ciσd,i(λ) (1)
The column densitySi =L×ci of the trace-gas i (with the concentration ci) is
cal-culated by a fitting routine, which is applied to data from a wavelength interval with a width of several nm to several 10 nm. The absorption path L is known for LP-DOAS
20
AMTD
8, 5895–5936, 2015Relative absorption strengths of water vapour absorption
J. Lampel et al.
Title Page
Abstract Introduction
Conclusions References
Tables Figures
◭ ◮
◭ ◮
Back Close
Full Screen / Esc
Printer-friendly Version Interactive Discussion
Discussion
P
a
per
|
Discussion
P
a
per
|
Discussion
P
a
per
|
Discussion
P
a
per
|
absorption cross-section as it would be determined by the instrument. In an analogous fashion to the optical density, also cross-sections can be subdivided into a broadband and narrow-band (differential) contribution: σi =σB,i+σd,i. The instrument function H is usually measured by observing individual atomic emission lines of mercury, which have a width which is two orders of magnitude smaller than the resolution of the
instru-5
ment (Sansonetti et al., 1996). Corrections to this simple convolution procedure are discussed in Sect. 4.3.
3.1 MAX-DOAS measurements
The method of Multi-Axis DOAS (MAX-DOAS) measurements was first described by Hönninger and Platt (2002) and uses scattered sunlight collected by a telescope
point-10
ing towards the sky at different elevation angles. Each elevation has a different sensi-tivity for absorptions in different heights of the atmosphere. Low elevation angles have a higher sensitivity to absorbers close to the surface, because the additional lightpath compared to a zenith spectrum is mostly located within the lowermost layers of the atmosphere (Hönninger et al., 2004).
15
The SCD is defined as the integral over the concentration ρ along the lightpath L
and is hence given in units of molecules cm−2.
S=
Z
L
ρ(s)ds (2)
From the MAX-DOAS measurements differential slant column densities (dSCDs)∆S
can be calculated for each fitted trace gas: a Fraunhofer reference spectrum I0(λ) is
20
chosen from one of the measurement spectra and the dSCD∆S(α)=S(α)−Srefis
ob-tained from the DOAS fit for each elevation angleαrelative to the Fraunhofer reference. Typically, a zenith spectrum is taken as reference and thus Sref=S(90
◦
AMTD
8, 5895–5936, 2015Relative absorption strengths of water vapour absorption
J. Lampel et al.
Title Page
Abstract Introduction
Conclusions References
Tables Figures
◭ ◮
◭ ◮
Back Close
Full Screen / Esc
Printer-friendly Version Interactive Discussion
Discussion
P
a
per
|
Discussion
P
a
per
|
Discussion
P
a
per
|
Discussion
P
a
per
|
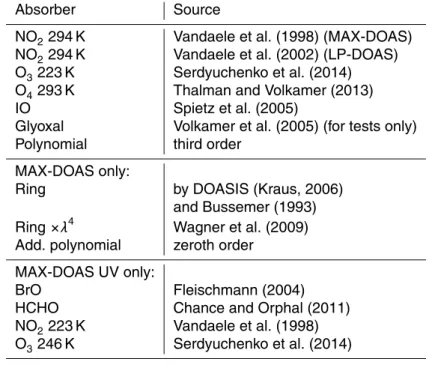
Table 3. In addition Ring Spectra are fitted (see Table 3), which serve to compensate for the effect of rotational Raman scattering. The influence of vibrational Raman scat-tering of N2and O2as described in Lampel et al. (2015) on the obtained results listed
in Table 5 was not found to be significant. By choosing references recorded shortly be-fore or after the measurement spectrum the influence of the instrumental instabilities
5
on the result was minimized as well as the influence of stratospheric absorbers largely cancel out (see e.g. Hönninger and Platt, 2002).
A description of the instrument operated during the SOPRAN cruise M91 can be found in Großmann et al. (2013). The optical resolution of the instrument during this campaign was 0.45 nm and it covered a spectral range from 324 to 467 nm.
10
3.2 LP-DOAS Measurements
Longpath(LP)-DOAS instruments are based on an artificial light source, typically a xenon lamp or a light-emitting diode (LED), retro reflectors, a telescope and a spec-trometer. The light is sent with a telescope across the measurement distance to a retro reflector, which reflects the light back onto the same telescope. It collects the
15
received light and transfers it to a spectrograph. A sequence of background ments, light-source spectrum measurements without absorption and actual measure-ment spectra is used to ensure independence of the measured spectra from external sunlight and instrumental instabilities. The LP-DOAS setup has the advantage that the actual light path is well-defined and thus concentrations of molecules can be directly
20
derived, also measurements at night are possible.
The optical densityτ(λ) is calculated from a background corrected light source spec-trum and a background corrected atmospheric specspec-trum and filtered by a binomial high-pass with 1000 iterations. The convoluted and high-pass filtered literature cross-sections listed in Table 3 are then fitted to the corrected OD.
25
AMTD
8, 5895–5936, 2015Relative absorption strengths of water vapour absorption
J. Lampel et al.
Title Page
Abstract Introduction
Conclusions References
Tables Figures
◭ ◮
◭ ◮
Back Close
Full Screen / Esc
Printer-friendly Version Interactive Discussion
Discussion
P
a
per
|
Discussion
P
a
per
|
Discussion
P
a
per
|
Discussion
P
a
per
|
To exclude the possibility of interferences with daylight, only spectra at a solar zenith angle of more than 90◦(night-time) are reported here.
3.3 Spectral retrieval
The H2O cross-sections were calculated using modeled line widths according to Kuntz
(1997) from the respective compilation or line list using an extraction program by
Chris-5
tian Frankenberg (Frankenberg, 2005) with a spectral resolution of 1 pm for an ambient temperature of 298 K and 1013 hPa.1. For the BT2 dataset, a cross-section file from the exomol project (Tennyson and Yurchenko, 2012)2was downloaded, here only Doppler line broadening effects were considered (Hill et al., 2013). Variations of temperature and pressure within the range of atmospheric measurements were found not to have
10
a significant effect on our measurements in the blue wavelength region and the bulk of the absorption by water vapour molecules takes place within the boundary layer.
The choice of cross-section to compensate for absorption of the oxygen dimer O4
did not significantly affect the overall result. We tested cross-sections from Hermans et al. (1999), Thalman and Volkamer (2013) and Greenblatt et al. (1990).
15
The spectral window of this study for MAX-DOAS measurements was limited at the lower end to 398 nm to avoid a strong influence of the Ring effect caused by rota-tional Raman scattering (Shefov, 1959; Grainger and Ring, 1962). The upper bound (at 461.5 nm) was chosen due to instrumental limitations.
The water vapour absorption cross-section was divided into six spectral regions W0–
20
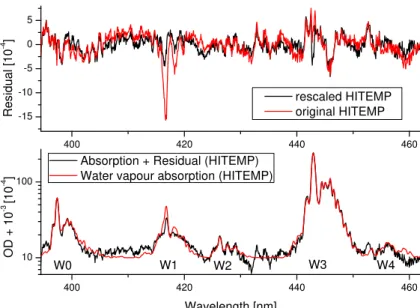
W5 before convolution, as listed in Table 1. All other absorbers (Table 3) were fitted normally. An example fit can be seen in Fig. 2.
1
The HITRAN 2009, HITEMP and HITRAN 2012 data used here was downloaded from the HITRAN website (http://www.cfa.harvard.edu/hitran/) with the file name “01 hit09.par”, HITEMP “01 hitemp.par” and HITRAN 2012 “01 hit12.par”
2
AMTD
8, 5895–5936, 2015Relative absorption strengths of water vapour absorption
J. Lampel et al.
Title Page
Abstract Introduction
Conclusions References
Tables Figures
◭ ◮
◭ ◮
Back Close
Full Screen / Esc
Printer-friendly Version Interactive Discussion
Discussion
P
a
per
|
Discussion
P
a
per
|
Discussion
P
a
per
|
Discussion
P
a
per
|
To avoid problems in situations with low light intensity, we used only data where the signal was sufficiently high to provide a RMS noise of the residual spectrum below 4×10⁻⁴.
3.3.1 Radiative Transfer effects (MAX-DOAS)
The lightpath of the LP-DOAS measurement is well defined and constant. Thus
mea-5
surements of the different W0–W5 column densities can be directly used. However, the effective lightpath of MAX-DOAS measurements is not known and depends on several factors: wavelength, aerosol and trace gas profiles, viewing direction, position of the Sun etc.
The radiative transfer for the measurements was simulated using McArtim
10
(Deutschmann et al., 2011). Water vapour dSCDs in the atmosphere were simulated at different wavelengths to estimate the effect of radiative transfer on the relative observed absorption band strengths for MAX-DOAS measurements. Since the data was taken from a measurement period of a whole month, a representative water vapour profile (surface mixing ratio of 2.3 %, linearly decreasing to 0 % at a height of 6 km, similarly
15
as in Bleisch and Kampfer, 2012) and an exponentially decreasing aerosol profile with an AOT of 0.22 at 360 nm were used for the simulations. The results were averaged over a range of solar zenith angles (SZA) of 10–80◦representing the used MAX-DOAS data and over all encountered relative solar azimuth angles.
The magnitude of the resulting water vapour dSCD obtained from the model agreed
20
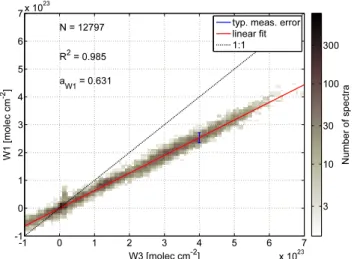
with the MAX-DOAS observations. McArtim allows calculating the wavelength depen-dence of the simulated water vapour dSCDs. The scatter in the correlations for the water absorption bands (Fig. 3) will then already include the scatter caused by dif-ferent measuring geometries, which means that the observed differences in relative strengths of the absorptions especially for W1 and W2 are significant. However, the
25
AMTD
8, 5895–5936, 2015Relative absorption strengths of water vapour absorption
J. Lampel et al.
Title Page
Abstract Introduction
Conclusions References
Tables Figures
◭ ◮
◭ ◮
Back Close
Full Screen / Esc
Printer-friendly Version Interactive Discussion
Discussion
P
a
per
|
Discussion
P
a
per
|
Discussion
P
a
per
|
Discussion
P
a
per
|
measurements e.g. for W0 when using HITEMP and BT2. The wavelength corrected results are listed in Table 5.
It is a well known effect (see e.g. Platt et al., 1997) that strong absorbers influence the light path length in the atmosphere and thus the airmass factor. The change of the air mass factor within a water vapour absorption band due to the highly resolved
5
water vapour optical density in the region<480 nm was found to be insignificant. De-viations of less than 2 % on the values listed in Table 5 were observed. The effect may, nevertheless, play a role for stronger absorbers.
However, if the focus is on weak absorbers being overlayed by strong water vapour absorptions, a correction for the change of airmass factors by strong absorption is
10
necessary to avoid water vapour OD correlated structures in the residual spectra and effects on the retrieval of other absorbers.
4 Results
The water vapour dSCDs derived in different spectral regions of the same measured spectra were compared to each other. In principle the same water vapour dSCD values
15
are expected, but significant differences were found.
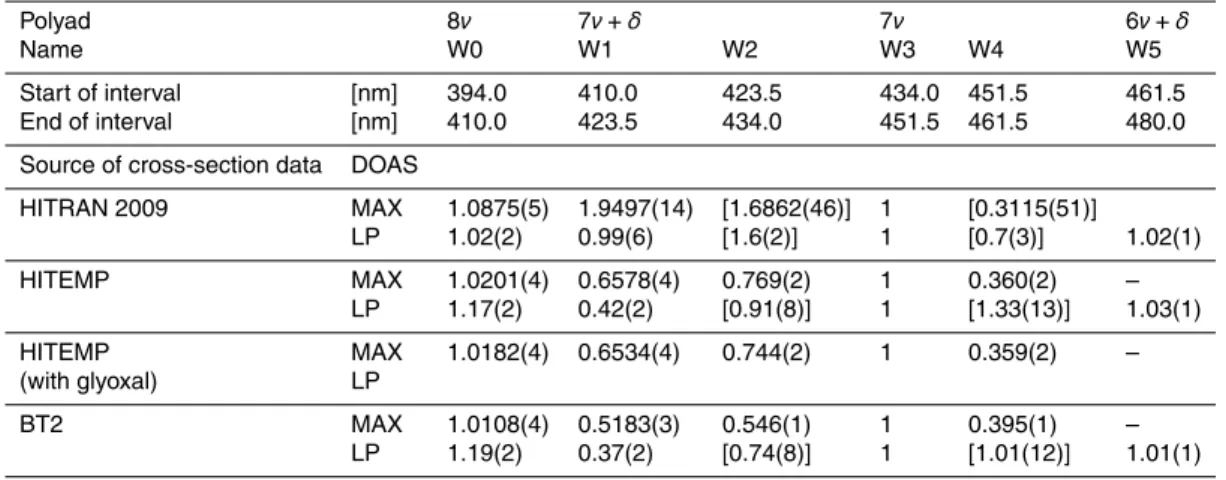
Values of the retrieved water vapour SCDs in different spectral intervals were com-pared to each other. Relative to the SCD of W3SW3, an error weighted linear regression
was done to obtainax inf(Sx)=ax×SW3.ax is the relative absorption strength of the
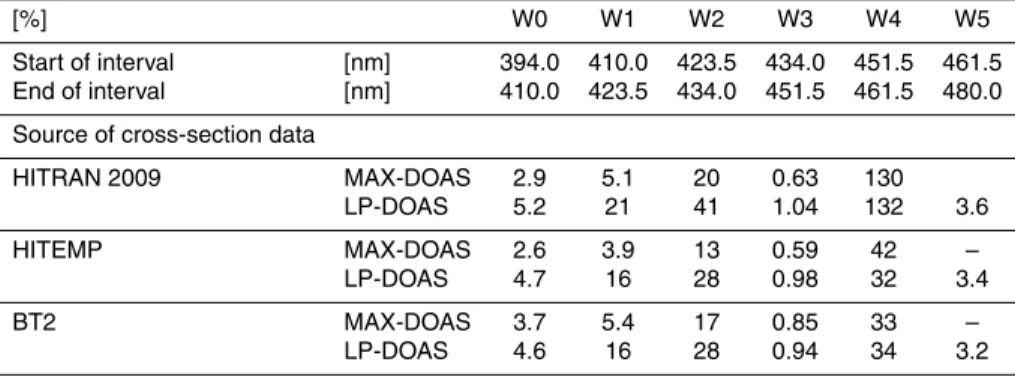
intervalx relative to W3. The results are shown in Table 5. Typical DOAS fit errors for
20
each cross-section in W0–W5 for individual measurements are summarized in Table 6. In order to illustrate the differences one of the data comparison plots with the relative absorption of W1 and W3 for HITEMP is shown in Fig. 3.
The weights for the linear regression were iteratively calculated according to Neri et al. (1989). A comparison with other methods for error-weighted linear regressions
25
AMTD
8, 5895–5936, 2015Relative absorption strengths of water vapour absorption
J. Lampel et al.
Title Page
Abstract Introduction
Conclusions References
Tables Figures
◭ ◮
◭ ◮
Back Close
Full Screen / Esc
Printer-friendly Version Interactive Discussion
Discussion
P
a
per
|
Discussion
P
a
per
|
Discussion
P
a
per
|
Discussion
P
a
per
|
The water vapour absorption of the 7ν polyad (W3) at ≈444 nm was used as a
reference for the other polyads, because it is the strongest absorption in this spectral region (see Table 1).
The mathematical error from the regression is small compared to possible systematic errors, which might arise from the DOAS fit itself: Its relative size is estimated by using
5
twice the fit error given in Table 6 following the argumentation of Stutz and Platt (1996). These errors are then used to calculate the weighted mean deduced from MAX-DOAS and LP-DOAS observations for each of the absorption bands given in Table 5, if their respective relative fit error is smaller than 25 %.
In the literature significant absorption structures due to glyoxal in the eastern Pacific
10
region were reported by Sinreich et al. (2010). However during our cruise, no absorp-tion due to glyoxal was found to exceed our detecabsorp-tion limit of 2σ=5×10¹⁴molec cm−2
glyoxal at low elevation angles of 1–3◦. Nevertheless, in order to exclude an impact of glyoxal absorption on the evaluation of water vapour absorptions, the analysis proce-dure was repeated also including glyoxal. The result is comparable to the result without
15
glyoxal absorption, only the amplitude of the weak water absorption around 426 nm was slightly reduced by the additional degree of freedom introduced to the spectral retrieval. For the LP-DOAS measurements an upper limit of 30 ppt glyoxal (Mahajan et al., 2014) was determined and its cross-section was also not included in the final analysis.
20
4.1 Comparison of LP-DOAS data with data from meteorological stations
In order determine whether the assumed water vapour absorption cross-sections ac-tually give the correct water vapour concentration, the main absorption W3 found in LP-DOAS data was compared to water vapour mixing ratios derived from meteorologi-cal parameters measured on CVAO.
25
Tak-AMTD
8, 5895–5936, 2015Relative absorption strengths of water vapour absorption
J. Lampel et al.
Title Page
Abstract Introduction
Conclusions References
Tables Figures
◭ ◮
◭ ◮
Back Close
Full Screen / Esc
Printer-friendly Version Interactive Discussion
Discussion
P
a
per
|
Discussion
P
a
per
|
Discussion
P
a
per
|
Discussion
P
a
per
|
ing the measurement error given for the meteorological station, the stated error in the temperature measurements of 0.3◦C results in 2 % uncertainty in the relative humid-ity. Pressure uncertainties cancel out, since the same pressure measurements were used for the conversion of column densities from LP-DOAS to mixing ratios as well as in the Magnus formula. An error of 5 % in relative humidity directly translates in an
5
5 % error for the mixing ratio. This means that the absolute differences of the cross-sections shown in Table 1 cannot be absolutely validated with sufficient precision, even though the water vapour mixing ratios ranged from 2.0–3.4 % and meteorological sta-tion data and LP-DOAS water vapour data correlated with a Pearson’sR=0.93. Slope
and offset values are listed in Table 7. The LP-DOAS results based on the HITEMP
10
cross-section were on average 7 % lower than the values inferred from the meteoro-logical station data, and thus closer to the absolute magnitude of the W3 absorption in HITRAN 2009. Retrieving tropospheric water vapour profiles from the MAX-DOAS measurements introduced even larger deviations probably due to uncertainties in re-trieving the required aerosol profiles.
15
4.2 Absorption of water vapour in the UV wavelength range
As mentioned above, water vapour absorptions are not only observed in the spectral region above 390 nm, but down to wavelengths approaching the dissociative continuum starting below 243 nm (Maksyutenko et al., 2012). Alsoab initiocalculations (Polyansky et al., 2012) for this spectral region were developed.
20
BT2 and HITEMP included absorption features of water vapour in the wavelength range below 390 nm, as shown in Fig. 1. Other trace gases such as HCHO, BrO and HONO are retrieved in this wavelength region. However to date, water vapour absorp-tions are not included in DOAS retrieval procedures. Therefore the detection of water vapour absorption below 390 nm and thus the possibility to improve trace gas retrievals
25
are of great interest for DOAS measurements.
AMTD
8, 5895–5936, 2015Relative absorption strengths of water vapour absorption
J. Lampel et al.
Title Page
Abstract Introduction
Conclusions References
Tables Figures
◭ ◮
◭ ◮
Back Close
Full Screen / Esc
Printer-friendly Version Interactive Discussion
Discussion
P
a
per
|
Discussion
P
a
per
|
Discussion
P
a
per
|
Discussion
P
a
per
|
During the MAX-DOAS measurements (M91) systematic residual structures in the spectral region below 370 nm were observed. Their amplitude of up to 6×10⁻⁴
in-creased with decreasing elevation angle just like the O4 and/or water vapour dSCDs
(at 442 nm) and also the residual spectral structure showed narrow differential absorp-tion features. This could indicate a tropospheric absorber in the spectral region below
5
370 nm – which is currently no considered in typical DOAS retrievals – such as water vapour. Due to the strong correlation of O4 and water vapour dSCDs for the MAX-DOAS measurements during the M91 campaign and insufficient detection limits for the LP-DOAS measurements, these residual structures could not be unambiguously at-tributed to either O4or water vapour absorption. The variation of water vapour mixing
10
ratios along the cruise track of M91 was not large enough to separate both possible contributions.
The water vapour absorption band around 377 nm could not be identified by our MAX-DOAS measurements (M91) so far and is, judging from the residual optical depth from the fit, presumably smaller than 4×10⁻²⁷cm2at a spectral resolution of 0.45 nm.
15
This is in agreement with the published values of the cross-sections shown in Fig. 1. The specified cross-section of the absorption band at 362 nm is about twice as large in BT2 as in HITEMP, which might be partly due to the line cutoffpresent in the HITEMP database. Furthermore, the retrieval of this band from atmospheric spectra would be difficult due to uncertainties of the overlaying absorption of the collision induced
ab-20
sorption by the oxygen dimer O4. When using the most recent O4 absorption
cross-section by Thalman and Volkamer (2013) in our DOAS evaluation, the water vapour absorption appear to be present in our measurement data, but the instability of the fit and large residual structures close to the possible water absorption indicate that there is still a significant mismatch between measurement and modeled absorption lines.
25
AMTD
8, 5895–5936, 2015Relative absorption strengths of water vapour absorption
J. Lampel et al.
Title Page
Abstract Introduction
Conclusions References
Tables Figures
◭ ◮
◭ ◮
Back Close
Full Screen / Esc
Printer-friendly Version Interactive Discussion
Discussion
P
a
per
|
Discussion
P
a
per
|
Discussion
P
a
per
|
Discussion
P
a
per
|
The reported cross-section values ofσmax=2.94×10
−24
cm−2molec−1at 330 nm are exceeding the maximum absorption of the BT2 line list in the spectral region from 330– 350 nm by two orders of magnitude. This would lead to an OD of τ=S×σmax=1.2
for MAX-DOAS measurements withSH2O=4×10 23
molec cm−2(a typical MAX-DOAS column density for mid-latitude summer conditions) under a telescope elevation angle
5
of 3◦
, which is clearly in disagreement with our observations. Also measurements of other tropospheric trace gases such as HCHO (336.5–359 nm) (Pinardi et al., 2013), BrO (330.6–352.75 nm) and SO2 (314.8–326.8 nm) (Lübcke et al., 2014) which would
have also been affected, did not show any unknown differential absorption of this size, but yielded residual spectra with at least two orders of magnitude smaller amplitudes.
10
For MAX-DOAS measurements in the Peruvian upwelling (M91) the magnitude of the fit residual in the region from 332–370 nm was below 6×10⁻⁴peak-to-peak for a water
vapour dSCD retrieved in the blue wavelength range of 4×10²³molec cm−2, yielding
an upper limit on the differential cross-section of water vapour of 3×10⁻²⁷cm2molec−1
at a resolution of 0.45 nm under atmospheric conditions, i.e. three orders of magnitude
15
smaller than the figure reported by Du et al. (2013) at 330 nm.
If the shape of the water vapour cross-section presented in Du et al. (2013) could be represented by the DOAS polynomial in the respective wavelength range, it would not be detected. But already the comparably small absorption at 345 nm would have resulted in a significant absorption structure with a differential absorption structure size
20
of 6×10⁻², which could not have been compensated by the polynomial. Additionally,
water vapour does not show an absorption cross-section which can be represented by a polynomial in other spectral regions in the visible spectral range. We therefore con-clude that the cross-section values reported in Du et al. (2013) must be considerably too high, judging from UV MAX-DOAS measurements under atmospheric conditions.
25
AMTD
8, 5895–5936, 2015Relative absorption strengths of water vapour absorption
J. Lampel et al.
Title Page
Abstract Introduction
Conclusions References
Tables Figures
◭ ◮
◭ ◮
Back Close
Full Screen / Esc
Printer-friendly Version Interactive Discussion
Discussion
P
a
per
|
Discussion
P
a
per
|
Discussion
P
a
per
|
Discussion
P
a
per
|
in middle-latitudes on the radiation flux at the ground level is be comparable to ozone between 330–350 nm cannot be supported.
At a spectral resolution of 0.5 nm, the OD attributed to water vapour between 350 and 370 nm is according to HITEMP 5.5×10⁻⁴ (BT2: 9.5×10⁻⁴) for a
typ-ical H2O–dSCD of 4×10 23
molec cm−2. Under similar measurement conditions
5
(dSCDO4=4×10 43
molec2cm−5) the OD due to O4is 2×10
−2
, i.e. by a factor of 20–40 larger. The OD according to HITEMP/BT2 from 330–350 nm is comparable to the opti-cal density of 1 ppt BrO along a lightpath of 10 km and could thus be crucial for DOAS measurements of BrO in the remote marine boundary layer (compare e.g. Volkamer et al., 2015). Furthermore these absorptions could contribute to the observed
prob-10
lems during the retrieval of tropospheric HCHO as described by Pinardi et al. (2013). To estimate the overall influence of water vapour on the retrieval of O4, BrO, HCHO
and HONO further dedicated laboratory measurements of water vapour in this spectral region are needed.
4.3 Error sources 15
The residual spectra obtained from the DOAS evaluation procedure of the measure-ments were usually not dominated by photon shot noise, but showed recurrent residual structures as show in Fig. 2. Since the influence of other absorbers than H2O is prob-ably negligible, these residual structures from instrumental instabilities, saturation and
I0-effect (for MAX-DOAS) should be the dominating sources of interference. Their
influ-20
ence on the absolute magnitude of the absorption bands in discussed in the following subsections, the influence of radiative transfer effects is discussed in Sect. 3.3.1.
4.3.1 Other absorbers
For MAX-DOAS measurements the OD of other absorbers than water vapour was kept low by using a Fraunhofer referenceI0(λ) recorded within the same sequence of
eleva-25
AMTD
8, 5895–5936, 2015Relative absorption strengths of water vapour absorption
J. Lampel et al.
Title Page
Abstract Introduction
Conclusions References
Tables Figures
◭ ◮
◭ ◮
Back Close
Full Screen / Esc
Printer-friendly Version Interactive Discussion
Discussion
P
a
per
|
Discussion
P
a
per
|
Discussion
P
a
per
|
Discussion
P
a
per
|
the measurements and most of the stratospheric absorption by ozone and NO2cancel out and do not affect the evaluation. Furthermore, the measurement campaigns se-lected took place in remote areas with background ozone concentrations around 30– 40 ppb ozone and NO2 typically well below 1 ppb. The OD associated with NO2 was (2±9)×10−4, ozone below 1.5×10⁻⁴and iodine monoxide (2.2±2.2)×10−4. In
com-5
parison, the typical OD of water vapour for the wavelength intervals W0–W5 ranged up to 1.65×10⁻², see Fig. 1. Since the measurements were performed on the ocean, the
influence of possible vibrational Raman scattering in liquid water (Vountas et al., 2003; Peters et al., 2014) on the MAX-DOAS results was tested for and was not found to be significant. Changes in water vapour dSCDs were about 1 % when including liquid
10
water Raman scattering in the fit.
For the LP-DOAS measurements the same upper limits for the absorption of NO2
were found. The detection limits for O3, glyoxal and IO were 191 ppb, 30 and 0.36 ppt,
which were not exceeded during our nightly measurements. Therefore these trace-gases were not included in the final analysis.
15
4.3.2 Saturation effects
The saturation effect originates from the fact that the convolution of literature cross-sections with the instrument function does not commute with the exponential function in the Lambert-Beer Law (Wenig et al., 2005). This effect can be corrected for by replacing the absorption cross-sectionσ(λ) byσ∗
Sat(λ) given by 3 for a given column density S.
20
σ∗
Sat(λ)=
1
Sln (exp(−S×σ(λ))⊗H) (3)
The saturation effect for dSCD of 6×10²³molec cm−2 would reduce the apparent
OD for the strongest absorption discussed here at 442 nm by about 2 %. A significant influence of the saturation effect on the results presented here can therefore be ruled out. This consideration is supported by the observed linear relationship between the
AMTD
8, 5895–5936, 2015Relative absorption strengths of water vapour absorption
J. Lampel et al.
Title Page
Abstract Introduction
Conclusions References
Tables Figures
◭ ◮
◭ ◮
Back Close
Full Screen / Esc
Printer-friendly Version Interactive Discussion
Discussion
P
a
per
|
Discussion
P
a
per
|
Discussion
P
a
per
|
Discussion
P
a
per
|
retrieved water vapour SCDs retrieved for weaker (W1) and stronger (W3) absorption bands shown in Fig. 3.
4.3.3 The solarI0effect
The solarI0effect (Platt et al., 1997) describes the effective weighting of the absorption
cross-section, if the spectrum of the light source is highly structured itself, such as that
5
of the Sun.
This needs to be corrected for MAX-DOAS measurements only, since the light source of LP-DOAS systems have usually broader structures than the absorbers itself. The zeroth orderI0 correction does therefore not rely on the OD of the absorber, but can
be corrected together with the saturation effect as described by (Aliwell et al., 2002;
10
Vogel et al., 2013) for a fixed dSCD. For our measurements corrections were made by calculating a modifiedσ∗
I0(λ) using the Kitt Peak solar flux atlas (Chance and Kurucz,
2010):
σ∗ I0(λ)=
1
Sln (I
0exp(−S×σ(λ)))⊗H
I0⊗H
(4)
The I0 effect can result in changes of apparent cross-section in MAX-DOAS
mea-15
surements of up to 10 %. Because these changes can reduce as well as enhance the apparent OD, the data were evaluated with and without solarI0correction to estimate
its effect on the relative absorption strength of different water vapour absorption bands. The data shown in Table 5 isI0-corrected and theI0-effect accounts here for changes
of at most 2 %. Including theI0effect resulted in a significant reduction of the residual
20
and therefore the fit errors. For the MAX-DOAS evaluation, a SCD for theI0correction
of 1×10¹⁵molec cm−2 for NO2, 1×10¹⁸molec cm−2 for O3 and 3×10²³molec cm−2
AMTD
8, 5895–5936, 2015Relative absorption strengths of water vapour absorption
J. Lampel et al.
Title Page
Abstract Introduction
Conclusions References
Tables Figures
◭ ◮
◭ ◮
Back Close
Full Screen / Esc
Printer-friendly Version Interactive Discussion
Discussion
P
a
per
|
Discussion
P
a
per
|
Discussion
P
a
per
|
Discussion
P
a
per
|
5 Discussion
From the fit errors listed in Table 6 especially for the weak absorption features of water vapour, it can be seen that the development of water vapour absorption compilations from HITRAN 2009 to HITEMP/HITRAN 2012 results in a better fit of the measure-ment data. The fit errors for the intervals (W0 to W5) of the water vapour absorption
5
cross-section are reduced. Changing from HITRAN 2009 to HITEMP or BT2, reduces nearly all fit errors somewhat, the reduction is dramatic (20–75 %) for the weaker bands (W1,W2 and W4). The smallest relative fit errors are observed for most absorption bands for HITEMP.
The magnitude of the main absorption W3 at 442 nm agrees with data from a
mete-10
orological station as shown in Table 7.
Nevertheless, the relative absorptions of different groups of absorption lines are in-consistent and do not fit our measurements, they are listed relative to W3 in Table 5. In the BT2 line list and in HITEMP the absorptions from 410–434 nm overestimate the observed absorptions approximately by a factor of two.
15
Tennyson (2014) noted that the absorption line intensities for transitions involving highly excited vibrational states can depend strongly on the representation of the dipole moment surfaces in theab initio models, particularly for transitions involving bending modes. This could be in agreement with our observations, since the largest discrep-ancy between modelled and measured absorptions was observed for the 7ν+δ-polyad.
20
– For W0 (394–410 nm) the results from MAX-DOAS and LP-DOAS agree, that the magnitude of the absorption at W0 is found to be about 5±6% smaller in
measurements than what is reported in HITEMP.
– For W1 (410–423.5 nm) the agreement of MAX-DOAS and LP-DOAS measure-ments is not as good, since the overall absorption is about half as large as W0.
25
The absorption of this group of absorption lines is by 60±10% too high in HITEMP.
AMTD
8, 5895–5936, 2015Relative absorption strengths of water vapour absorption
J. Lampel et al.
Title Page
Abstract Introduction
Conclusions References
Tables Figures
◭ ◮
◭ ◮
Back Close
Full Screen / Esc
Printer-friendly Version Interactive Discussion
Discussion
P
a
per
|
Discussion
P
a
per
|
Discussion
P
a
per
|
Discussion
P
a
per
|
when considering the overestimation of the absorption W1 in HITEMP, the fit er-ror was reduced from HITRAN 2009 to HITEMP. This shows that the shape of the absorption is reproduced more accurately in HITEMP.
– The absorption W2 (423.5–434 nm) was not regularly identified in LP-DOAS mea-surements, but is also close to the magnitude of the residuals for MAX-DOAS
5
data. Therefore the result for W2 should be viewed with caution. The shape of the water cross-section is reproduced correctly within 1×10⁻²⁷cm2 at 0.45 nm
resolution. HITEMP overestimates this absorption compared to observations by 30±25%, BT2 even by 82±33%, but its shape is reproduced better in HITEMP
than in HITRAN 2009, as seen from the smaller fit errors.
10
– The absorption W3 (434–451.5 nm) is relatively strong and therefore requires ap-plication of saturation andI0corrections. Furthermore neglecting the changes in
radiative transfer for MAX-DOAS measurements for individual absorption lines leads to significant structures in the residual spectra (up to 5×10⁻⁴), while
the overall water vapour dSCD is only slightly changed by <3 % for a dSCD
15
S <5×10²³molec cm−2. The simple approximation of having a constant light path
for the MAX-DOAS observation within this wavelength interval does not hold here for larger OD, therefore the fit errors also do not decrease as seen for the BT2 list for LP-DOAS measurements in Table 6.
– The absorption W4 (451.5–461.5 nm) is small, however absorptions in this
wave-20
length range could interfere with measurements of glyoxal. In fact the optical den-sity due to H2O is comparable to previous observations of glyoxal on the open
ocean which also absorbs in this spectral region. A water vapour dSCD correlated structure in the residuals is found at the absorption at 453.0 nm (HITEMP) which can be also seen in Fig. 2. This absorption seems to be better reproduced in BT2,
25
AMTD
8, 5895–5936, 2015Relative absorption strengths of water vapour absorption
J. Lampel et al.
Title Page
Abstract Introduction
Conclusions References
Tables Figures
◭ ◮
◭ ◮
Back Close
Full Screen / Esc
Printer-friendly Version Interactive Discussion
Discussion
P
a
per
|
Discussion
P
a
per
|
Discussion
P
a
per
|
Discussion
P
a
per
|
– For W5 (461.5–480 nm) good agreement for water vapour absorption based on HITEMP, HITRAN 2009 and BT2 was found in observed LP-DOAS spectra within an error of 4 %. W5 was not within the measured wavelength range of the MAX-DOAS instrument.
On the basis of the observed discrepancies in relative absorption band strength,
5
we suggest rescaling the respective water vapour absorption cross-section or to in-clude only wavelength intervals in a DOAS analysis where the relative absorption band strengths are sufficiently in agreement with each other. This means e.g. for IO that the water absorption band at 442 nm (W3) should be avoided, if the absorption at 426 nm (W2) or even also at 416 nm (W1) is included. For the retrieval of glyoxal with its main
10
spectral absorption features above 440 nm, a wavelength window which does not in-clude water vapour absorption at 426 and 416 nm should be preferred when using these water vapour absorption cross-sections. The same argumentation applies for choosing a retrieval interval for NO2.
The relative strength of the absorption band W5 around 470 nm and the small fit
15
errors indicate that the water vapour absorption cross-section is unlikely to cause in-terferences when retrieving O4 dSCDs for radiative transfer modelling in this spectral region.
The water absorptions included in HITEMP below 390 nm were observed in our mea-surements and found to be smaller thanσmax=4×10
−27
cm2for the 377 nm region for
20
a spectral resolution of 0.45 nm. Absorptions observed in the 362 nm region might be caused by water vapour or by uncertainties of O4 cross-sections. Here absorptions
with ODs of 4×10⁻⁴correspond to water vapour dSCDs of 3×10²³molec cm−2(BT2)
or 6×10²³molec cm−2 (HITEMP), which are realistic dSCDs in mid-latitude regions.
Typical O4 absorptions in MAX-DOAS measurements in this regions are of the
or-25
der of 2×10⁻². Since the O4 absorption is used to retrieve aerosol extinction profiles
AMTD
8, 5895–5936, 2015Relative absorption strengths of water vapour absorption
J. Lampel et al.
Title Page
Abstract Introduction
Conclusions References
Tables Figures
◭ ◮
◭ ◮
Back Close
Full Screen / Esc
Printer-friendly Version Interactive Discussion
Discussion
P
a
per
|
Discussion
P
a
per
|
Discussion
P
a
per
|
Discussion
P
a
per
|
calculations and dedicated validation measurements of the water vapour absorption cross-section below 395 nm.
Another aspect which needs to be considered is the wavelength dependence of the air mass factor in MAX-DOAS measurements covering several significant absorption bands, which implies that low residuals can only be obtained when accounting for these
5
effects. For example, for a water vapour dSCD of 5×10²³molec cm−2these effects will
lead to residual structures of≈2.5×10⁻⁴when including W1–W3 or already≈1×10⁻⁴
within W3 itself (compare also Table 4).
6 Conclusions
The revised line compilations HITEMP and BT2 lead to considerable improvements
10
in DOAS measurements of water vapour and other trace gases. In particular lowering the threshold above which absorption lines are included in the HITRAN database as well as theoretical and experimental progress led to improved water vapour absorption cross-sections in the blue wavelength range.
We showed that the water vapour absorption fit errors of the DOAS retrieval can be
15
reduced by up to 20–75 % by using current water vapour absorption cross-sections (e.g. HITEMP: Rothman et al., 2010) compared to older versions of HITRAN. This shows, that the shape of the water vapour absorption is better reproduced by the HITEMP, reducing the amplitude of residual spectra. When the error in the relative magnitude of several absorption bands are corrected (e.g. by scaling the water vapour
20
absorption cross-sections in the different spectral intervals), the amplitude of residual spectra for larger fit intervals can be reduced significantly (compare e.g. Fig. 2), which then allows more reliable retrieval of weak absorbers.
Each of the water vapour absorption cross-sections evaluated here (HITRAN 2009, HITRAN 2012, HITEMP and BT2) was found to have certain limitations for the use
25
AMTD
8, 5895–5936, 2015Relative absorption strengths of water vapour absorption
J. Lampel et al.
Title Page
Abstract Introduction
Conclusions References
Tables Figures
◭ ◮
◭ ◮
Back Close
Full Screen / Esc
Printer-friendly Version Interactive Discussion
Discussion
P
a
per
|
Discussion
P
a
per
|
Discussion
P
a
per
|
Discussion
P
a
per
|
DOAS measurements of tropospheric trace-gases at mid-latitudes. Fit errors obtained from evaluating measurement data were found to become lower for individual absorp-tion features with the improvement of the HITRAN database from HITRAN 2009 to HITEMP and HITRAN 2012. However, we also showed that there are still problems concerning the relative strength of the different absorption bands in the blue
wave-5
length range, which need to be addressed.
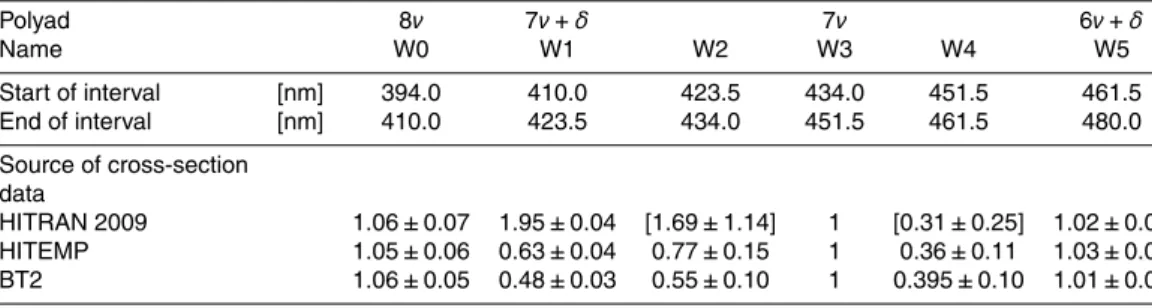
The correction factor for different absorption bands from 394 to 480 nm, which we derived from our atmospheric measurements are listed in Table 8. They range from 0.5 to 1.9 and are highly significant. Even the most recent water vapour absorption cross-section (HITRAN 2012) still requires the application of correction factors ranging
10
between 0.63 to 1.0. The corrections are necessary for all high precision DOAS mea-surements in this spectral range when significant water vapour absorption is present. The here presented correction factors can be used until better absorption line lists are available. Inclusion of even weaker absorption lines in the data bases could further im-prove the modeling of water vapour optical densities, as indicated by the minimum in fit
15
errors of LP-DOAS data when using the BT2 line list without a threshold for the absolute magnitude of the cross-section of individual absorption lines. From our measurements, water vapour absorptions below 385 nm remain uncertain and do not match current wa-ter vapour absorption cross-section data. We could not confirm recent UV-wawa-ter vapour absorption cross-section measurements by Du et al. (2013) and found upper limits for
20
the absorption cross-section which are probably two orders of magnitude lower. There-fore further research to provide more consistent water vapour absorption cross-section data in the UV/VIS range is necessary.
Acknowledgements. We thank J. Tennyson, H. Sihler and K. Großmann for helpful comments during the preparation of the manuscript.
25
AMTD
8, 5895–5936, 2015Relative absorption strengths of water vapour absorption
J. Lampel et al.
Title Page
Abstract Introduction
Conclusions References
Tables Figures
◭ ◮
◭ ◮
Back Close
Full Screen / Esc
Printer-friendly Version Interactive Discussion
Discussion
P
a
per
|
Discussion
P
a
per
|
Discussion
P
a
per
|
Discussion
P
a
per
|
the Anthropocene) project (Förderkennzahl: FKZ 03F0662F) which is embedded in SOLAS. We thank the University of University of York/NCAS (National Centre for Atmospheric Science) for providing meteorological measurement data at CVAO. We thank the authorities of Peru for the permission to work in their territorial waters.
5
The article processing charges for this open-access publication were covered by the Max Planck Society.
References
Aliwell, S. R., Roozendael, M. V., Johnston, P. V., Richter, A., Wagner, T., Arlander, D. W., Bur-rows, J. P., Jones, D. J., Tornkvist, K. K., Lambert, J.-C., Pfeilsticker, K., and Pundt, I.: Analy-10
sis for BrO in Zenith-sky spectra: An intercomparision exercise for analysis improvement, J. Geophys. Res., 107, doi:10.1029/2001JD000329, 2002. 5912
Bange, H.: Surface Ocean – Lower Atmosphere Study (SOLAS) in the upwelling region off Peru – Cruise No.M91, DFG-Senatskommission für Ozeanographie, METEOR-Berichte, 91, 69 pp., doi:10.2312/cr_m91, available at: https://portal.geomar.de/metadata/leg/show/ 15
316029, 2013. 5899
Barber, R. J., Tennyson, J., Harris, G. J., and Tolchenov, R. N.: A high-accuracy computed water line list, Mon. Not. R. Astron. Soc., 368, 1087–1094, doi:10.1111/j.1365-2966.2006.10184.x, available at: http://mnras.oxfordjournals.org/content/368/3/1087.abstract, 2006. 5897 Bleisch, R. and Kampfer, N.: Retrieval of tropospheric water vapour profiles by using spectra 20
from a microwave spectro-radiometer at 22 GHz, in: Microwave Radiometry and Remote Sensing of the Environment (MicroRad), 2012 12th Specialist Meeting on, 5–9 March 2012, Rome, Italy, 1–3, doi:10.1109/MicroRad.2012.6185249, IEEE, 2012. 5904
Bussemer, M.: Der Ring-Effekt: Ursachen und Einflußauf die spektroskopische Messung stratosphärischer Spurenstoffe, Diploma thesis, Heidelberg University, Heidelberg, Germany, 25
1993. 5928
AMTD
8, 5895–5936, 2015Relative absorption strengths of water vapour absorption
J. Lampel et al.
Title Page
Abstract Introduction
Conclusions References
Tables Figures
◭ ◮
◭ ◮
Back Close
Full Screen / Esc
Printer-friendly Version Interactive Discussion
Discussion
P
a
per
|
Discussion
P
a
per
|
Discussion
P
a
per
|
Discussion
P
a
per
|
Carpenter, L., Fleming, Z., Read, K., Lee, J., Moller, S., Hopkins, J., Purvis, R., Lewis, A., Müller, K., Heinold, B., Herrmann, H., Fomba, K., van Pinxteren, D., Müller, C., Tegen, I., Wieden-sohler, A., Müller, T., Niedermeier, N., Achterberg, E., Patey, M., Kozlova, E., Heimann, M., Heard, D., Plane, J., Mahajan, A., Oetjen, H., Ingham, T., Stone, D., Whalley, L., Evans, M., Pilling, M., Leigh, R., Monks, P., Karunaharan, A., Vaughan, S., Arnold, S., Tschritter, J., Pöh-5
ler, D., Frieß, U., Holla, R., Mendes, L., Lopez, H., Faria, B., Manning, A., and Wallace, D.: Seasonal characteristics of tropical marine boundary layer air measured at the Cape Verde Atmospheric Observatory, J. Atmos. Chem., 67, 87–140, doi:10.1007/s10874-011-9206-1, 2010. 5900, 5906
Chance, K. and Kurucz, R.: An improved high-resolution solar reference spectrum for earth’s 10
atmosphere measurements in the ultraviolet, visible, and near infrared, J. Quant. Spectrosc. Ra., 111, 1289–1295, doi:10.1016/j.jqsrt.2010.01.036, available at: http://www.sciencedirect. com/science/article/pii/S0022407310000610, special Issue Dedicated to Laurence S. Roth-man on the Occasion of his 70th Birthday, 2010. 5912
Chance, K. and Orphal, J.: Revised ultraviolet absorption cross sections of H2CO for the HI-15
TRAN database, J. Quant. Spectrosc. Ra., 112, 1509–1510, doi:10.1016/j.jqsrt.2011.02.002, 2011. 5928
Coburn, S., Dix, B., Sinreich, R., and Volkamer, R.: The CU ground MAX-DOAS instrument: characterization of RMS noise limitations and first measurements near Pensacola, FL of BrO, IO, and CHOCHO, Atmos. Meas. Tech., 4, 2421–2439, doi:10.5194/amt-4-2421-2011, 20
2011. 5897
Deutschmann, T., Beirle, S., Friess, U., Grzegorski, M., Kern, C., Kritten, L., Platt, U., Prados-Roman, C., Pukite, J., Wagner, T., Werner, B., and Pfeilsticker, K.: The Monte Carlo atmo-spheric radiative transfer model McArtim: Introduction and validation of Jacobians and 3 features, J. Quant. Spectrosc. Ra., 112, 1119–1137, doi:10.1016/j.jqsrt.2010.12.009, 2011. 25
5904
Dix, B., Baidar, S., Bresch, J. F., Hall, S. R., Schmidt, K. S., Wang, S., and Volkamer, R.: Detection of iodine monoxide in the tropical free troposphere, P. Natl. Acad. Sci. USA, 110, 2035–2040, doi:10.1073/pnas.1212386110, 2013. 5898
Du, J., Huang, L., Min, Q., and Zhu, L.: The influence of water vapor absorption in the 290– 30
AMTD
8, 5895–5936, 2015Relative absorption strengths of water vapour absorption
J. Lampel et al.
Title Page
Abstract Introduction
Conclusions References
Tables Figures
◭ ◮
◭ ◮
Back Close
Full Screen / Esc
Printer-friendly Version Interactive Discussion
Discussion
P
a
per
|
Discussion
P
a
per
|
Discussion
P
a
per
|
Discussion
P
a
per
|
Fleischmann, O.: New ultraviolet absorption cross-sections of BrO at atmospheric temperatures measured by time-windowing Fourier transform spectroscopy, J. Photoch. Photobio. A, 168, 117–132, 2004. 5928
Frankenberg, C.: Retrieval of methane and carbon monoxide using near infrared spectra recorded by SCIAMACHY onboard ENVISAT, Dissertation, Institut für Umweltphysik, Uni-5
versität Heidelberg, Heidelberg, Germany, 2005. 5903
Frieß U., Monks, P. S., Remedios, J. J., Rozanov, A., Sinreich, R., Wagner, T., and Platt, U.: MAX-DOAS O4 measurements: A new technique to derive information on atmospheric aerosols: 2. Modeling studies, J. Geophys. Res., 111, D14203, doi:10.1029/2005JD006618, 2006. 5899
10
Frieß, U., Deutschmann, T., Gilfedder, B. S., Weller, R., and Platt, U.: Iodine monoxide in the Antarctic snowpack, Atmos. Chem. Phys., 10, 2439–2456, doi:10.5194/acp-10-2439-2010, 2010. 5898
Grainger, J. and Ring, J.: Anomalous Fraunhofer line profiles, Nature, 193, p. 762, 1962. 5903 Greenblatt, G. D., Orlando, J. J., Burkholder, J. B., and Ravishankara, A. R.: Absorption Mea-15
surements of Oxygen between 330 and 1140 nm, J. Geophys. Res., 95, 18577–18582, 1990. 5903
Großmann, K., Frieß, U., Peters, E., Wittrock, F., Lampel, J., Yilmaz, S., Tschritter, J., Som-mariva, R., von Glasow, R., Quack, B., Krüger, K., Pfeilsticker, K., and Platt, U.: Iodine monoxide in the Western Pacific marine boundary layer, Atmos. Chem. Phys., 13, 3363– 20
3378, doi:10.5194/acp-13-3363-2013, 2013. 5898, 5902
Hermans, C., Vandaele, A. C., Carleer, M., Fally, S., Colin, R., Jenouvrier, A., Coquart, B., and Mérienne, M.-F.: Absorption Cross-Sections of Atmospheric Constituents: NO2, O2, and H2O, Environ. Sci. Pollut. R., 6, 151–158, 1999. 5903
Hill, C., Yurchenko, S. N., and Tennyson, J.: Temperature-dependent molecular absorp-25
tion cross sections for exoplanets and other atmospheres, Icarus, 226, 1673–1677, doi:10.1016/j.icarus.2012.07.028, 2013. 5903
Hönninger, G. and Platt, U.: Observations of BrO and its vertical distribution during surface ozone depletion at Alert, Atmos. Environ., 36, 2481–2489, 2002. 5901, 5902
Hönninger, G., von Friedeburg, C., and Platt, U.: Multi axis differential optical absorption 30
AMTD
8, 5895–5936, 2015Relative absorption strengths of water vapour absorption
J. Lampel et al.
Title Page
Abstract Introduction
Conclusions References
Tables Figures
◭ ◮
◭ ◮
Back Close
Full Screen / Esc
Printer-friendly Version Interactive Discussion
Discussion
P
a
per
|
Discussion
P
a
per
|
Discussion
P
a
per
|
Discussion
P
a
per
|
Kraus, S.: DOASIS – A Framework Design for DOAS, Dissertation, Heidelberg University, Hei-delberg, Germany, 2006. 5928
Kuntz, M.: A new implementation of the Humlicek algorithm for the calculation of the Voigt profile function, J. Quant. Spectrosc. Ra., 57, 819–824, doi:10.1016/S0022-4073(96)00162-8, 1997. 5903
5
Lampel, J., Frieß, U., and Platt, U.: The impact of vibrational Raman scattering of air on DOAS measurements of atmospheric trace gases, Atmos. Meas. Tech. Discuss., 8, 3423–3469, doi:10.5194/amtd-8-3423-2015, 2015. 5902
Lübcke, P., Bobrowski, N., Arellano, S., Galle, B., Garzón, G., Vogel, L., and Platt, U.: BrO/SO2 molar ratios from scanning DOAS measurements in the NOVAC network, Solid Earth, 5, 10
409–424, doi:10.5194/se-5-409-2014, 2014. 5909
Mahajan, A. S., Prados-Roman, C., Hay, T. D., Lampel, J., Pöhler, D., Großmann, K., Tschritter, J., Frieß, U., Platt, U., Johnston, P., Kreher, K., Wittrock, F., Burrows, J. P., Plane, J. M., and Saiz-Lopez, A.: Glyoxal observations in the global marine boundary layer, J. Geophys. Res.-Atmos., 119, 6160–6169, doi:10.1002/2013JD021388, 2014. 5898, 5906
15
Maksyutenko, P., Grechko, M., Rizzo, T. R., and Boyarkin, O. V.: State-resolved spectroscopy of high vibrational levels of water up to the dissociative continuum, Philos. T. R. Soc. A, 370, 2710–2727, 2012. 5897, 5907
Myhre, G., Shindell, D., Bréon, F., Collins, W., Fuglestvedt, J., Huang, J., Koch, D., Lamar-que, J., Lee, D., Mendoza, B., Nakajima, T., Robock, A., Stephens, G., Takemura, T., and 20
Zhang, H.: Anthropogenic and natural radiative forcing, in: Climate Change 2013: The Physical Science Basis. Contribution of Working Group I to the Fifth Assessment Report of the Intergovernmental Panel on Climate Change, edited by: Stocker, T., Qin, D., Plat-tner, G.-K., Tignor, M., Allen, S., Boschung, J., Nauels, A., Xia, Y., Bex, V., and Midg-ley, P., 659–740, Cambridge University Press, Cambridge, UK and New York, NY, USA, 25
doi:10.1017/CBO9781107415324.018, 2013. 5896
Neri, F., Saitta, G., and Chiofalo, S.: An accurate and straightforward approach to line regression analysis of error-affected experimental data, J. Phys. E. Sci. Instrum., 22, 215–217, 1989. 5905
Peters, E., Wittrock, F., Richter, A., Alvarado, L. M. A., Rozanov, V. V., and Burrows, J. P.: Liquid 30
![Table 1. Integrated absorption in [10 − 27 nm cm 2 ] over each of the wavelength intervals W0–W5 for di ff erent sources of cross-section data](https://thumb-eu.123doks.com/thumbv2/123dok_br/18358457.353869/32.918.51.654.291.491/table-integrated-absorption-wavelength-intervals-erent-sources-section.webp)