www.atmos-chem-phys.net/17/1271/2017/ doi:10.5194/acp-17-1271-2017
© Author(s) 2017. CC Attribution 3.0 License.
Detection of water vapour absorption around 363 nm in measured
atmospheric absorption spectra and its effect on DOAS evaluations
Johannes Lampel1,a, Denis Pöhler2, Oleg L. Polyansky3,4, Aleksandra A. Kyuberis4, Nikolai F. Zobov4,
Jonathan Tennyson3, Lorenzo Lodi3, Udo Frieß2, Yang Wang1, Steffen Beirle1, Ulrich Platt2, and Thomas Wagner1
1Max Planck Institute for Chemistry, 55128 Mainz, Germany
2Institute of Environmental Physics, University of Heidelberg, 69120 Heidelberg, Germany
3Department of Physics and Astronomy, University College London, Gower St, London WC1E 6BT, UK 4Institute of Applied Physics, Russian Academy of Sciences, Nizhny Novgorod, Russia
anow at: Institute of Environmental Physics, University of Heidelberg, 69120 Heidelberg, Germany
Correspondence to:Johannes Lampel ([email protected])
Received: 10 May 2016 – Published in Atmos. Chem. Phys. Discuss.: 30 June 2016 Revised: 16 December 2016 – Accepted: 5 January 2017 – Published: 27 January 2017
Abstract. Water vapour is known to absorb radiation from the microwave region to the blue part of the visible spectrum with decreasing efficiency. Ab initio approaches to model in-dividual absorption lines of the gaseous water molecule pre-dict absorption lines up to its dissociation limit at 243 nm.
We present the first evidence of water vapour absorp-tion near 363 nm from field measurements using data from multi-axis differential optical absorption spectroscopy (MAX-DOAS) and long-path (LP)-DOAS measurements. The identification of the absorptions was based on the recent “POKAZATEL” line list by Polyansky et al. (2017).
For MAX-DOAS measurements, we observed absorption by water vapour in an absorption band around 363 nm with optical depths of up to 2×10⁻³. The retrieved column
densi-ties from 2 months of measurement data and more than 2000 individual observations at different latitudes correlate well with simultaneously measured well-established water vapour absorptions in the blue spectral range from 452 to 499 nm (R2=0.89), but the line intensities at around 363 nm are
un-derestimated by a factor of 2.6±0.5 by the ab initio model.
At a spectral resolution of 0.5 nm, we derive a maximum cross section value of 2.7×10⁻²⁷cm2molec−1at 362.3 nm.
The results were independent of the used literature absorp-tion cross secabsorp-tion of the O4absorption, which overlays this
water vapour absorption band.
Also water vapour absorption around 376 nm was identi-fied. Below 360 nm no water vapour absorption above 1.4×
10−26cm2molec−1was observed.
The newly found absorption can have a significant impact on the spectral retrievals of absorbing trace-gas species in the spectral range around 363 nm. Its effect on the spectral analysis of O4, HONO and OClO is discussed.
1 Introduction
Wavelength [nm]
W
a
te
r
v
a
p
o
u
r
c
ro
s
s
s
e
c
ti
o
n
[
c
m
m
o
le
c
]
2
340 360 380 400 420 440 460 480 500
10-28 10-27 10-26 10-25
POKAZATEL BT2 HITEMP HITRAN2008
τ=10-4 for CD=4*1023
350 355 360 365 370
10-29 10-28 10-27 10-26
[c
m
m
o
le
c
]
5
-2
0 5
x 10-46
O
4 cross-section
340 360 380 400 420 440 460 480 500
[a
.u
.]
Wavelength [nm]
HONO OClO SO2 HCHO BrO
-1
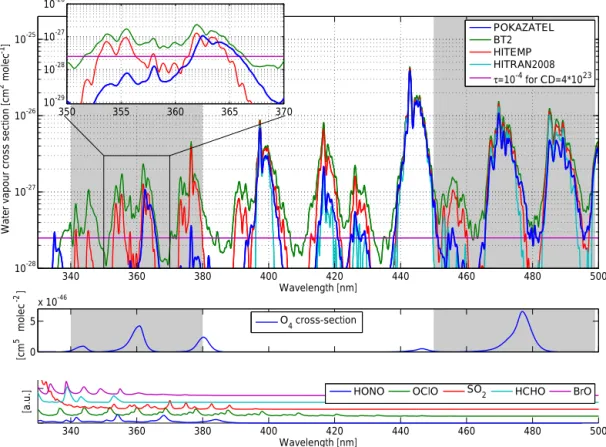
Figure 1.Overview of some recently published water vapour cross sections convoluted to a spectral resolution of 0.5 nm in the spectral
interval from 330 to 500 nm. Also indicated is a typical MAX-DOAS detection limit for a differential optical density (OD) of 10−4at a water vapour column density of 4×10²³(purple line, top panel). The middle panel shows the O4absorption cross section and the lowermost panel
shows other absorbers of atmospheric relevance (HONO, OClO, SO2, HCHO, and BrO) in this spectral range.
that concern us here. The gap between observed absorptions and the available literature absorption cross sections from laboratory measurements can be addressed by means of ab initio models for water vapour absorption lines, which can provide energy (i.e. wavelength), intensity and additional pa-rameters for each absorption line. This is done, e.g., in the HITRAN database (Rothman et al., 2013), where tion from measured absorption lines is merged with informa-tion from other sources such as ab initio models. In addiinforma-tion to HITRAN, other line-list compilations are also available, such as the GEISA database (Jacquinet-Husson et al., 2008), which lists water vapour absorption lines up to 25 232 cm−1 (down to 396.3 nm).
Lampel et al. (2015b) found systematic structures in the fit residuals in this spectral range below 370 nm with mag-nitudes of around 5×10⁻⁴in multi-axis differential optical
absorption spectroscopy (MAX-DOAS) atmospheric obser-vations, which could point towards a tropospheric absorber with absorption structures in this spectral range. The BT2 (Barber et al., 2006) and HITEMP (Rothman et al., 2010) line lists could explain some of the structures, but show in-consistencies. HITEMP is a synthesis of the 2008 edition of HITRAN Rothman et al. (2009) and BT2 with HITRAN
lines replacing BT2 ones where they were available1. Still,
these two line lists show significant differences between each other, mostly due to the individual line cut-off employed in the HITEMP database (see also Fig. 1). This cut-off removes weak absorption lines from the line list and was introduced for the HITRAN and HITEMP line lists to reduce the num-ber of individual absorption lines for further processing as described, e.g., in Rothman et al. (2010). It removes a large number of weak individual lines below the line intensity cut-off of 10−27cm molec−1for wavelengths shorter than 1 µm (Rothman et al., 2010).
Polyansky et al. (2017) recently developed a computed line list (which we call “POKAZATEL” here, according to the first letters of the name of each author) containing wa-ter vapour lines in the spectral range below 400 nm. It is independent of the other sources and is based on a
num-1The HITRAN 2008, HITEMP and HITRAN 2012 data used
ber of theoretical improvements compared to BT2. BT2 al-ready listed absorptions in this spectral region prior to the publication of POKAZATEL. The POKAZATEL line list differs significantly from BT2 and thus also HITEMP be-low 380 nm (see Fig. 1). In general, only a few of these lines below 380 nm have also been reported from labora-tory measurements (Dupré et al., 2005; Maksyutenko et al., 2012). For a compilation of spectroscopic data see Tennyson et al. (2013). Previous publications, such as HITRAN 2012 (Rothman et al., 2013), do not list water vapour lines below 388 nm.
Recently, Wilson et al. (2016) deduced upper limits for the water vapour absorption in the near-UV by inco-herent broadband cavity enhanced absorption spectroscopy measurements in the laboratory. They estimated the wa-ter vapour absorption cross section to be smaller than 5×
10−26cm2molec−1 at a spectral resolution of 0.5 nm be-tween 340 and 420 nm. This is significantly smaller than the water vapour cross section measured by Du et al. (2013) be-tween 290 and 350 nm (see Sect. 4.8).
1.1 The POKAZATEL line list
Following up on previous high-quality-computed water line lists (Partridge and Schwenke, 1997; Barber et al., 2006), the POKAZATEL line list (Polyansky et al., 2017) was calcu-lated for the purpose of producing a complete list of wa-ter lines involving transitions between all the bound energy levels of H16
2 O up to dissociation. Until now the most
com-plete water line list, called BT2 (Barber et al., 2006), only covered energy levels up to 30 000 cm−1(333 nm) and rota-tional quantum numbers,J, up to 50. POKAZATEL covers
the entire bound energies up to dissociation – 41 000 cm−1 (244 nm) (Boyarkin et al., 2013) and the highest J
consid-ered is 72.
POKAZATEL extends BT2 3-fold. First, higher tempera-tures can be covered by the line list, as higher energy levels are involved and more hot transitions are calculated. Second, for room temperature the spectral range is expanded in the UV region down to about 244 nm. Third, the predictions of the line positions and intensities by POKAZATEL should be considerably more accurate. In particular, POKAZATEL is based on variational nuclear motion calculations performed with the DVR3D program suite (Tennyson et al., 2004).
In order to calculate the line positions and line intensities of the water lines, two inputs into DVR3D are necessary – a water potential energy surface (PES) for the ground elec-tronic state and a dipole moment surface (DMS). A global water PES, covering geometries up to dissociation, is avail-able only from ab initio calculations (Császár et al., 2010) and is not accurate enough for our purposes. POKAZATEL is therefore based on the semi-empirical PES obtained by the fitting to the experimental data up to 41 000 cm−1(Tennyson et al., 2013). The details of the fit are given by Polyansky et al. (2017). In particular, the rms (root mean square)
de-viation for levels below 25 000 cm−1, calculated by this fit-ted PES, is about 0.03 cm−1, and the levels from 25 000 to 41 000 cm−1are reproduced to within about 0.1 cm−1on av-erage, using measured data from Maksyutenko et al. (2007). A very accurate, ab initio, global DMS was computed by Lodi et al. (2011) and was used without modification for the POKAZATEL line-list calculation. This DMS has been used to successfully construct comprehensive line lists for H217O
and H218O (Lodi and Tennyson, 2012), which were included
in their entirety in the most recent, 2012, release of HITRAN. A recent laboratory investigation has verified the accuracy of these line lists in the near-infrared (Regalia et al., 2014). However, as discussed below, the intensities predicted by the various line lists have yet to be validated in the near-UV.
1.2 Impact on DOAS measurements of atmospheric trace gases
The absorption lines listed in the UV range in POKAZATEL, BT2 and HITEMP, which are to our knowledge presently not included in DOAS retrievals, could have an effect on the overall measurement errors of several trace-gas retrievals and could lead to systematic biases in the spectral evalua-tion of tropospheric absorbers in these spectral regions, such as the oxygen dimer O2–O2(or for short: O4), nitrous acid
(HONO), chlorine dioxide (OClO), sulfur dioxide (SO2),
formaldehyde (HCHO) and bromine monoxide (BrO). In Sect. 4.11, we discuss these potential interferences. In Fig. 1, absorption cross sections of these species are shown in the two lowermost panels.
In particular, spectral structures at around 360 nm have been observed in atmospheric DOAS measurements before and were explained by erroneous O4literature cross sections,
e.g. an incorrect spectral calibration of the respectively used cross section data (e.g. Wagner et al., 2002). In any case, it could be possibly explained by an unaccounted tropospheric absorber.
1.3 Outline
Based on our field measurements combined with the POKAZATEL water vapour line list, which yields new in-formation about water vapour absorption below 390 nm, we make an attempt to answer the following questions:
1. Are the water vapour absorption bands near 335, 363 and 376 nm found in atmospheric DOAS measure-ments?
2. Is the magnitude of these absorptions in agreement with measurements in other wavelength ranges? (cf. Lampel et al., 2015b, for the blue spectral range)
4. What are the consequences for the spectral retrieval of other trace gases in the same spectral region (as, e.g., O4, HONO and OClO)?
2 Atmospheric DOAS measurements
The data analysed here were collected during three differ-ent field campaigns, where differdiffer-ent DOAS instrumdiffer-ents were used.
1. MAX-DOAS data from cruises ANT XXVIII/1-2 (Nag-gar, 2012; Kattner, 2012) of the research vessel Po-larstern, which covered latitudes from 54◦N (northern
Germany) to 70◦S (coastal Antarctica).
2. MAX-DOAS data from the “Surface Ocean PRocesses in the ANtropocene” (SOPRAN) cruise M91 with the research vesselMeteorin the Peruvian upwelling region
in December 2012 (Bange, 2013).
3. Long-path (LP)-DOAS measurements were analysed for water vapour using data from a dedicated measure-ment period in Heidelberg in August and September 2015 (further calledHD15).
An overview of the instruments used is given in Table 1. Both MAX-DOAS cruises were largely unaffected by an-thropogenic pollution, which avoids interferences of high-NO2absorption structures in the data evaluation.
Due to the small latitudinal and temporal extent of cruise M91 (cf. Table 1 and Fig. 2), the variation of water vapour volume-mixing ratios (VMRs) was small. The VMR was, according to the meteorological station onboard, between 1.6 and 2.4 %. Therefore, observed differential slant column densities (dSCDs; Sect. 3) of H2O and O4 correlate well
due to changes in the effective light-path lengths and cannot be unambiguously disentangled. In a first-order approxima-tion, the O4dSCD is proportional to the effective light-path
length, the H2O dSCD is proportional to the light-path length
as well, but also to the absolute humidity along the light path (Eq. 2). The campaign ANT XXVIII/1-2 took place along a cruise track from Bremerhaven, Germany, to Antarctica. It allows one to distinguish actual water vapour absorption from systematic errors of other trace gases, such as the ab-sorption of O4. Water vapour VMRs were found between 0.5
and 3.0 % according to the meteorological station onboard. The MAX-DOAS instrument onboardPolarsternhas a lower
spectral resolution of 0.7 nm (UV) and 0.9 nm (VIS). It has the advantage of a wider spectral range allowing for indepen-dent simultaneous observations of H2O and O4at around 361
and 477 nm due to the spectral overlap of both absorbers (cf. Fig. 1).
Dedicated LP-DOAS measurements were performed in Heidelberg in August and September 2015. The advantage is the high spectral resolution of 0.2 nm and the well-defined
ANT XXVIII M91
Latitude [°]
L
o
n
g
it
u
d
e
[
°]
-100 -80 -60 -40 -20 0 20
-80 -60 -40 -20 0 20 40 60
H2
O
V
C
D
[
m
o
le
c
c
m
-2]
0.2 0.4 0.6 0.8 1 1.2 1.4 1.6 1.8 2 2.2 x 10²³
Figure 2.Measurement overview: the cruise track of M91
(Peru-vian Upwelling) and ANT XXVIII/1-2 (Atlantic) is shown; addi-tionally, the location of the LP-DOAS measurements in Heidelberg, Germany, is marked (white cross in the north-eastern corner of the map). The background shows GOME-2A H2O vertical column den-sities (VCDs) (Wagner et al., 2003) averaged from November to December 2011 (time during ANT XXVIII/1-2). The locations of the measurements shown in Figs. 3 and 5 are also marked by white crosses. Daily error-weighted averages of H2O/O4dSCD ratios
(measured in the wavelength range from 340 to 380 nm at 3◦ tele-scope elevation, corrected according to Fig. 6) are shown as circles and converted to a VCD assuming an exponential water vapour con-centration profile with a scale height of 2 km.
light path of these active measurements. However, high-NO2
concentrations can cause spectral interferences and the range of absolute water VMRs is relatively limited (see Sect. 4.1).
3 The DOAS Method
The DOAS method (Platt and Stutz, 2008) relies on attenua-tion of light with a wavelengthλfrom suitable light sources
(intensityI0) by absorbers within the light path according to
Lambert–Beer’s lawI (λ)=I0(λ)·exp(−τ (λ)). The optical
density (OD)τ (λ)is calculated from a reference spectrum I0(λ) and a measurement spectrumI (λ),τ (λ)= −lnII (λ)
0(λ).
The measured OD of the broadband extinction and scatter-ing by molecules and particles is represented by a broadband polynomialp(λ), or the measured OD is filtered into a
broad-band and a narrow-broad-band contribution. Characteristic absorp-tion features of different absorbing trace-gas species with the total cross sectionσi(λ)are then used to determine their
re-spective concentrationsci(l)along the light pathL:
τ (λ)=X
i
σi(λ)
L Z
0
Table 1.Campaigns of which measurements were used. The cruise tracks of the shipborne MAX-DOAS measurements are shown in Fig. 2.
Name Type Location, time Spec. range Spec. resolution Spectrograph H2O VMR
[nm] [nm] (focal length) %
ANT XXVIII/1-2 MAX-DOAS Atlantic 277–413 0.7 OMT 0.5–3.0
54–70◦S 390–617 0.9 f =60 mm
October–December 2011
M91 MAX-DOAS Peru, coastal upwelling 324–467 0.45 Acton 300i 1.6–2.4
5◦S, 82◦W–16◦S 75◦W f =300 mm
1–25 December2012
HD15 LP-DOAS Heidelberg 329–371 0.2 Acton 300i 0.4–1.3
49◦N, 8◦43′W 426–465 0.2 f =300 mm
August+September 2015
The column densitySi= RL
0 ci(l)dlis calculated by a
fit-ting routine, which is applied to data from a given wavelength interval with a width of several nanometres to several tens of nanometres. The absorption pathLis known for LP-DOAS
measurements and can be estimated or calculated from ra-diative transfer models for MAX-DOAS measurements. The high-resolution literature cross sections σL,i are convoluted
with the measured instrument functionH of the respective
set-up to obtainσi=H⊗σL,i, the absorption cross section
as it would be determined by the instrument.
The instrument slit function is usually measured by ob-serving individual atomic emission lines of mercury, which have a spectral width that is 2 orders of magnitude smaller than the resolution of the instrument (Sansonetti et al., 1996). LP-DOAS measurements (Sect. 3.1) have the advantage of a well-defined light path and the possibility of measurements at night, but typically do not yield the small measurement er-rors of slant column densities (SCDs) like in MAX-DOAS (Sect. 3.2) observations. The disadvantage of MAX-DOAS measurements is that their effective light-path length de-pends on various factors, such as atmospheric state (aerosols, clouds), which are often not known precisely. This needs to be explicitly considered in the data evaluation (Sect. 4.2).
The spectral analysis was done using the DOASIS soft-ware package (Kraus, 2006).
3.1 LP-DOAS Measurements
The LP-DOAS instrument is based on an artificial light source (here a laser-driven light-source Energetiq LDLS-EQ-99). The light is sent by a telescope through the atmosphere to a retroreflector and reflected back to the same telescope. Thus, the measured atmosphere is in-between the telescope and retroreflector. The received light is transferred to a trograph. A measurement sequence consists of four spec-tra: atmospheric spectrum over the distance to the retrore-flector, light-source spectrum, atmospheric background spec-trum (i.e. measurements with the light source switched off or blocked) and light-source background spectrum. The
correc-tion of the atmospheric and light-source spectra with back-ground spectra ensures independence from external sunlight, dark current and other instrumental properties (Pöhler et al., 2010).
A description of the LP-DOAS instrument used here can be found in Pöhler et al. (2010) and Eger (2014). The total light path used for the measurements reported was 6.12 km long: above the city of Heidelberg from the roof of the Insti-tute of Environmental Physics to retroreflectors mounted at the train station “Molkenkur” and back to the institute.
The optical densityτ (λ)is calculated from a
background-corrected light-source spectrum and a background-background-corrected atmospheric spectrum and filtered by a binomial high pass with 1000 iterations. The convoluted and high-pass-filtered literature cross sections listed in Table 2 are then fitted in the respective fitting interval to the corrected OD.
3.2 MAX-DOAS Measurements
Hönninger and Platt (2002) described the method of MAX-DOAS measurements, which improve the sensitivity of pas-sive DOAS observations at altitude ranges close to the instru-ment (i.e. up to a few kilometres). It uses scattered sunlight collected by a telescope pointing towards the sky at different elevation anglesα. The horizon is here defined asα=0◦and
the zenith viewing direction asα=90◦. Each elevation has a
different sensitivity for absorptions in different heights of the atmosphere. Low-elevation angles have a higher sensitivity to absorbers close to the surface because the additional light path compared to a zenith spectrum recorded at the same time and location is mostly located within the lowermost layers of the atmosphere (Hönninger et al., 2004).
The SCD is defined as the integral over the concentra-tionci along the light pathLand is hence given in units of
molecules cm−2.
S=
Z
L
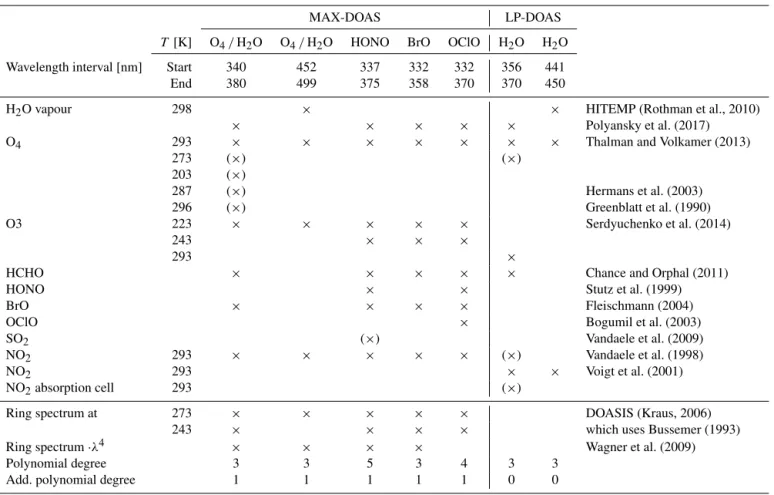
Table 2.Retrieval wavelength intervals and reference spectra for the MAX-DOAS and LP-DOAS measurements. Literature cross sections
listed in brackets were used for sensitivity studies.
MAX-DOAS LP-DOAS
T[K] O4/H2O O4/H2O HONO BrO OClO H2O H2O
Wavelength interval [nm] Start 340 452 337 332 332 356 441
End 380 499 375 358 370 370 450
H2O vapour 298 × × HITEMP (Rothman et al., 2010)
× × × × × Polyansky et al. (2017)
O4 293 × × × × × × × Thalman and Volkamer (2013)
273 (×) (×)
203 (×)
287 (×) Hermans et al. (2003)
296 (×) Greenblatt et al. (1990)
O3 223 × × × × × Serdyuchenko et al. (2014)
243 × × ×
293 ×
HCHO × × × × × Chance and Orphal (2011)
HONO × × Stutz et al. (1999)
BrO × × × × Fleischmann (2004)
OClO × Bogumil et al. (2003)
SO2 (×) Vandaele et al. (2009)
NO2 293 × × × × × (×) Vandaele et al. (1998)
NO2 293 × × Voigt et al. (2001)
NO2absorption cell 293 (×)
Ring spectrum at 273 × × × × × DOASIS (Kraus, 2006)
243 × × × × which uses Bussemer (1993)
Ring spectrum·λ4 × × × × Wagner et al. (2009)
Polynomial degree 3 3 5 3 4 3 3
Add. polynomial degree 1 1 1 1 1 0 0
From MAX-DOAS measurements dSCDs can be calculated for each fitted trace gas: a Fraunhofer reference spectrum (we follow the customary nomenclature by referring to a spec-trum Fraunhofer specspec-trum although it also contains spectral features from Earth’s atmosphere)I0(λ)is chosen from one
of the measurement spectra and the dSCD(α)=SCD(α)−
SCDrefis obtained from the DOAS fit for each elevation
an-gle α relative to the Fraunhofer reference. In the
measure-ments reported here, the DOAS fit includes the cross sections listed in Table 2. By choosing references recorded shortly be-fore and after the measurement spectrum, the influence of in-strumental instabilities on the result was minimised as well as the influence of stratospheric absorbers.
3.2.1 The MAX-DOAS instrument during ANT XXVIII/1-2
The MAX-DOAS instrument operated during Polarstern
cruise ANT XXVIII/1-2 consists of a telescope unit mounted on the deck of Polarsternon port side, which actively
cor-rects for the roll movement of the ship, and a spectrom-eter unit with two temperature stabilised OMT (Optische Messtechnik GmbH) spectrometers (f =60 mm, |1T|<
0.1◦C, 1λ <0.01 nm), which have both been modified to
3.3 Spectral retrieval (MAX-DOAS)
The fit settings are summarised in Table 2 and example fits are shown in Fig. 5. As Fraunhofer reference spectra, the sum of the two 40◦elevation angle spectra closest in time were used. Spectra recorded at a telescope elevation of 90◦were not used as reference spectra, since they could have been in-fluenced by direct sunlight during each of the MAX-DOAS campaigns close to the Equator. The wavelength calibration was performed using recorded mercury discharge lamp spec-tra. On ANT XXVIII/1-2 these were recorded automatically each night together with offset and dark-current spectra; dur-ing M91 they were recorded manually.
An additional intensity offset polynomial was used in the spectral evaluation to compensate for instrumental stray light, as described, e.g., in Peters et al. (2014).
Measurement errors of dSCDs are calculated as twice the DOAS fit error, according to Stutz and Platt (1996). This esti-mate is justified, because the standard deviation of the resid-ual of the linear fit of H2O/O4 ratios at 363 and 477 nm
shown in Fig. 6 amounts to 2.1 times the average DOAS fit error, and the residual spectra from the DOAS fit are domi-nated by noise in the UV. This estimate disregards possible systematic errors, but these are estimated to be small com-pared to the water vapour absorption (< 2×10⁻⁴) as the
resid-ual spectra are dominated by random noise (see Fig. 5). For the water vapour absorption near 363 nm, the wave-length interval was chosen using the technique described in Vogel et al. (2013) on spectra recorded on 1 individual day (15 November 2011 at about 6◦N, 17◦W) of the ANT XXVIII/1-2 data set using the O4 cross section at 298 K
by Thalman and Volkamer (2013); for narrower wavelength ranges beginning above 345 nm and ending below 375 nm, lower H2O dSCDs were observed during the day. However,
the standard deviations of the H2O dSCDs for these retrieval
intervals are 5–6×10²³ (uncorrected) as large as the mean
dSCDs. For the larger fit intervals, the standard deviation is significantly smaller (1–2×10²³), and the ratio of standard
deviation of H2O dSCDs and the average fit error is close to
2, as expected from Stutz and Platt (1996). For the broader fit intervals, the H2O dSCD varies for fit intervals within
330–390 nm with a standard deviation of 16 % of mean H2O
dSCD. We thus estimate the error due to the choice of fit set-tings to be below 20 %. We assume that the small absorption structures of BrO and HCHO, which are not sufficiently con-strained within fit intervals beginning above 345 nm, cause this effect and/or possible compensation of the relatively broad O4absorption by the DOAS polynomial. When
includ-ing HONO in the DOAS analysis for this day with low-NO2
concentrations and thus presumably low-HONO concentra-tions, enhanced HONO and H2O dSCDs are observed
simul-taneously for fit intervals ending above 382 nm.
3.3.1 The blue spectral range
The effective centre of the respective absorptions of O4and
H2O can be calculated for each fit interval[λ1, λ2]using
λm=
1
Rλ2
λ1σ (λ)dλ
λ2
Z
λ1
λσ (λ)dλ. (3)
In the wavelength interval from 452 to 499 nm, the effec-tive centre of the water vapour absorptions ofλHm2O=479 nm
is close to the effective centre of the O4absorptions atλOm4=
476 nm.
The fit range was chosen to have similar effective centres of absorptions of O4and H2O in order to have comparable
conditions for radiative transfer at both wavelengths. HITEMP was chosen for the water vapour absorption cross section in the blue wavelength region. The differences in the blue wavelength region to HITRAN 2012 are negligi-ble at a spectral resolution of 0.5 nm. HITEMP was chosen instead of POKAZATEL in the blue wavelength range, as already a couple of previous publications used this cross sec-tion in the blue wavelength range (see, e.g., Lampel et al., 2015b, and references therein). As described in Sect. 4.12 better agreement with observations was found for HITEMP than for POKAZATEL from 452 to 499 nm.
3.3.2 The near-UV spectral range
In the analysed wavelength interval of 340–380 nm the ab-sorption structures of O4and H2O are centred aroundλOm4=
361 nm andλHm2O=364 nm.
As the observed OD in the fit ranges around 360 nm are small, except for the absorption of O4 and the OD related
to the Ring effect, it was necessary to include, in addition to the normal Ring spectrum, the temperature dependence of the Ring spectrum. The Ring spectrum itself compen-sates the measured apparent optical density due to inelas-tic scattering of sunlight on air molecules (Shefov, 1959; Grainger and Ring, 1962), which leads to an effective filling-in of Fraunhofer lfilling-ines filling-in the measured spectrum of scattered sunlight (e.g. Wagner et al., 2009, and references therein). The temperature dependence originates from the tempera-ture dependence of the population of rotational states of the air molecules. It was calculated from the difference of Ring spectraR(T )calculated atT =273 K andT =243 K using
DOASIS (which is based on the work from Bussemer, 1993, parts of which can also be found in Platt and Stutz, 2008):
1R/1T =(R(T −1T )−R(T ))/1T. The OD associated
with the Ring spectrum temperature dependence amounts up to 5×10⁻⁴for the M91 data set when using a Ring spectrum
calculated at 273 K. For a Ring signal of 2.5×1025 (which
height profile. The temperature dependence of the derivative of the Ring spectrum with respect to temperature was found to be smaller than 0.5 %/1 K; therefore, it was sufficient to use one individual spectrum to linearise this effect.
The contribution of vibrational Raman scattering of air on measurements in this spectral range not only could be corre-lated to the size of the Ring effect but also agreed in its mag-nitude with the calculations given in Lampel et al. (2015a). Its effect on the results presented here was, however, negligi-ble and was only consistently observed when co-adding spec-tra from more than four elevation sequences and for a rms of the resulting residuals of less than 1×10⁻⁴. The effect of the
wavelength dependence of the air mass factor (AMF) for the O4absorptions at 344, 361 and 380 nm was found to be
neg-ligible for the spectral retrieval of water vapour absorption in this spectral range.
4 Results and discussion
Starting with the largest absorption band below 380 nm listed in POKAZATEL at around 363 nm, we show first experi-mental evidence of water vapour absorption in the UV from LP-DOAS measurements (Sect. 4.1), which have the ad-vantage of a well-defined light-path length. These are com-plemented by an even clearer detection of this absorption band by MAX-DOAS observations (Sect. 4.2). The magni-tude of the absorption is quantified by comparison to wa-ter vapour absorption in the blue spectral range. From these results based on MAX-DOAS observations, a correction of the strength of the water vapour absorption band listed in POKAZATEL is derived. We then also estimated the mag-nitude of the weaker water vapour absorption bands to be at 335 nm (Sect. 4.6) and 373 nm (Sect. 4.7).
4.1 LP-DOAS: detection of water vapour absorption at 363 nm
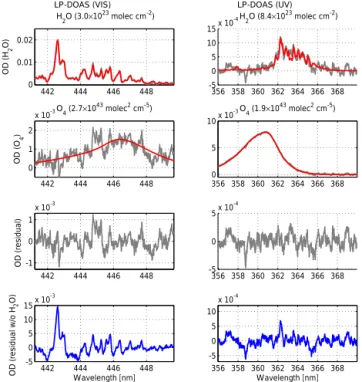
Measurements between 22 August and 24 September 2015 were used for this analysis, when optimal instrumental per-formance could be guaranteed. Measurement spectra were co-added in order to reduce the rms of the residual in the UV fit interval to values of 1.5±0.3×10⁻⁴along the total
light path of 6.12 km, which resulted in a time resolution of 2 h. This corresponds to an exposure time of about 15 min for each measurement spectrum. Due to the need to change the wavelength setting of the spectrometer between the different spectral windows around 440 and 360 nm, the time for each measurement sequence is shorter than the total time resolu-tion.
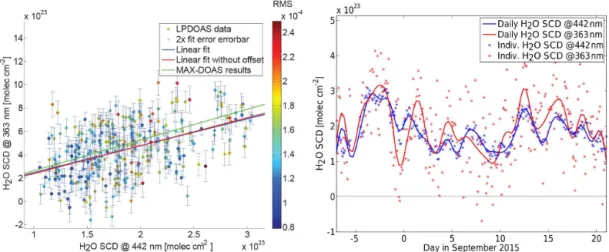
A weak correlation of the water vapour absorption around 363 nm to the absorption at 442 nm was found with a correla-tion coefficient ofR2=0.25 (Fig. 4) for individual
measure-ments. The rather weak correlation is due to the large indi-vidual measurement errors. This can be directly seen by the
442 444 446 448 0
0.01 0.02
LP-DOAS (VIS) H2O (3.0×10²³ molec cm-2)
O D ( H2 O )
442 444 446 448 0
1 2
x 10-3O4 (2.7×10
43 molec2 cm-5)
O
D
(
O4
)
442 444 446 448 -1
0 1
x 10-3
O D ( re s id u a l)
442 444 446 448 -5
0 5 10 15x 10
-3 Wavelength [nm] O D ( re s id u a l w /o H O ) 2
356 358 360 362 364 366 368 -5
0 5 10 15x 10
-4
LP-DOAS (UV) H2O (8.4×10²³ molec cm-2)
356 358 360 362 364 366 368 0
5 10x 10
-3O4 (1.9×1043 molec2 cm-5)
356 358 360 362 364 366 368 -5
0 5x 10
-4
356 358 360 362 364 366 368 -5
0 5 10
x 10-4
Wavelength [nm]
Figure 3. A LP-DOAS-fit result for the fitting intervals around
363 and 442 nm. The spectra were recorded on 29 August 2015 between 20:58 and 21:45 UTC. Top left panel: at 442 nm the H2O dSCD (3.0±0.04)×1023molec cm−2 (O4 dSCD (2.7±
0.6)×1043molec2cm−5). Top right panel: at 360 nm the H2O
dSCD(8.4±0.6)×1023molec cm−2(O4dSCD(1.85±0.03)×
1043molec2cm−5).
large variations from one measurement to the next in the time series shown in Fig. 4 on the right. For daily averaged val-ues the correlation amounts toR2=0.61. Further co-adding
of spectral measurement data could not reduce the measure-ment errors further, as systematic residual structures appear (see Fig. 3). Furthermore, large NO2concentrations of up to
20 ppb led to additional residual structures. Selecting mea-surement spectra according to the NO2concentration or rms
did not improve the correlation.
As the measurement period was in late summer with tem-peratures between 9 and 36◦C and relative humidity between 20 and 96 % leading to a water vapour VMR between 0.4 and 1.3 % (5–16.5 g m−3), low as well as high VMRs are not well represented in this data set. This increases the error in the correlation of water vapour column densities determined in both wavelength intervals (see Table 2). Linear regression yields a relative magnitude of the absorption near 363 nm of 2.31±0.25 and an offset of 1.6±4.5×10²²molec cm−2.
Fixing the offset to zero yields a scaling factor for the absorp-tion cross secabsorp-tion near 363 nm of 2.39±0.05. This means,
the POKAZATEL line lists underestimate the observed ab-sorptions near 363 nm by a factor of 2.39. The measurement
Figure 4.Left: correlation of H2O slant column densities (SCDs) from LP-DOAS measurements near 363 and 442 nm. Also shown is the
result from Table 3 line (1) from MAX-DOAS observations. Right: time series of H2O column densities from LP-DOAS measurements near 363 and 442 nm. Values near 363 nm were corrected by the scaling factor determined from the correlation plot on the left.
density near 363 nm. Thus, we estimate the overall scaling factor from LP-DOAS measurements to be 2.4±0.7.
4.2 MAX-DOAS: detection of water vapour absorption near 363 nm
The absorption of water vapour was detected at about 363 nm (27 548 cm−1) in measurements from ANT XXVIII/1-2 and M91, using a fit interval from 340 to 380 nm (26 316– 27 548 cm−1) according to Table 2. The maximum signal-to-noise ratio during both cruises (ratio between fitted H2O
dSCD and measurement error) were 14 and 10 (15 and 20, for 16 co-added elevation sequences). The corresponding dSCD values showed the typical separation for each elevation angle as observed for water vapour absorptions in the blue wave-length range. The corresponding spectra are shown in Fig. 5. The retrieved water vapour dSCDs at 363 nm were com-pared to the 20 times stronger water vapour absorptions be-tween 452 and 499 nm (20 040–22 124 cm−1) for the ANT XXVIII/1-2 data set. To correct for possible influences of varying radiative transfer conditions (which may result in dif-ferent light-path lengths and thus difdif-ferent dSCDs), the H2O
dSCDs retrieved from both spectral windows were divided by the respective O4 dSCD from the same fitting window.
These fitting intervals were selected in a way that the wave-length of the main absorptions of O4and H2O are at similar
wavelengths. This needs to be done in order to have approx-imately the same radiative transfer properties for both ab-sorbers (see Sect. 3.3.1). The wavelength ranges are listed in Table 2. The absorption of O4is an indicator for the
light-path length, since the O4concentration is proportional to the
square of the concentration of molecular oxygen, which has a well-defined and sufficiently constant concentration profile.
For Fig. 6, measurements at an elevation angle of 3–5◦ with an rms of less than 8×10⁻⁴(UV) and 4×10⁻⁴(VIS)
were used; in addition, the error of the H2O/O4 ratio
cal-culated from the fit errors of both trace gases had to be be-low 5×10⁻²¹cm3molec−1(UV) and 3×10⁻²²cm3molec−1
(VIS). This implicitly removes all measurements with low-O4 dSCDs, which is the case for fog and very low clouds.
These conditions lead to different numbers of valid observa-tions in Table 3 for different spectral retrieval settings.
The scale height of O4 is 4 km, the scale height of water
vapour is typically 2 km (Wagner et al., 2013). MAX-DOAS measurements of trace-gas dSCDs are most sensitive to the lowermost 2 km (e.g. Frieß et al., 2006). Thus, for a given surface volume-mixing ratio of water vapour, an almost con-stant ratio of H2O and O4dSCD is expected. Figure 6 shows
that this approximation is valid for the ANT XXVIII/1-2 measurements, as the correlation coefficientsR2for the
indi-vidual O4and H2O dSCDs are smaller (0.81 and 0.74) than
the correlation coefficientR2=0.89 for their ratio.
However, the different profile shapes can introduce devi-ations, which were investigated by radiative transfer mod-elling using the Monte Carlo radiative transfer model McAr-tim (Deutschmann et al., 2011). Assuming different water vapour surface concentrations (0.1–3 %), water vapour scale heights of 1, 2 and 3 km, an aerosol layer with an extinc-tion of 0, 0.2, 1, 2 and 10 km−1, with a thickness of 1 and 3 km at an altitude of 0, 1, 2 and 3 km were the resulting simulated H2O/O4 dSCD ratios correlate for both
wave-lengths 363 and 477 nm, with anR2=0.98 and a slope of
1.00±0.02. The intercept was fixed to zero, elevation
an-gles were 3,5,90◦and 6480 individual simulations were
per-formed. A significant systematic dependence of the ratios on ground albedo, solar zenith angle and relative azimuth an-gle was not observed, each of them resulting in less than a 1 % change of the simulated O4/H2O ratio. Simulations
with small O4dSCDs, which result in a large simulation
er-ror for the H2O/O4dSCD ratio, were removed analogously
460 470 480 490 0
2 4 6 8x 10
-3
ANT XXVIII (VIS) H
2O (6.3×10 23
molec cm-2)
O D ( H2 O )
460 470 480 490
0 5 10 15 20x 10
-3 O D ( O4 ) O 4 (2.5×10
43
molec2 cm-5)
460 470 480 490
-5 0 5
x 10-4
O D ( re s id u a l)
460 470 480 490
-4 -2 0 2 4x 10
-3 Wavelength [nm] O D ( re s id u a l w /o H O ) 2
340 350 360 370 380
-5 0 5 10 15x 10
-4
ANT XXVIII (UV) H
2O (1.1×10 24
molec cm-2)
340 350 360 370 380
0 5 10x 10
-3 O4 (2.2×1043 molec2 cm-5)
340 350 360 370 380
-5 0 5
x 10-4
340 350 360 370 380
-5 0 5 10
x 10-4
Wavelength [nm]
340 350 360 370
0 10 20
x 10-4 M91 (UV) H
2O (1.2×10 24
molec cm-2)
340 350 360 370
0 5 10 15x 10
-3 O4 (3.4×1043 molec2 cm-5)
340 350 360 370
-5 0 5
x 10-4
340 350 360 370
-1 0 1
x 10-3
Wavelength [nm]
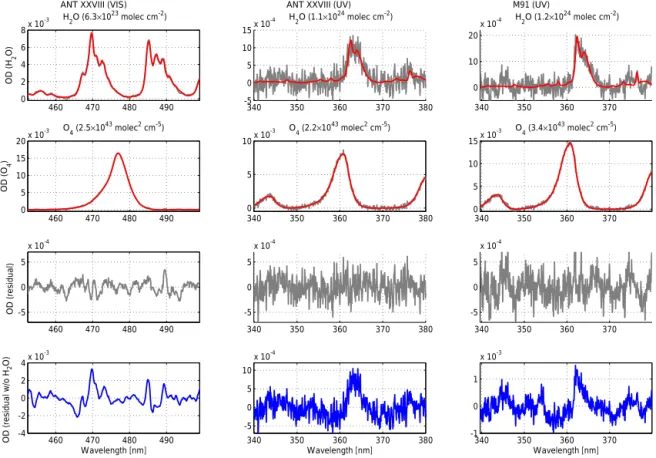
Figure 5.Fit results from ANT XXVIII/1-2 and M91 showing the detection of water vapour absorptions at 477 and 363 nm; in red, the
modelled absorptions according to the cross sections listed in Table 2; in grey, the measured values. In blue, the residual is shown if no water vapour absorption was included in the fit. The fits from ANT XXVIII/1-2 use a spectrum (exposure time: 120 s; spectral resolution: 0.7 nm) from 16 November 2011 at 13:20 UTC at 3◦59′06′′N, 14◦44′40′′W at a telescope elevation angle of 3◦. At 477 nm the O
4dSCD
is(2.47±0.01)×1043molec2cm−5and the H2O dSCD(6.27±0.06)×1023molec cm−2. At 360 nm the O4dSCD is(2.18±0.04)×
1043molec2cm−5, the H
2O dSCD(1.13±0.16)×1024molec cm2. The fit from M91 is using one spectrum (exposure time: 60 s; spectral
resolution: 0.45 nm) recorded on 5 December 2012, 19:44 UTC at 7◦24′29′′S, 81◦30′18′′W at a telescope elevation of 3◦. It shows an O
4
dSCD of(3.43±0.02)×1043molec2cm−5and a H2O dSCD of(1.18±0.16)×1024molec cm−2. All fits used the O4cross section by
Thalman and Volkamer (2013).
The Ångström exponent was varied using values of 0.0, 0.5 and 1.0 according to AERONET aerosol optical depth (AOD) measurements during ANT XXVIII/1 (Smirnov et al., 2009)2. The effect on the ratio was however also smaller than
1 %.
As for the measured data, the correlation of the simulated O4 or H2O dSCDs individually is significantly worse with
RO2
4=0.74 andR 2
H2O=0.91 compared to the correlation of
their respective ratios. The slope of a linear polynomial fit to the O4dSCDs at 360 and 470 nm is similar to the observed
values.
As seen from Fig. 6, the H2O/O4dSCD ratios from ANT
XXVIII/1-2 correlate well for the wavelength ranges around 360 nm and around 477 nm with an R2=0.89. However,
the absolute magnitude of the absorption cross section near
2http://aeronet.gsfc.nasa.gov/new_web/cruises_new/
Polarstern_Fall_11.html
363 nm is underestimated by a factor of 2.6±0.3 (see also
Table 3).
In Fig. 2 the ratios of H2O and O4dSCDs at 3◦telescope
elevation were converted to H2O vertical column densities
(VCDs) assuming a light path at ground level under normal conditions, a water vapour scale height of 2 km and using the correction factor of 2.6. Qualitatively the latitudinal
varia-tion of the ANT XXVIII/1-2 and GOME-2 data agree. For a quantitative comparison further radiative transfer modelling to obtain tropospheric water vapour profiles from the ship-based data would be needed.
The O4 cross section is known to change its shape with
changing temperature (Pfeilsticker et al., 2001; Thalman and Volkamer, 2013). As this effect could potentially introduce similar dependencies as the water vapour distribution, the spectral analysis was run in addition to the original analy-sis including two O4cross sections at 293 and 273 K. This
changed the slope of the correlation shown in Fig. 6 by
in-dSCD ratio H O/O @ 479 nm [cm molec ]2 4 3 -1 d S C D r a ti o H O /O @ 3 6 3 n m [ c m m o le c ] 2 4 3 -1 Q
363 = 2.63 Q479 + 1.64e-022
R2 = 0.89
0 0.5 1 1.5 2 2.5 3
x 10-20 -1 0 1 2 3 4 5 6 7 8
x 10-20
-2 -1.5 -1 -0.5 0 0.5 1 1.5 2 x 10-20 0 50 100 150 200 250 300 350 400
Residual of fit [cm3 molec-1]
dSCD ratio H O/O @ 363 nm [cm molec ]2 4 3 -1
N u m b e r Histogram Gauss-fit +- 2x DOAS fit error
O d S CD @ 3 6 1 n m [ m o le c c m ] 4 2 -5
O dSCD @476 nm [molec cm ] 4
2 -5 O
4 dSCD
O4
361 = 0.39 O4476 + 8.01e+042
R2 = 0.74
0 2 4 6 8 10 12
x 1043 0 1 2 3 4 5 6x 10
43 H2 O d S C D @ 3 6 3 n m [ m o le c cm -2]
H O dSCD @479 nm [molec cm ] 2
-2 H
2O dSCD
H
2O363 = 1.49 H2O479 - 2.96e+022
R2 = 0.81
0 2 4 6 8 10
x 1023 -2 0 2 4 6 8 10 12 14
x 1023 Nu
m b e r o f sp e ct ra 1 3 10 30
Figure 6.Top left panel: ratio of water vapour dSCD and O4dSCD at 363 and 479 nm for a telescope elevation angle of 3 and 5◦during ANT
XXVIII/1-2, using the O4cross section by Thalman and Volkamer (2013). Error bars represent typical measurement errors and are calculated from fit errors of both absorbers. Error bars for the ratios at 479 nm are omitted. They are more than 1 order of magnitude smaller than those at 363 nm. A ratio of 10−20cm3molec−1corresponds to an absolute water vapour-mixing ratio of 0.01 at ground level or a vertical column density of 5×10²²molec cm−2or 15 kg H2O m−2, assuming a scale height of 2 km. Top right panel: the residual of the linear fit shows
a Gaussian distribution and agrees with respect to its width ofσ=6.12×10⁻²¹cm3molec−1with the mean measurement error (2 times
DOAS fit error, 2.75±0.92×10⁻²¹cm3molec−1) obtained from the DOAS fit. The contribution of the statistical error of the linear fit is
negligible. The individual correlations of H2O and O4dSCDs are shown in the lower panels, which show individually smaller correlation
coefficients than their respective ratios at 363 and 479 nm.
Table 3.Results from Fig. 6 to determine the relative magnitude of the water vapour absorption at 363 nm compared to 477 nm, using the
HITEMP cross section for different retrieval settings using different O4cross sections. Values in brackets denote the error of the last digits of the respective value calculated from the error-weighted linear regression. For LP-DOAS measurements (see Sect. 4.1), the correlation was done for slant column densities (SCDs) instead of H2O/O4dSCD ratios because the light path was constant. The offset (LP-DOAS) was, however, normalised by the mean O4dSCD at 360 nm in order to have comparable values. The systematic error of the slope was determined
by using the typical relative measurement error of water vapour for measurements at a dSCD of 3×10²³molec cm−2determined in the
respective blue wavelength range.
Type O4cross section R2 Slope Syst. error [%] Offset [cm3molec−1] n
1 MAX-DOAS Thalman 273 K 0.89 2.63(1) 8 0.16(4)×10−21 2621
2 MAX-DOAS Thalman 273 K free shift 0.88 2.61(1) 8 0.34(4)×10−21 2634
3 MAX-DOAS Thalman 273+293 K 0.83 2.39(1) 8 7.25(5)×10−21 2562
4 MAX-DOAS Hermans 0.86 2.62(1) 8 4.22(4)×10−21 2630
5 MAX-DOAS Greenblatt 0.84 2.55(1) 9 21.1(1)×10−21 2183
6 MAX-DOAS Greenblatt (shifted by 0.2 nm) 0.89 2.58(1) 11 10.1(1)×10−21 2586
crease is observed for the offset of the linear fit, which should be ideally zero. Fixing the linear regression line for high water vapour content at the observed values, this in-crease in the offset of the linear fit corresponds to the ob-served change in the slope. We therefore conclude that the observed absorption structure is not caused by the tempera-ture dependence of the O4absorption cross section, but
in-deed by water vapour absorption, as this offset is observed in polar regions, where almost no water vapour absorption is expected. Note that this offset is still small and amounts to 10 % (7.25×10⁻²¹cm3molec−1) of the observed maximum
ratio of H2O/O4dSCDs shown in Table 3.
A spectral shift of the O4literature cross section can
effec-tively compensate parts of the water vapour absorption cross section at 363 nm. This is discussed in Sect. 4.5. However, stable results were even obtained when the shift of the set of literature cross sections was determined by the Levenberg– Marquardt algorithm of the DOAS fit, as shown in the second row in Table 3.
As seen from Table 3, the resulting slopes from Fig. 6 agree within their respective errors for different O4cross
sec-tions. The O4absorption by Greenblatt et al. (1990) shows a
systematic shift for the absorption at 360 nm and was there-fore analysed once with the original wavelength calibration and once shifted by 0.2 nm (used e.g. in Pinardi et al., 2013). The results of the shifted O4cross section include more
mea-surements but still show a significant offset of the linear re-gression. The results using the Hermans et al. (1999) O4
cross section seem more reliable, as more data points can be used and the offset of the slope is smaller. The most consis-tent results are obtained when using the O4cross section by
Thalman and Volkamer (2013), showing a small offset and the highest correlation coefficient.
4.3 Differences using different dipole moment surfaces The POKAZATEL line list employs the DMS from Lodi et al. (2011), while the POKAZATEL (CVR, core valence relativistic) line list employs the DMS from Lodi et al. (2008), using the same PES. This leads to significant dif-ferences in the intensities of the resulting line lists in the near-UV spectral region. The magnitude of the absorption between 362 and 365 nm in POKAZATEL (CVR) is on av-erage 2.9 (ranges between 2.3 and 4.6) times larger than in POKAZATEL, and might therefore explain the observed discrepancy in the magnitude of the cross section shown in Sect. 4.2. However, the shape of the absorption band in the atmospheric measurements is significantly better predicted by POKAZATEL. Fitting POKAZATEL (CVR) to measured spectra from M91 leads to 20 % higher rms for the residual (see Fig. 7) at low-elevation angles. The additional absorp-tion structures around 354 nm listed in POKAZATEL (CVR) are not found in observations (cf. Fig. 10). These findings are consistent with the spectral analysis of data from ANT XXVIII/1-2.
340 350 360 370 380
0 5 10
x 10-4
O
p
ti
c
a
l de
n
s
it
y
POKAZATEL
(8.3×10²³ molec cm-2)
340 350 360 370 380
0 5 10
x 10-4
POKAZATEL CVR
(2.5×10²³ molec cm-2)
340 350 360 370 380
-4 -2 0 2
4x 10
-4
Wavelength [nm]
O
D
(
re
s
id
u
a
l)
340 350 360 370 380
-4 -2 0 2
4x 10
-4
Wavelength [nm]
Figure 7.Two MAX-DOAS fits of the same measurement
spec-trum from M91 showing the detection of water vapour absorptions at 363 nm using two different DMSs (see Sect. 4.3). In order to re-duce residual noise, the fit is using four spectra with a total exposure time of 240 s recorded on 22 December 2012, starting at 17:59 UTC at 15◦31′S, 75◦36′W at a telescope elevation of 3◦. The TEL (CVR) line list shows a 20 % larger residual than POKAZA-TEL, whose shape fits the observed optical density better.
POKAZATEL (CVR) also predicts water vapour absorp-tion between 330 and 360 nm, which should be above our detection limit. These could however not be identified for ei-ther of the two POKAZATEL nor the BT2 line lists during the M91 cruise (see also Sect. 4.6).
4.4 Comparison to other line lists
As shown in Fig. 1, other water vapour line lists also contain lines in the spectral range below 390 nm, which should be theoretically above typical detection limits of our measure-ments (often better than 10−4 along a light path of 10 km). However, in this spectral range BT2 and HITEMP are based on calculations only and have not yet been confirmed by laboratory or atmospheric measurements. The absorption at 380 nm should be clearly above the detection limit of the in-strument used during M91, but as reported in Lampel et al. (2015b), it was not unambiguously found and showed incon-sistencies. These two line lists show further absorption lines between 330 and 360 nm, which could also not be identified in Lampel et al. (2015b).
Fitting simultaneously a cross section based on POKAZA-TEL and a cross section based on HITEMP or BT2 to the measurements (M91), the optical density (from 340 to 380 nm) attributed to BT2 and HITEMP remained below
(3±12)and(2±8)%, respectively, of the optical density
re--80 -60 -40 -20 0 20 40 60 -50
0 50 100 150 200 250 300
S
h
if
t
[p
m
]
Latitude [°] O
4 shift without H2O XS
O4 shift with H2O XS Instrument calibration
Figure 8.Error-weighted daily averaged DOAS-fit results for the
shift of the O4 cross section for measurements with a signal-to-noise ratio for the O4dSCD of more than 50. For this evaluation, the shift of the O4cross section was freely determined by the DOAS fit and not linked to the other absorption cross sections. Error bars de-note the standard deviation during 1 day. The shift of the instrumen-tal calibration was determined from the fit of the measured spectra to data from a convolved solar atlas.
spectively, while the POKAZATEL cross section showed ab-sorptions of(4.5±4.3)×10−4for all spectra at all elevation
angles of the M91 data set with an rms of the residual of less than 4×10⁻⁴.
These findings demonstrate that the shape of the wa-ter vapour absorption appears to be betwa-ter predicted in the POKAZATEL line list than in the BT2 and the HITEMP line list. For HITEMP this was expected, since HITEMP is partly based on BT2, but the individual line intensity cut-off leads to changes in absorption-band shape and the significantly smaller water vapour absorption cross section in HITEMP compared to BT2 as shown in Fig. 1.
4.5 Compensation of H2O absorption by O4absorption
near 363 nm
Since the water vapour absorption is found at the red flank of the O4absorption band at 361 nm, the absorption can be
partly compensated by shifting the O4 absorption band
to-wards longer wavelengths. This effect is more clearly ob-served for the ANT XXVIII/1-2 data set than for the M91 data set, due to the lower spectral resolution, which seems to match better the widths of the spectral absorption structures of O4.
When evaluating the ANT XXVIII/1-2 data set using the same settings as listed above in Table 2, but allowing for a spectral shift of the O4cross section by Thalman and
Volka-mer (2013), a systematic shift of the O4cross section of up
to 0.20 nm relative to a Fraunhofer reference calibrated using the solar atlas of Chance and Kurucz (2010) is observed in
tropical regions (shown in Fig. 8). A systematic shift of the O4cross section of up to 0.15 nm relative to a freely shifting
O4cross section from a fit including the POKAZATEL water
vapour absorption cross section is observed. When the water vapour absorption is included, the free shift of the O4cross
section shows a standard deviation of 0.035 nm for measure-ments with a signal-to-noise ratio of more than 50 for the O4
dSCD. The instrument calibration shows a standard deviation of 0.007 nm due to a slow drift of 0.3 pm d−1.
It was found that a small shift of O4with temperature (e.g.
0.05 nm as in Thalman and Volkamer (2013) from 273 to 293 K) cannot explain the apparent shift of the O4
absorp-tion when not considering the water vapour absorpabsorp-tion. As described in Beirle et al. (2013), a spectral shift can be linearised for small shifts by the derivative of the ab-sorption cross section with respect to the wavelength using Taylor expansion. Turning the argument around, a correla-tion of the size of the absorpcorrela-tion structure of water vapour and the product of O4 absorption and spectral shift (from
a DOAS fit where water vapour absorptions are not con-sidered) is therefore expected. This correlation is found for ANT XXVIII/1-2 data withR2=0.89 and a slope ofaS=
6.78×10¹⁸nm molec cm−3. For this instrument with a
spec-tral resolution of 0.7 nm, it thus means effectively that a wa-ter vapour dSCD ofSH2O=5×10²³molec cm−2and an O4
dSCD ofSO4=2.5×1043molec2cm−5lead to a shift of the
O4cross section byaS·SH2O/SO4=0.14 nm, which was
in-deed observed in tropical regions as shown in Fig. 8. The change in overall O4dSCD is discussed in Sect. 4.11.
4.6 Upper limit for water vapour absorption at 335 nm The water vapour absorption band at 335 nm in the POKAZATEL line list would amount to an OD of 1.2×10⁻⁴
for a water vapour dSCD of 4×10²³molec cm−2at a spectral
resolution of 0.5 nm.
Analogous to the procedure described in Sect. 4.2, the wa-ter vapour absorption band at 335 nm (fit range 332–358 nm) was compared to the water vapour absorption within the in-terval from 452 to 499 nm for the ANT XXVIII/1-2 measure-ments, divided by the dSCD of the respective O4absorption
band. A clear correlation was not observed (R2<0.2) due
to too large fit errors to detect water vapour in the BrO– HCHO fit range (for fit settings see Table 2). The water vapour dSCD (at 335 nm) stayed below the average detec-tion limit of 7×10²³molec cm−2.
For the M91 MAX-DOAS measurements, the detection limit was reduced by co-adding 16 elevation sequences. However, the correlation of water vapour dSCDs at 335 and 442 nm was small (R2=0.2) and the 2σ detection limit of
6.5×10²³molec cm−2 was only exceeded for 10 % of all
spectra.
the shape of the water vapour absorption is correctly pre-dicted by POKAZATEL, the magnitude of the differen-tial water vapour cross section from 332 to 358 nm at a spectral resolution of 0.45–0.70 nm is smaller than 2.5×
10−28cm2molec−1.
4.7 Water vapour absorption around 376 nm
The literature values for the water vapour absorption cross sections based on POKAZATEL and BT2 (and thus also HITEMP) differ by about 1 order of magnitude in the spec-tral region between 370 and 380 nm (cf. Fig. 1). Using the M91 MAX-DOAS measurements the absorptions listed in BT2 could not be unambiguously identified or its predicted absorption shape did not match the observed absorptions. We therefore apply here the POKAZATEL line list on data from the M91 campaign.
We use a fit range from 370 to 386 nm and the settings for the water vapour absorption at 363 nm without consid-ering the absorption cross section of O3, HONO, BrO and
HCHO. Co-added spectra based on four elevation sequences were used in order to reduce the average fit error to 2×
1023molec cm−2(average rms of the residual: 1.1×10⁻⁴). The water vapour dSCD was compared to the water vapour dSCD from 340 to 380 nm, retrieved in Sect. 4.2. The result-ing correlation of dSCDs at 363 and 376 nm is significant withR2=0.6 and a slope of 1.2±0.3. A DOAS-fit result
is shown in Fig. 9. As both absorption bands are at similar wavelengths and the absorptions are small, the difference in expected dSCDs introduced by differences in radiative trans-fer are negligible compared to the measurement error itself.
This shows that the water vapour absorptions at 376 nm is found in MAX-DOAS measurements and its magnitude is predicted in agreement with the absorption at 363 nm. It underestimates the absorption inferred from measurements by a factor of 3.1±0.7.
4.8 Water vapour absorption below 330 nm
Du et al. (2013) reported significant water vapour absorp-tions of up to 2.94×10⁻²⁴cm2molec−1at 330 nm and up to
2.19×10⁻²⁴cm2molec−1at around 315 nm. Lampel et al.
(2015b) could not confirm these findings and found upper limits for the differential absorption of water vapour from 332 to 370 nm of 3×10⁻²⁷cm2molec−1from the M91 data
set, which are 2 orders of magnitude smaller. Wilson et al. (2016) also could not confirm the values published by Du et al. (2013) between 325 and 420 nm. They estimated the water vapour absorption cross section at a spectral resolution of 0.5 nm to be less than 2×10⁻²⁵cm2molec−1.
For a water vapour dSCD of 4×10²³molec cm−2, the
find-ings of Du et al. (2013) would result in differential optical depths around unity, which is unrealistic judging from obser-vations of BrO and HCHO in the troposphere in wavelength intervals within 330–360 nm (see references listed in Vogel
370 375 380 385
0 2 4
x 10-4
O
p
ti
c
a
l de
n
s
it
y
POKAZATEL H2O (9.8×10²³ molec cm-2)
3700 375 380 385
2 4
x 10-3 O4
(2.0×1043 molec2 cm-5)
370 375 380 385
-2 0 2
x 10-4
Wavelength [nm]
O
D
(
re
s
id
u
a
l)
370 375 380 385
-2 0 2
x 10-4
Wavelength [nm]
O
D
(
re
s
id
u
a
l
w
/o
H
O
)
2
Figure 9.Fit result for the same MAX-DOAS spectrum as that used
in Fig. 7 to show the water vapour absorption at 376 nm, which cor-relates for the M91 data set withR2=0.6 and a slope of 1.2±0.3,
with the water vapour absorption at 363 nm. The measurement error of this individual fit amounts to 20 %.
et al., 2013 and Pinardi et al., 2013). The instrument oper-ated during ANT XXVIII/1-2 covers a wider spectral range than in Lampel et al. (2015b), we therefore applied the BrO– HCHO fit settings from Table 2 to a fit interval from 310 to 350 nm. We used the water vapour dSCD determined from POKAZATEL at 363 nm of 4.3×10²³molec cm−2 for the
spectrum from ANT XXVIII/1-2 shown in Fig. 5. For the calculation of the upper limit, we used conservatively only half of the value of the dSCD in order to account for the shorter light path at wavelengths between 310 and 350 nm. Polynomials with degree 0–2 were applied in the fit in or-der to account for broadband absorptions and scattering, and to estimate the dependence of the inferred upper limits on the degree of the DOAS polynomial. The polynomial could compensate for water vapour absorption if it is a rather broad absorption in this spectral region as suggested by Du et al. (2013). The resulting peak-to-peak (ptp) magnitudes of the residual are listed for an example measurement spectrum at 3◦ elevation angle in Table 4. To avoid unnecessary com-pensation of potential water vapour absorption by other ab-sorbers, their dSCDs were determined using a DOAS poly-nomial of the third order, then the dSCDs of the trace gases in the fit were fixed to these values.
Table 4. Magnitude peak-to-peak (ptp) residual sizes and upper
limits for water vapour absorption between 310 and 350 nm at a spectral resolution of 0.7 nm for different polynomial degrees of the DOAS polynomial.
Polynomial ptp residual Upper limit diff. H2O XS
degree cm2molec−1
0 3.0×10⁻³ 14.0×10⁻²⁷
1 1.6×10⁻³ 5.4×10⁻²⁷
2 1.0×10⁻³ 4.6×10⁻²⁷
4.9 Estimation of the accuracy of the shape and wavelength calibration of the POKAZATEL H2O
cross section
The DOAS fit provides dSCDs as mentioned above, but also residual spectra.
These residual spectra are the difference between the mod-elled and the observed OD (cf. Fig. 5). In order to disentangle different contributions to the residual spectra, a multi-linear regression was performed based on the retrieved dSCDs (see Lampel et al., 2015a). This allows for the systematic identifi-cation of residual structures caused by each of the absorbers considered in the fit (cf. Table 2). However, since potential differences between modelled and observed absorptions can be compensated by any of the other absorbers, this informa-tion cannot be used to correct a given absorpinforma-tion cross sec-tion. It can though yield an estimate of the accuracy of the cross section.
For ANT XXVIII/1-2, the resulting spectrum from 340 to 380 nm, which correlates with the wa-ter vapour dSCD (shown in Fig. 10) has an rms of 1.7×10⁻²⁸cm2molec−1 and a maximum peak-to-peak
amplitude of 1.1×10⁻²⁷cm2molec−1. The maximum
mag-nitude of water vapour absorption cross section at 363 nm is 2.5×10⁻²⁷cm2molec −1 for this spectral resolution (see
Fig. 1). For M91, a residual structure at 344 nm is found, which could not be attributed to other absorbers and is correlated with the water vapour dSCD. The variation of humidity during M91 is significantly less than during ANT XXVIII/1-2; therefore, this structure could have been caused by any tropospheric absorber with a similar concentration height profile. As this residual structure is not observed for both data sets, we do not attribute it to water vapour absorption.
The maximum absorption of water vapour at 363 nm ac-cording to POKAZATEL seems to be re-shifted by 0.5 nm relative to the maximum absorption listed in BT2 (see inset in Fig. 1). To test if the wavelength of the water vapour absorp-tion is correct, a spectral shift of the water vapour absorpabsorp-tion was allowed; i.e. the shift was determined by the Levenberg– Marquardt algorithm of the DOAS fit. As the spectral reso-lution is higher, this was done for the M91 measurements.
The shift of the POKAZATEL water vapour absorption was found to agree with observations within 0.02±0.06 nm
(cor-responding to 1.5±4.6 cm−1) for measurements exceeding a signal-to-noise ratio for the water vapour dSCD of 5 for the 16 elevation sequence co-added M91 data sets. This result is in agreement with the estimate of the precision of the PES by Polyansky et al. (2017), which was able to reproduce energy levels from laboratory measurements within about 0.1 cm−1 on average.
4.10 Further potential error sources
As the observed OD for water vapour absorption were small in the UV (< 2 % for individual absorption lines at high spec-tral resolution), no saturation correction (Wenig et al., 2005) was applied during convolution of the line list for the spec-tral retrieval of MAX-DOAS data. The POKAZATEL line list does not provide line broadening parameters; therefore, theI0correction (Platt et al., 1997) also was not applied. This
correction would have resulted in a change of the convolved cross section of less than 5 %.
In the visible (452–499 nm), the saturation effect for dSCD of 6×10²³molec cm−2amounts to less than 2 % change of
the obtained dSCD.
4.10.1 Uncertainties of the H2O literature cross
sections in the blue wavelength range
Since we compared the UV absorptions of H2O vapour to
the values derived in the blue spectral region, the errors in the latter spectral region, which we analyse in the following, enter into the calculation of the total uncertainty of the UV absorption cross sections of H2O.
The uncertainty of the absolute magnitude of water vapour cross section (HITEMP) in the blue wavelength from 452 to 499 nm is less than 15 %: The 6ν absorption band around
490 nm seems to be overestimated by (13±3)% relative
to the 6ν+δ absorption band around 470 nm when fitting
the absorption bands separately analogously to Lampel et al. (2015b). This is one of the main reasons for the strongly structured fit residual in the visible fit range shown in Fig. 5. The magnitude of the 6ν+δ absorption band around
470 nm agreed with the magnitude of the 7νabsorption band
around 440 nm according to LP-DOAS measurements by Lampel et al. (2015b), for which in turn an agreement within 10 % with independent measurements of humidity and tem-perature was found in the same publication.
4.10.2 Uncertainties of the O4literature cross sections
For constant atmospheric water vapour content, water vapour and O4dSCDs from MAX-DOAS observations are typically
well correlated because the bulk of the variations in the H2O
Figure 10.Using a multi-linear regression on the residual spectra from the campaigns ANT XXVIII/1-2 and M91, the water vapour
dSCD-correlated residual structures were obtained. Negative values can be explained by compensation of the missing water vapour absorption structures by other absorbers included in the DOAS fit. The resulting spectrum, including water vapour absorption, yields an estimate on the accuracy of the convolved cross section.
section. The three available O4 cross sections for the
spec-tral range below 400 nm were published by Greenblatt et al. (1990), Hermans et al. (1999) and Thalman and Volkamer (2013). The POKAZATEL water vapour line list shows a lo-cal maximum at 363 nm (at a spectral resolution of 0.45 nm), which is at the slope of the O4absorption peak at 360.8 nm
(see Fig. 1).
Differences in differential OD from 340 to 390 nm be-tween different literature O4cross sections amount to up to
2×10⁻³for a typical dSCD of O4of 4×1043molec2cm−5.
This is larger than the OD of water vapour in this spectral range as listed in POKAZATEL. A systematic error in the re-spective O4cross section, which could lead to false apparent
water vapour absorption, is expected to scale with the col-umn density of O4. It would thus result in a constant offset of
the correlation of H2O/O4ratios shown in Fig. 6. This was
not observed. This also agrees with the observation that the wavelength dependence of the O4dSCDs was found to have
no result on the water vapour dSCD at 363 nm. Thalman and Volkamer (2013) stated an absolute accuracy of 2–4 % for the their integrated O4 absorption cross section at 361 and
476 nm.
For strong absorbers, the AMF of the observation also de-pends on the magnitude of the absorption itself (Marquard et al., 2000; Puk¯ıte et al., 2010). However, for an optical den-sity of O4at 360.8 nm of 2.5×10⁻³we estimate a reduction
of the effective light path by less than 1.3 %. This is an OD
of less than 3.5×10⁻⁴and would result in a reduction of the
apparent water vapour dSCD by 10 %. This effect would be smaller by a factor of 4 in tropical regions due to a smaller contribution of the O4 absorption to the total optical depth.
No correlation of the water vapour dSCDs at 363 nm with the square term of the O4absorption was found for the ANT
XXVIII/1-2 data set.
The differences between the cross sections published by Thalman and Volkamer (2013), Greenblatt et al. (1990) and Hermans et al. (1999) did not allow to identify any system-atic differences similar to the water vapour absorption, which could have pointed towards water vapour contamination dur-ing the acquisition of the cross section data.
As seen in Table 3, it was possible to observe good cor-relations for water vapour absorption at 363 nm and around 477 nm for all available O4 literature cross sections. The
smallest offset is observed when using the O4cross section
by Thalman and Volkamer (2013). The best correlation coef-ficientsR2are found for Thalman and Volkamer (2013) and
Hermans et al. (1999).
Absolute maximum O4 absorption cross section values
differ for the three available cross sections at 293 K by less than 7 % at 360 nm and less than 5 % at 477 nm. This un-certainty could directly affect the H2O/O4 ratios listed in