Service Use Based on a Nationally Representative Survey
Ann L. Montgomery1*, Usha Ram1,2, Rajesh Kumar3, Prabhat Jha1,4, for The Million Death Study Collaborators"
1Centre for Global Health Research, Li Ka Shing Knowledge Institute, St. Michael Hospital, Toronto, Ontario, Canada,2International Institute for Population Sciences, Mumbai, India,3School of Public Health, Post Graduate Institute of Medical Education, Chandigarh, India,4Dalla Lana School of Public Health, University of Toronto, Toronto, Ontario, Canada
Abstract
Background:Data on cause-specific mortality, skilled birth attendance, and emergency obstetric care access are essential to plan maternity services. We present the distribution of India’s 2001–2003 maternal mortality by cause and uptake of emergency obstetric care, in poorer and richer states.
Methods and Findings:The Registrar General of India surveyed all deaths occurring in 2001–2003 in 1.1 million nationally representative homes. Field staff interviewed household members about events that preceded the death. Two physicians independently assigned a cause of death. Narratives for all maternal deaths were coded for variables on healthcare uptake. Distribution of number of maternal deaths, cause-specific mortality and uptake of healthcare indicators were compared for poorer and richer states. There were 10 041 all-cause deaths in women age 15–49 years, of which 1096 (11.1%) were maternal deaths. Based on 2004–2006 SRS national MMR estimates of 254 deaths per 100 000 live births, we estimated rural areas of poorer states had the highest MMR (397, 95%CI 385–410) compared to the lowest MMR in urban areas of richer states (115, 95%CI 85–146). We estimated 69 400 maternal deaths in India in 2005. Three-quarters of maternal deaths were clustered in rural areas of poorer states, although these regions have only half the estimated live births in India. Most maternal deaths were attributed to direct obstetric causes (82%). There was no difference in the major causes of maternal deaths between poorer and richer states. Two-thirds of women died seeking some form of healthcare, most seeking care in a critical medical condition. Rural areas of poorer states had proportionately lower access and utilization to healthcare services than the urban areas; however this rural-urban difference was not seen in richer states.
Conclusions: Maternal mortality and poor access to healthcare is disproportionately higher in rural populations of the poorer states of India.
Citation:Montgomery AL, Ram U, Kumar R, Jha P, for The Million Death Study Collaborators (2014) Maternal Mortality in India: Causes and Healthcare Service Use Based on a Nationally Representative Survey. PLoS ONE 9(1): e83331. doi:10.1371/journal.pone.0083331
Editor:Zulfiqar A. Bhutta, Aga Khan University, Pakistan
ReceivedApril 27, 2013;AcceptedNovember 1, 2013;PublishedJanuary 15, 2014
Copyright:ß2014 Montgomery et al. This is an open-access article distributed under the terms of the Creative Commons Attribution License, which permits unrestricted use, distribution, and reproduction in any medium, provided the original author and source are credited.
Funding:The authors have no support or funding to report.
Competing Interests:The authors have declared that no competing interests exist.
* E-mail: [email protected]
"Membership of the Million Death Study Collaborators is provided in the Acknowledgments.
Introduction
India contributes one-fifth of the global burden of absolute maternal deaths; however, it has experienced an estimated 4.7% annual decline in maternal mortality ratio (MMR) [1,2], and 3.5% annual increase in skilled birth attendance since 1990 [1,3]. While not on track to meet Millennium Development Goal number 5, India is making progress in reducing maternal mortality [2].
Within India, there is marked variation in MMR and healthcare access between regions and in socioeconomic factors [3,4]. Understanding the distribution related to cause-specific mortality, and access to obstetric service indicators (routine skilled birth attendance and emergency obstetric care) is essential to improve maternal health.
In this study, we report on the maternal deaths in India’s Sample Registration System (SRS). The SRS, with verbal autopsy, was used to estimate the national and regional distribution of
maternal death and uptake of obstetric service indicators among women who died while pregnant or postpartum.
Methods
Study design
The MDS is an on-going nationally representative survey organized by the Registrar General of India (RGI). It is designed to determine the causes of death and risk factors of death. The design, methodology, and preliminary findings of the MDS have been described elsewhere [5–9]. In brief, the MDS uses an enhanced version of verbal autopsy (known as the routine, reliable, representative, re-sampled household investigation of mortality
with medical evaluation or RHIME) to monitor a nationally
close-acquaintance of the deceased to obtain the symptoms and events around the death using structured questions and a local language narrative guided by a specific symptom list. These records were converted into electronic records and emailed to two of 130 trained physicians who, independently and anonymously, assigned an underlying cause of death (with allocation determined randomly based only on the physicians ability to read the local language), using guidelines for the major causes of obstetric and other deaths [10]. Records were assigned cause of death in three-digit International Classification of Diseases and Related Health Problems, 10th revision (ICD-10) [11]. Records where coders disagreed on the cause of death underwent anonymous reconcil-iation. Continuing disagreements were adjudicated by a third senior physician. Five percent of households were randomly resurveyed and the results were consistent within categories of ICD-10 codes.
Maternal deaths: All verbal autopsies forms with an affirmative
answer to any of three questionsWas the deceased pregnant, 42 day
post-abortion, or 42 days post-partum? or that had been assigned an
ICD-10 O-code (obstetric causes) were translated into English from 14 languages. All ICD-10 codes were reviewed by a central consensus panel, as described elsewhere [12]. Events, such as timing of the woman’s death and use of health services were coded by one of the authors (ALM) from the open-ended narrative using the validated Maternal Data Extraction Tool (M-DET) [13]. The
following terms define the pregnancy period: term ($7 months
gestation), intrapartum period (onset of contractions-,24 hours
postpartum), and postpartum ($24 hours-6 weeks post-delivery).
World Health Organization (WHO) definitions of maternal deaths and categorization of maternal death were used [14]. This categorization was compared to earlier results reporting cause-specific maternal mortality using the same SRS dataset [1]. A maternal death is the death of a woman while pregnant or within 42 days of termination of pregnancy, irrespective of the duration and the site of the pregnancy, from any cause related to or aggravated by the pregnancy or its management, but not from accidental or incidental causes. Direct obstetric deaths are those resulting from obstetric complications of the pregnancy state (pregnancy, labour and the puerperium), from interventions, omissions, incorrect treatment, or from a chain of events resulting from any of the above. Indirect obstetric deaths are those resulting from previous existing disease or disease that developed during pregnancy and which was not due to direct obstetric causes, but which was aggravated by physiologic effects of pregnancy.
The following terms define obstetric care indicators:primary care
provider is the initial care provided to the woman for routine
delivery or therapeutic abortion; community consultation is seeking
healthcare in the community from a doctor, midwife or
pharmacist in response to the onset of a complication; planned
place of birth/abortionis place that care is sought at onset of labour/
abortion;health-facilityrefers to any centre with admission capacity;
emergency obstetric care refers to community consultation and/or
health-facility admission; and highest healthcare uptake refers to
ranking of the healthcare sought at any time the complication arose - routine admission to health-facility/hospital for abortion or labour, emergency admission for complication, community consultation for complication, and no facility-based healthcare utilization at time of complication. Emergency obstetric care is a proscribed set of indicators of staff skills, equipment, and supplies available 24 hours a day [15]. We have included community consults as uptake of emergency obstetric care as some of these indicators could have been provided on an out-patient basis, without admission to a health-facility (e.g. intravenous antibiotics, manual removal of placenta or retained products of conception).
We used the RGI categorization of Indian poorer states, which have high-fertility, and maternal and infant mortality (also referred to as Empowered Action Group states and Assam consisting of: Assam, Bihar, Chhattisgarh, Jharkhand, Madhya Pradesh, Orissa, Rajasthan, Uttar Pradesh, and Uttarakhand). Richer states are the remaining states and territories of India [16].
Statistical analysis
All proportional estimates account for weighting for sampling probability. Variance estimations were calculated using Taylor series linearization for the survey subpopulation of maternal deaths [17]. Rao-Scott Chi squared test for independence was used to compare differences in regional distribution (poorer versus richer states) [17] and an a priori analysis of obstetric care indicators (skilled birth attendance, planned health-facility birth, community consultation, and emergency obstetric care) was conducted between rural and urban areas of both poorer and richer states.
We estimated the number of maternal deaths and distribution of MMR by region and cause-specific mortality using the propor-tionate distribution of the survey-weighted sample, 2004–2006 SRS maternal mortality ratio estimates, and the United Nations Population Division estimates of live births and deaths in India in 2005 [18]. The 2005 UN death estimates were used so as to correct for the slight undercounts reported in the total death rates in the SRS [19,20] and to account for the 12% of enumerated deaths without completed field visits (mostly due to out-migration of the family or from incomplete field records). The proportion of these missed deaths was similarly dispersed across sex, age, and states. Use of 2003 or 2004 UN death totals yielded nearly identical results (data not shown).
The proportion of missing data were imputed using multiple imputation by chained equations, and the distribution of observed versus imputed datasets were compared [21,22]. All results presented here are observed results, and observed versus imputed results are presented in a Web Appendix S1.
All analyses were conducted using Stata/SE (StataCorp. 2011. Stata Statistical Software: Release 12. College Station, TX: StataCorp LP).
Ethics
SRS enrolment is on a voluntary basis, and its confidentiality
and consent procedures are defined as part of the Registration of
Births and Deaths Act, 1969. Verbal consent was obtained in the first
SRS sample frame. The new SRS sample obtains written consent at the baseline. Families are free to withdraw from the study. The study poses no or minimal risks to enrolled subjects. All personal identifiers present in the raw data are anonymized before analysis. The MDS study using this SRS data has been approved by the review boards of the Postgraduate Institute of Medical Education and Research, Chandigarh, India and St. Michael’s Hospital, Toronto, Canada.
Results
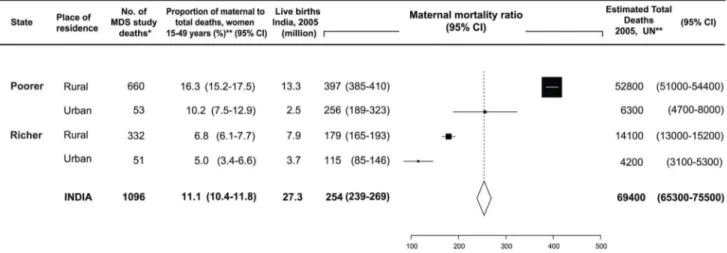
We estimated 69 400 maternal deaths in India in 2005. Three-quarters of maternal deaths were clustered in rural areas of poorer states (estimated total maternal deaths 52 800), whereas these regions have only half the estimated live births in India (13.3 million births). The proportion of maternal deaths to all-cause deaths in women, 15–49 years, was three times higher in rural areas of poorer states (16.3%) compared to urban areas of richer states (Figure 1).
Half the maternal deaths were in the age range of 20–29 years, with a median age of 26 years (interquartile range 21–32 years), with no significant difference noted between poorer and richer
states. Adolescent women (#18) represented 6.0% (95%CI 4.4–
7.6) of maternal deaths, and adolescent maternal deaths were not significantly over-represented in a single religious group, or rural versus urban areas (data not shown). The proportion of non-literate women was significantly higher for maternal deaths in poorer versus richer states (72.3% versus 46.1%) (Table 1).
Cause of death
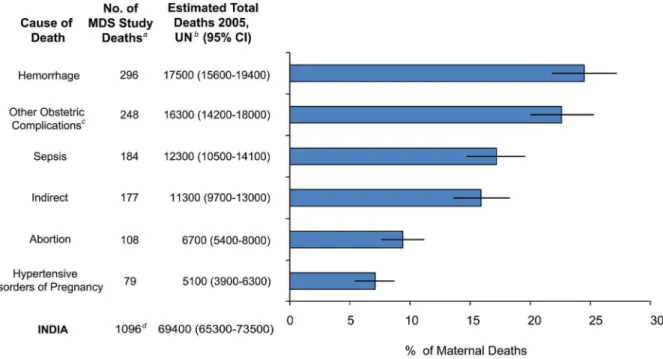
There were no differences in the major causes of maternal deaths between poorer and richer states, or between rural and urban areas (data not shown). Most maternal deaths were attributed to direct obstetric causes (81.8%, n = 919) (Table 2 and Figure 2).
One-quarter of maternal death were due to obstetric hemor-rhage (n = 296), with most deaths occurring in the intrapartum period (n = 258). One-quarter of maternal deaths were due to ‘other obstetric complications’ (n = 248), which included ill-defined cause of death in labour (n = 125) and the antenatal and postpartum period (n = 81). Fifteen per cent of maternal deaths were due to indirect causes (n = 177).
Maternal deaths making up the remaining sample were pregnancy-related infection, abortion, hypertension, and anesthet-ic complanesthet-ications from obstetranesthet-ic surgery. Pregnancy-related infec-tion (n = 184) included puerperal sepsis (n = 130), antepartum deaths of sepsis onset following prolonged rupture of membranes (n = 30), and obstetric tetanus in the postpartum period (n = 24). Of the 108 maternal deaths due to complication in early pregnancy, most were reported complications following sponta-neous abortion (n = 64).
Earlier reporting of the same dataset found somewhat similar distribution of maternal deaths [1]. There were 1345 ICD-10 O-codes (includes direct and indirect maternal deaths) coded by physicians using the same dataset. The unweighted distribution of maternal deaths was hemorrhage (38%, n = 526), other (including indirect deaths) (34%, n = 471), sepsis (11%, n = 152), abortion (8%, n = 111), obstructed labour (5%, n = 69, and hypertensive disorders (5%, n = 69). After verifying and conducting a consensus panel to review the cause of death, the unweighted distribution of the resulting 1096 maternal deaths were classified as hemorrhage (27%, n = 296), other (23%, n = 248), sepsis (17%, n = 184), indirect (16%, n = 177), abortion (10%, n = 108), hypertensive disorders of pregnancy (7%, n = 79), anesthetic complications (0.4%, n = 4) and obstructed labour (0). This reclassification resulted in fewer assignments of hemorrhage as a cause of death, and reassignment of obstructed labour to hemorrhage, sepsis or other. Details of this re-classification are discussed elsewhere [12,14].
Pregnancy outcomes, routine skilled birth attendance, and emergency obstetric care
For most maternal deaths, the complication leading to death
arose at term ($7 months gestation), and the timing of
complication onset were evenly distributed between the periods
of pregnancy, intrapartum, and postpartum ($24 hours–6 weeks
post-delivery). One-quarter of the postpartum deaths occurred within the first three days and half died within 7 days of delivery (Table 3).
The proportion of maternal deaths who had$1 antenatal visit
was significantly lower in the poorer versus richer states (58.3% versus 73.1%), and 11.5% delivered by caesarean, with no significant difference found between poorer and richer states.
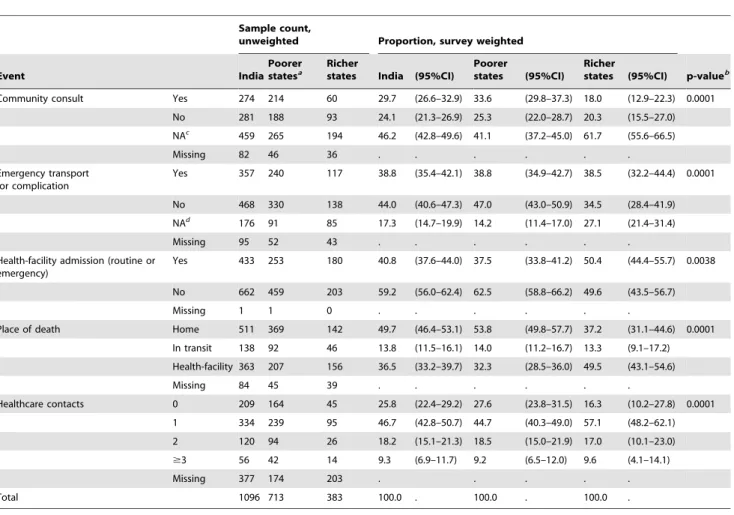
Maternal deaths in poorer states were more likely to seek consultation in the community; whereas, maternal deaths in richer states were more likely to transport directly to a health-facility or be there already whilst receiving routine care (Table 4). Health-facility admission, for both routine and emergency admission, was significantly lower for maternal deaths in poorer versus richer states (37.5% versus 50.4%).
About half of the maternal deaths occurred at home (49.7%) and 13.8% occurred in transit (home to health-facility, from
Figure 1. 2005 estimated proportion and number of maternal deaths by region.Datasource: SRS 2001–3, SRS 2004–6 MMR and UN live birth and death estimates for India 2005*Unweighted sample count of maternal deaths**Survey weighted, (95%CI), rounded to nearest 100th. MDS
health-facility to referral unit, or from health-facility to home). A significantly higher proportion of maternal death occurred at home in poorer versus richer states (53.8% versus 37.2). One-quarter of women in the sample received no healthcare contact from a midwife or physician (25.8%), either in the home, community, or health-facility.
We looked at distribution of highest healthcare uptake sought by women with direct obstetric deaths at the time that the obstetric complication arose (Figure 3). Highest healthcare sought is categorized as routine admission to health-facility for abortion or labour, community consultation for complication, emergency admission for complication, and no facility-based healthcare utilization at time of complication. Only 12.1% (9.8–14.7) received routine care when the complication arose, 21.4% (18.5–24.5) sought community consultation in response to the complication, and 29.0 (25.7–32.5) sought care for emergency admission while in a critical medical condition. The remaining 37.6% (34.2–41.2) women sought no healthcare at the time the complication arose.
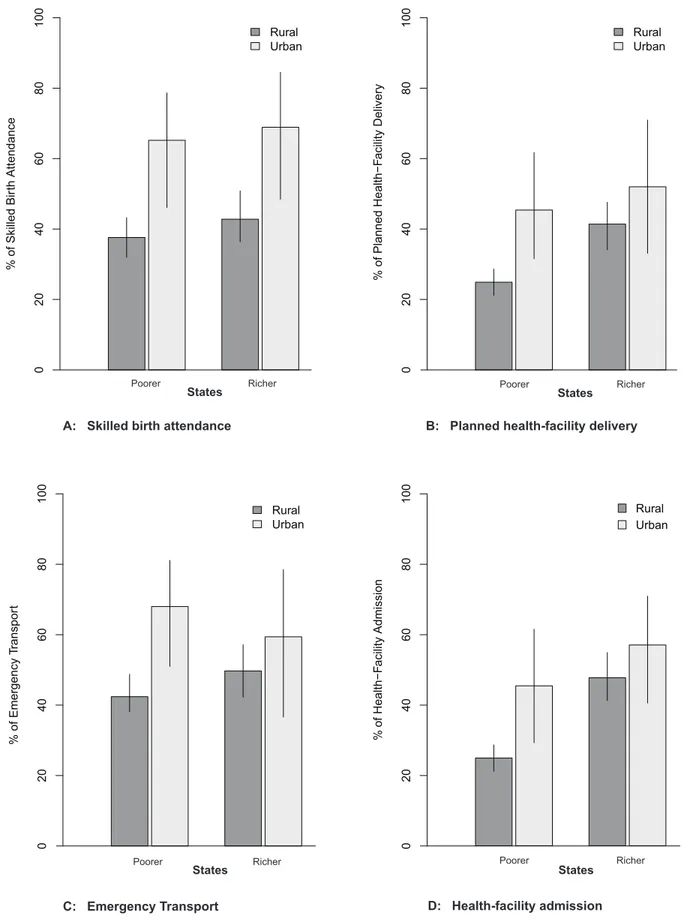
Our a priori subpopulation analysis compared rural to urban areas of two routine obstetric service indicators in both poorer and richer states (Figure 4, Graphs A and B). Uptake of skilled birth attendance and planned health-facility delivery were lower in rural versus urban areas of poorer states (37.6% [95%CI 32.8–42.7] versus 65.2% [47.7–79.4]; and 24.9% [20.9–29.4] versus 45.4% [29.9–61.9], respectively). Conversely, there was a small but
statistically significant difference in uptake of skilled birth attendance and no difference in planned health-facility delivery in rural versus urban areas of richer states (42.8% [35.5–50.4] versus 68.9% [48.4–84.0]; and 41.4% [34.4–48.8] versus 52.0% [33.4–70.1], respectively). Emergency transport and health-facility admission were lower in rural versus urban areas of poorer states (42.4% [38.1–46.8] versus 68.0% [50.9–81.3]; and 34.2% [30.6– 38.1] versus 63.1% [48.7–75.4], respectively) (Figure 4, Graphs C and D). Conversely, there was no significant difference in emergency transport and health-facility admission in rural versus urban areas of richer states (49.7% [42.3–57.2] versus 59.4% [37.4–78.2]; and 47.7% [41.6–53.8] versus 57.0% [40.7–71.9], respectively). This suggests that rural areas of poorer states have proportionately lower -use of routine skilled birth attendance and emergency obstetric service indicators than the urban areas; whereas this rural-urban difference was not seen in richer states.
Discussion
Maternal deaths are a significant cause of death in women in the 15–49 years age group, and they make up a larger proportion of all-cause deaths in the rural areas of poorer states, compared to other regions of India. We found that the distribution of cause-specific mortality was the same across poorer and richer states, suggesting that the high burden of maternal death in poorer states
Table 1.Sample characteristics of 1096 maternal deaths.
Sample count, unweighted Proportion, sample weighted
Characteristics India Poorer statesa
Richer
states India (%) (95%CI)
Poorer statesa
(%) (95%CI)
Richer states
(%) (95%CI) p-valueb
Age group (years)
15–19 112 81 31 11.2 (9.1–13.3) 11.0 (8.6–13.4) 11.8 (7.3–16.2) 0.2418
20–24 290 188 102 30.5 (27.4–33.7) 29.1 (25.4–32.7) 34.9 (28.6–41.3)
25–29 210 125 85 20.1 (17.4–22.9) 19.3 (16.1–22.5) 22.5 (17.1–27.9)
30–34 183 131 52 20.0 (17.2–22.7) 21.5 (18.2–24.9) 15.3 (10.8–19.9)
35–39 118 81 37 12.4 (10.2–14.7) 12.9 (10.2–15.6) 11.1 (7.0–15.1)
40–44 40 29 11 4.3 (2.9–5.7) 4.6 (2.9–6.2) 3.5 (1.2–5.8)
45–49 15 9 6 1.4 (0.6–2.3) 1.6 (0.5–2.7) 0.9 (0.0–1.9)
Missing 128 69 59 . . .
Marital status Married 988 652 336 96.9 (95.7–98.1) 97.4 (96.1–98.6) 95.5 (92.4–98.5) 0.1843
Singlec 32 19 13 3.1 (1.9–4.3) 2.6 (1.4–3.9) 4.5 (1.5–7.6)
Missing 76 42 34 . . . .
Literacy status Non-literate 636 476 160 65.4 (62.3–68.6) 72.3 (68.8–75.8) 46.1 (39.9–52.3) 0.0001
Literate 388 194 194 34.6 (31.4–37.7) 27.7 (24.2–31.2) 53.9 (47.7–60.1)
Missing 72 43 29 . . .
Religion Hindu 790 556 234 79.3 (76.6–82.1) 82.0 (78.8–85.1) 71.9 (66.3–77.4) 0.0001
Muslim 157 100 57 16.9 (14.3–19.5) 16.3 (13.2–19.3) 18.7 (13.7–23.7)
Other 71 12 59 3.8 (2.6–4.9) 1.8 (0.7–2.8) 9.4 (6.2–12.6)
Missing 78 45 33 . . .
Place of residence
Rural 992 660 332 86.3 (83.6–88.9) 89.2 (86.4–92.0) 78.1 (72.2–84.0) 0.0002
Urban 104 53 51 13.7 (11.1–16.4) 10.8 (8.0–13.6) 21.9 (16.0–27.8)
Total 1096 713 383 100.0 . 100.0 . 100.0
Datasource: Indian SRS 2001–3.
aStates Assam, Bihar, Chhattisgarh, Jharkhand, Madhya Pradesh, Orissa, Rajasthan, Uttar Pradesh, and Uttarakhand.bRao-Scott Chi-squared comparison of poorer versus
Figure 2. Cause of death distribution and estimation of annual number of maternal deaths by cause.Datasource: Indian SRS 2001–3 data, SRS 2004–6 MMR and UN live birth and death estimates for India 2005. ICD-10 categorization of cause of death [14] MDS - Million Death Study
aUnweighted sample count of maternal deathsbSurvey weighted, (95%CI), rounded to nearest 100th.cIncludes ill-defined obstetric deaths (n = 205),
antenatal and postpartum suicide (n = 24), vascular accidents (n = 16), and uterine inversion (n = 2).dIncludes ‘unanticipated’ anesthetic complications
(n = 4). Compare with proportion of unweighted maternal deaths reported with RGI categorization: hemorrhage (38%, estimated total deaths for 2005 = 26 000), other (34%, total = 23 500), sepsis (11%, total = 7600), abortion (8%. total = 5500), obstructed labour (5%, total = 3400), and hypertensive disorders of pregnancy (5%, total = 3400) [1].
doi:10.1371/journal.pone.0083331.g002
Table 2.Cause of death distribution of 1096 maternal deaths.
Sample count, unweighted Proportion, survey weighted
Cause of deatha India
Poorer statesb
Richer
states India (95%CI)
Poorer
states (95%CI) Richer
states (95%CI) p-valuec
Total direct maternal deaths 919 604 315 81.8 (79.3–84.3) 83.8 (80.9–86.6) 76.5 (71.3–81.6)
Hemorrhage 296 177 119 24.5 (21.8–27.2) 25.2 (22.4–28.0) 24.5 (21.8–27.2) 0.1649
O44–46, O67, O72
Other 248 170 78 22.6 (19.9–25.2) 23.3 (20.5–26.0) 22.6 (19.9–25.2)
O22, O26, O71, O75, O87, O88, O90, X60–84, F53
Pregnancy-related infection 184 124 60 17.2 (14.8–19.7) 17.8 (15.3–20.3) 17.2 (14.8–19.7)
A34, O23, O41, O85–86
Complications from spontaneous 108 81 27 9.4 (7.6–11.2) 9.7 (7.8–11.5) 9.4 (7.6–11.2)
or therapeutic abortion
O00–01, O03–O06
Hypertensive disorder of pregnancy 79 50 29 7.1 (5.5–8.8) 7.3 (5.6–9.1) 7.1 (5.5–8.8)
O11, O16
Unanticipatedd 4 2 2 0.4 (0.0–0.8) 0.4 (0.0–0.8) 0.4 (0.0–0.8)
O29, O74, O89
Total indirect maternal deaths O98, O99 177 109 68 15.9 (13.5–18.2) 15.3 (12.5–18.0) 19.1 (14.2–24.0)
Total maternal deaths 1096 713 383 100.0 . 100.0 . 100.0 .
Datasource: Indian SRS 2001–3.
aWHO 2012 ICD-10 categorization of cause of death versus unweighted distribution of maternal deaths in an early report was hemorrhage (38%, n = 526), other
(including indirect deaths) (34%, n = 471), sepsis (11%, n = 152), abortion (8%, n = 111), obstructed labour (5%, n = 69, and hypertensive disorders (5%, n = 69) [1].bStates Assam, Bihar, Chhattisgarh, Jharkhand, Madhya Pradesh, Orissa, Rajasthan, Uttar Pradesh, and Uttarakhand.cRao-Scott Chi-squared comparison of poorer versus richer states distribution of direct obstetric causes and indirect cause.dUnanticipated - anesthetic complication during cesarean delivery.
is not due to an excess of one or more causes of direct obstetric deaths.
Use of healthcare was significantly lower in rural areas of poorer states compared with urban ares; whereas there was no difference between rural and urban areas of richer states. Furthermore, emergency obstetric care (community consultation and/or health-facility admission) was a significant point of access to care for most women in a critical medical state in both poorer and richer states. One-third of complications arose in pregnancy prior to the onset of labour. This was higher than we expected. Narrative review permitted us to identify the timing of the complication relative to the onset of labour and we were able to identify the antepartum precedents of intrapartum mortality, unlike previous studies [23–26]. We propose that these maternal deaths would likely be misclassified as intrapartum cases in other studies as delivery is often the recommended management [27]. The
cesarean rate among delivered women is 10–15%, which is higher than the national average of less than 10% [28]. This is plausible as this is a sampling of complicated obstetric cases, and a substantial number of clinical situations required expedited delivery as part of the care management.
We were also able to differentiate between planned and actual place of birth, in order to differentiate between those seeking care for routine services and those seeking care in a critical medical condition. Routine care plays an important role in prevention and early identification of complications leading to maternal death [15]. However, appreciating that a significant proportion of complications arise prior to the onset of labour or in the postpartum period, and a significant proportion of women deliver at home, access to emergency obstetric care (community consultation and/or health-facility admission) will continue to play an important role in lowering avoidable maternal deaths.
Table 3.Gestational age, timing of death, and routine care in 1096 maternal deaths.
Sample count, unweighted Proportion, survey weighted
Event India
Poorer statesa
Richer
states India (95%CI)
Poorer
states (95%CI) Richer
states (95%CI) p-valueb
Gestational age Term ($7 mos) 784 511 273 82.8 (80.2–85.3) 81.6 (78.5–84.7) 86.3 (81.8–90.8) 0.0033
Preterm 173 125 48 17.2 (14.7–19.8) 18.4 (15.3–21.5) 13.7 (9.2–18.2)
Missing 139 77 62 . . . .
Antenatal care Yes 508 323 185 61.8 (58.2–65.4) 58.3 (54.0–62.5) 73.1 (66.9–79.3) 0.0038d
No 175 131 44 21.5 (18.5–24.6) 23.4 (19.8–27.1) 15.4 (10.2–20.5)
NAc 145 107 38 16.7 (14.0–19.4) 18.3 (15.0–21.6) 11.5 (7.4–15.7)
Missing 268 152 116 . . . .
Planned place of birth/ abortion
Home 487 334 153 48.9 (45.5–52.2) 50.2 (46.3–54.2) 44.8 (38.5–51.1) 0.0001d
Health-facility 233 123 110 22.9 (20.1–25.8) 19.1 (16.0–22.3) 34.4 (28.4–40.4)
NAe 293 208 85 28.2 (25.2–31.2) 30.6 (27.0–34.2) 20.8 (15.7–25.9)
Missing 83 48 35 . . . .
Primary care provider Midwife/Doctor 283 168 115 30.3 (27.1–33.5) 27.9 (24.3–31.6) 37.6 (31.2–44.0) 0.2597d
TBA 291 198 93 31.0 (27.8–34.2) 31.2 (27.5–35.0) 30.5 (24.4–36.6)
Otherf 94 62 32 8.8 (7.0–10.7) 8.7 (6.5–10.9) 9.3 (5.5–13.1)
NAe 292 208 84 29.8 (26.7–33) 32.1 (28.4–35.9) 22.6 (17.1–28.0)
Missing 136 77 59 . . . .
Timing of death Pregnant 268 185 83 24.8 (22.0–27.6) 26.2 (22.9–29.6) 20.7 (15.7–25.7) 0.4062
Intrapartum 369 225 144 33.6 (30.5–36.7) 32.2 (28.6–35.8) 37.6 (31.7–43.5)
Postpartum 447 296 151 41.6 (38.4–44.8) 41.6 (37.8–45.4) 41.7 (35.7–47.7)
Missing 12 7 5 . . . .
Births - mode of deliveryh Vaginali 603 390 213 88.5 (85.8–91.2) 89.7 (86.5–92.8) 85.5 (80.0–90.9) 0.1647
Cesarean 73 42 31 11.5 (8.8–14.2) 10.3 (7.2–13.5) 14.5 (9.1–20.0)
Missing 18 7 11 . . . .
Postpartum - timing of deathj1–6 days 172 123 49 51.6 (45.8–57.5) 53.6 (46.6–60.5) 45.6 (34.9–56.3) 0.3144
7–14 days 79 49 30 24.0 19.0–29.1) 22.9 (17.1–28.8) 27.4 (17.6–37.2)
15–42 days 78 49 29 24.3 (19.3–29.4) 23.5 (17.5–29.5) 27.0 (17.8–36.2)
Missing 118 75 43 . . . .
Total 1096 713 383 100.0 . 100.0 . 100.0 . .
Datasource: Indian SRS 2001–3.
aStates Assam, Bihar, Chhattisgarh, Jharkhand, Madhya Pradesh, Orissa, Rajasthan, Uttar Pradesh, and Uttarakhand.bRao-Scott Chi-squared comparison of poorer
versus richer states distribution.cNot applicable - early gestation.dExcludes pregnancies
#4 months gestation.eNot applicable - complication arose prior to the onset of labour.fTraditional doctor, family members, unattended.hSubpopulation of those who delivered.iIncludes 1 forceps delivery.jSubpopulation of postpartum women day 1–42. TBA, traditional birth attendant.
Our study is the first nationally representative study of maternal mortality in India. The strength of this study is its size, as maternal deaths are relatively rare, permitting comparison across regions of India. Previous studies have been limited by small sample size, non-representative sampling, and measurement bias that does not differentiate between primary care provider versus emergency consultation care, and planned versus actual place of birth ([29– 32]). In the SRS, households are surveyed monthly and every six month, recording all pregnancies, births and deaths. This dual-reporting system, as well as prospective ascertainment of pregnancy, should be particularly robust in capturing maternal deaths, compared to case finding methods of other study designs. The survey also captures ‘usual residents’ so the tradition of the woman returning to her maternal home for delivery should not have lead to an undercount of deaths for this reason.
Nonetheless, there are certain limitations to this study. These data are 10 years old however they do provide a national baseline of the characteristics of maternal deaths and healthcare use by these women, prior to the introduction of two major national health policy changes: the National Rural Health Mission, and the conditional cash-transfer scheme called Janani Suraksha Yojana. Secondly, a recent review of verbal autopsy coding found that physician coding performed as well or better than various
automated coding methods, using hospital-based deaths as a reference [33]. A physician-coding reliability study for maternal cause of death coding found that physicians had substantial agreement, and were not significantly influenced by case characteristics [12]. Physician coding also offers the additional benefit of establishing chronology of events, and the use of the narrative enabled us to extract the context of the events
surrounding the womanJs death (the M-DET tool used in this
paper). Thirdly, true validation of verbal autopsy is difficult, as no absolute gold standard exists. Reference standards based on hospital deaths may well be misleading as most maternal deaths occur out of hospital, and the traits of the individuals, symptom-atology and recall of healthcare experience may differ between the hospital and home deaths. Previous independent reports estimate
that approximately 15% (65%) of adult female deaths are missed,
suggesting that our estimated number of annual maternal deaths in India may actually be higher by 10–20% depending on the state [19,20]. Misclassification of maternal deaths have been well documented [2]. Deaths early in pregnancy may be coded as non-maternal deaths if the respondent was unaware or unwilling to disclose that the woman died while pregnant or in the postpartum period, which may lead to an underestimation of abortion-related deaths and suicides in our results.
Table 4.Emergency service uptake in 1096 maternal deaths.
Sample count,
unweighted Proportion, survey weighted
Event India
Poorer statesa
Richer
states India (95%CI)
Poorer
states (95%CI) Richer
states (95%CI) p-valueb
Community consult Yes 274 214 60 29.7 (26.6–32.9) 33.6 (29.8–37.3) 18.0 (12.9–22.3) 0.0001
No 281 188 93 24.1 (21.3–26.9) 25.3 (22.0–28.7) 20.3 (15.5–27.0)
NAc 459 265 194 46.2 (42.8–49.6) 41.1 (37.2–45.0) 61.7 (55.6–66.5)
Missing 82 46 36 . . . .
Emergency transport for complication
Yes 357 240 117 38.8 (35.4–42.1) 38.8 (34.9–42.7) 38.5 (32.2–44.4) 0.0001
No 468 330 138 44.0 (40.6–47.3) 47.0 (43.0–50.9) 34.5 (28.4–41.9)
NAd 176 91 85 17.3 (14.7–19.9) 14.2 (11.4–17.0) 27.1 (21.4–31.4)
Missing 95 52 43 . . . .
Health-facility admission (routine or emergency)
Yes 433 253 180 40.8 (37.6–44.0) 37.5 (33.8–41.2) 50.4 (44.4–55.7) 0.0038
No 662 459 203 59.2 (56.0–62.4) 62.5 (58.8–66.2) 49.6 (43.5–56.7)
Missing 1 1 0 . . . .
Place of death Home 511 369 142 49.7 (46.4–53.1) 53.8 (49.8–57.7) 37.2 (31.1–44.6) 0.0001
In transit 138 92 46 13.8 (11.5–16.1) 14.0 (11.2–16.7) 13.3 (9.1–17.2)
Health-facility 363 207 156 36.5 (33.2–39.7) 32.3 (28.5–36.0) 49.5 (43.1–54.6)
Missing 84 45 39 . . . .
Healthcare contacts 0 209 164 45 25.8 (22.4–29.2) 27.6 (23.8–31.5) 16.3 (10.2–27.8) 0.0001
1 334 239 95 46.7 (42.8–50.7) 44.7 (40.3–49.0) 57.1 (48.2–62.1)
2 120 94 26 18.2 (15.1–21.3) 18.5 (15.0–21.9) 17.0 (10.1–23.0)
$3 56 42 14 9.3 (6.9–11.7) 9.2 (6.5–12.0) 9.6 (4.1–14.1)
Missing 377 174 203 . . . . .
Total 1096 713 383 100.0 . 100.0 . 100.0 .
Datasource: Indian SRS 2001–3.
aStates Assam, Bihar, Chhattisgarh, Jharkhand, Madhya Pradesh, Orissa, Rajasthan, Uttar Pradesh, and Uttarakhand. bRao-Scott Chi-squared comparison of poorer versus richer states distribution.
cNot applicable - transported or planned health-facility birth. dNot applicable - planned health-facility birth.
Misclassification of cause-specific mortality may have occurred in differentiating between the types of maternal deaths, given the absence of medical care received in this population, leading to an underestimation of certain causes that often rely on objective measures (e.g. blood pressure for hypertensive disorders). In a systematic review of vital statistics and surveys, Khan et al. estimated the proportion of South Asian maternal deaths due to hypertensive disorders to be 9% (2–35%), and our estimate of 7% is within this range [34]. However, if we conservatively estimate the incidence of severe hypertensive disorders of pregnancy in South Asia as 0.3% of pregnancies, and a case fatality rate of 15% in this healthcare capacity context [35,36], then based on the number of births in India in 2005, we would have estimated 12250 maternal deaths due to hypertensive disorders, or approximately 17% of maternal deaths - more than twice our estimate. We anticipate that these hypertensive maternal deaths were misclas-sified as either ‘other’ ill-defined, or hemorrhage, given a hypertensive women’s predisposition to hemorrhage [37].
Misclassification of healthcare services may have occurred if the respondent was unaware of the skilled birth attendant’s credentials or the health-facilities capacity to provide obstetric care, thus access to care may be over estimated. However, we do not have reason to believe that this misclassification occurred differentially across India.
Incomplete data occurred as the primary study was not designed specifically to capture the reported variables of interest. Our missing data analysis (Web Appendix S1) presents imputed versus complete case analysis provided similar point estimates, suggesting that our results were not differentially biased by missing data.
The maternal mortality ratio and the proportion of maternal deaths to all-cause death was higher in the poorer versus the richer states. We hypothesize that this difference is not due to any single specific cause of maternal death; however, perhaps our study did
not have the power to demonstrate a difference in cause-specific mortality distribution between poorer and richer states. Further areas of research should look at how cause-specific mortality profile changes with various levels of MMR - as increasing healthcare uptake leads to a decline in preventable maternal deaths (e.g. improved outcomes in hypertensive disorders of pregnancy with primary and secondary prevention, active management of third stage, and clean delivery) [34].
Reduction in India’s maternal mortality rate would make an important contribution to the worldwide reduction of maternal mortality. Our analysis presents the important local variations from global characteristics of maternal mortality as well as the substantial internal variations within India. For policy-makers, faced with constrained budgets but committed to India’s goal of effectively addressing a relatively rare yet highly important health priority, these variations may provide some targets for intensifying or initiating maternal health interventions. The majority of maternal deaths took place after 7 months gestational age and in the immediate post-partum period, and women are often presenting at obstetric facilities only in very serious condition. Thus, one priority is to provide health education on the early recognition of potentially hazardous conditions as part of an enhanced antenatal care program. As well, reduction in avoidable maternal deaths in India will require skilled healthcare providers with the capacity to deliver service for not only routine delivery but emergency obstetric care including community consultation and emergency admission to a health-facility. Secondly, obstetric services themselves could be a target area for intervention, particularly for investments in infrastructure, staffing and training in the rural areas of poorer states. Finally, we note that there was no difference in many outcomes between the rural and urban areas of the richer states, suggesting that national health and development programs focusing on poorer states must be maintained and even intensified. From 1999–2010, the proportion
Figure 3. Proportion of highest healthcare sought by timing of direct maternal death.x-axis: Survey weighted proportion of timing of direct maternal death (n = 919) with respect to the pregnancy: early termination (spontaneous or therapeutic), term antenatal complication ($7 months), intrapartum, postpartum. y-axis: Highest healthcare sought at onset of complication leading to death: routine admission to health-facility/ hospital for abortion or labour, emergency admission for complication, community consultation for complication, no facility-based healthcare utilization at time of complication.
Poorer Richer
% of Skilled Bir
th Attendance
0
2
04
06
08
0
1
0
0
Rural Urban
% of Planned Health−F
a
cility Delivery
Poorer Richer
0
20
40
60
80
100
Rural Urban
%
of Health−F
a
cility Admission
0
20
40
60
80
100
Rural Urban
% of Emergency T
ranspor
t
0
20
40
60
80
100
Rural Urban
A: Skilled birth attendance B: Planned health-facility delivery
C: Emergency Transport D: Health-facility admission
Poorer Richer Poorer Richer
States States
States States
of safe deliveries has increased annually at twice the rate in the rural areas of poorer compared to richer states (8% versus 4%)
[38]. Given this increase and the implementation ofJanani Suraksha
Yojana, India’s 2005 conditional cash transfer program to promote
routine safe deliveries (skilled birth attendance and facility-based deliveries), future research should evaluate the effectiveness of this program on reducing the number of maternal deaths [39].
Data sharing statement: The data used in this study are the property of the Registrar General of India and the overall mortality results have been published in 2006. Application for data access can be made to the Office of the Registrar General of India.
Supporting Information
Web Appendix S1
(PDF)
Acknowledgments
The Registrar General of India has managed the SRS since they established the survey in 1971, and is collaborating with several of the authors in the ongoing Million Death Study. All study materials are available at HYPERLINK "http://www.cghr.org/" \o "http://www.cghr. org/Cmd+click or tap to follow link" www.cghr.org. The opinions expressed here are those of the authors and do not necessarily represent those of the Government of India.
Members of Million Death Study Collaborators Indian Academic Partners (in alphabetical order):
1. Department of Community Medicine Gujarat Medical College, Ahmedabad: DV Bala, P Seth, KN Trivedi
2. Department of Community Medicine Kolkatta Medical College, Kolkatta: SK Roy
3. Department of Community Medicine Regional Institute of Medical Sciences, Imphal: L Usharani
4. Department of Community Medicine S.C.B. Medical College Cuttack, Orissa: B Mohapatra
5. Department of Community Medicine SMS Medical College Jaipur: AK Bharadwaj, R Gupta
6. Epidemiological Research Center, Chennai: V Gajalakshmi, CV Kanimozhi
7. Gandhi Medical College, Bhopal: RP Dikshit, S Sorangi
8. Healis-Seskarhia Institute of Public Health, Navi Mumbai: PC Gupta, MS Pednekar, S Sreevidya
9. Apollo Institute of Medical Sciences & Research, Hyderabad: P Bhatia
10. St. John’s Academy of Health Sciences, Bangalore: A Shet, AS Shet, D Xavier, S Rathi, V Habbare
11. King George Medical College, Lucknow: S Awasthi
12. Najafgarh Rural Health Training Centre Ministry of Health Government of India, New Delhi: N Dhingra, J Sudhir, I Rawat (until 2007)
13. Regional Medical Research Center, ICMR Institute, Bhubaneshwar: AS Karketta, SK Dar
14. School of Preventative Oncology, Patna: DN Sinha
15. School of Public Health, Post Graduate Institute of Medical Education and Research, Chandigarh: N Kaur, R Kumar, JS Thakur
16. Tata Memorial Cancer Hospital, Mumbai: RA Badwe, R Dikshit, M Mallath, K Panse, A Budukh
Lead Partners:
1. Office of the Registrar-General India, RK Puram, New Delhi India: C Chandramouli (Registrar General of India [RGI]), B Mishra, AK Saxena, MS Thapa, N Kumar, JK Banthia and DK Sikri (former RGIs)
2. Million Death Study Coordinating, Centre for Global Health Research (CGHR), Li Ka Shing Knowledge Institute, St. Michael’s Hospital, Dalla Lana School of Public Health, University of Toronto, Canada: P Jha (Principal Investigator), R Kamadod, S Neale, S Rathi, P Rodriguez, P Sati, J Sudhir, C Ramasundarahettige, W Suraweera
Affiliated Partners:
1. Indian Council of Medical Research, New Delhi India: VM Katoch (Director General or DG from 2008), NK Ganguly (DG to 2008), L Kant, B Bhattacharya, B Shah, DK Shukla
2. World Health Organization, Geneva and SEARO Office, New Delhi: T Boerma, A Fric, S Habayeb (former WHO Representative-India), S Khanum, CD Mathers, DN Sinha, N Singh, P Singh (Deputy Regional Director)
3. Clinical Trial Service Unit and Epidemiological Studies Unit (CTSU), University of Oxford, England: J Boreham, R Peto, G Whitlock
Author Contributions
Conceived and designed the experiments: AM UR RK PJ. Performed the experiments: AM UR PK RJ. Analyzed the data: AM. Contributed reagents/materials/analysis tools: AM UR RK PJ. Wrote the paper: AM UR RK PJ.
References
1. RGI (2006) Registrar General/Centre for Global Health Research, University of Toronto. New Delhi: Registrar General of India.
2. WHO, UNICEF, UNFPA, World Bank (2012) Trends in maternal mortality: 1990 to 2010. Geneva: World Health Organization.
3. IIPS (2010) District level household and facility survey (DLHS-3) 2007–2008: India. Mumbai: International Institute for Population Sciences.
4. Barros AJD, Ronsmans C, Axelson H, Loaiza E, Bertoldi AD, et al. (2012) Equity in maternal, newborn, and child health interventions in countdown to 2015: a retrospective review of survey data from 54 countries. Lancet 379: 1225– 1233.
5. Jha P, Gajalakshmi V, Gupta PC, Kumar R, Mony P, et al. (2006) Prospective study of one million deaths in India: rationale, design, and validation results. PLoS Med 3: e18.
6. Jha P, Jacob B, Gajalakshmi V, Gupta PC, Dhingra N, et al. (2008) A nationally representative case-control study of smoking and death in India. N Engl J Med 358: 1137–1147.
7. Bassani DG, Kumar R, Awasthi S, Morris SK, Paul VK, et al. (2010) Causes of neonatal and child mortality in India: a nationally representative mortality survey. Lancet 376: 1853–60.
8. Jha P, Kumar R, Khera A, Bhattacharya M, Arora P, et al. (2010) HIV mortality and infection in India: estimates from nationally representative mortality survey of 1.1 million homes. BMJ 340: c621.
9. Dikshit R, Gupta PC, Ramasundarahettige C, Gajalakshmi V, Aleksandrowicz L, et al. (2012) Cancer mortality in India: a nationally representative survey. Lancet 379: 1807–1816.
10. Sinha D, Dikshit R, Kumar V, Gajalakshmi V, Dingra N, et al. (2006) Technical document VII: health care professional’s manual for assigning causes of death based on RHIME household reports. Toronto: Centre for Global Health Research.
11. WHO (1994) International statistical classification of diseases and related health problems, 10th revision (ICD-10). Geneva: World Health Organization. 12. Montgomery AL, Morris SK, Bassani DG, Kumar R, Jotkar R, et al. (2012)
Factors associated with physician agreement and coding choices of cause of death using verbal autopsies for 1130 maternal deaths in India. PLoS One 7: e33075.
13. Montgomery AL, Morris SK, Kumar R, Jotkar R, Mony P, et al. (2011) Capturing the context of maternal deaths from verbal autopsies: a reliability study of the maternal data extraction tool (m-det). PLoS One 6: e14637. 14. WHO (2012) The WHO Application of ICD-10 to deaths during pregnancy,
childbirth and the puerperium: ICD-MM. Geneva: World Health Organization. 15. Campbell OMR, Graham WJ (2006) Strategies for reducing maternal mortality:
getting on with what works. Lancet 368: 1284–1299.
16. RGI (2011) Special bulletin on maternal mortality in India 2007–09. New Delhi: Office of the Registrar General.
17. Heeringa A, West BT, Berglund PA (2010) Applied survey data analysis. Boca Raton: Taylor & Francis.
18. RGI (2009) Special bulletin on maternal mortality in India 2004–2006. New Delhi: Office of the Registrar General.
19. Bhat PNM (2002) Completeness of India’s sample registration system: an assessment using the general growth balance method. Pop Stud 56: 119–134.
area of poorer states (p = 0.0036) and richer states (p = 0.2919) andD: Health-facility admission comparison of rural and urban area of poorer states (p = 0.0001) and richer states (p = 0.4135).
20. Sivanandan V (2004) An assessment of the completeness of death registration in India over the periods 1975–1978 and 1996–1999 under the generalized population model: an analysis based on SRS data. Mumbai: International Institute for Population Sciences.
21. White IR, Royston P, Wood AM (2011) Multiple imputation using chained equations: issues and guidance for practice. Stat Med 30: 377–399. 22. Horton NJ, Kleinman KP (2007) Much ado about nothing: a comparison of
missing data methods and software to fit incomplete data regression models. Am Stat 61: 79–90.
23. Faveau V, Koenig MA, Chakraborty J, Chowdhury AI (1988) Causes of maternal mortality in rural Bangladesh, 1976–85. Bull World Health Organ 66: 643–651.
24. Campbell OMR, Graham W (1990) Measuring maternal mortality and morbidity: levels and trends. London: London School of Hygiene and Tropical Medicine.
25. Li XF, Fortney JA, Kotelchuck M, Glover LH (1996) The postpartum period: the key to maternal mortality. Int J Gynecol Obstet 54: 1–10.
26. Bhatia JC (1993) Levels and causes of maternal mortality in southern India. Stud Fam Plann 24: 310–8.
27. WHO (2003) Managing complications in pregnancy and childbirth: a guide for midwives and doctors. Geneva: World Health Organization, 392 pp. 28. IIPS (2006) Reproductive and child health: district level household survey 2002–
2004. Mumbai: International Institute for Population Sciences.
29. Barnett S, Nair N, Tripathy P, Borghi J, Rath S, et al. (2008) A prospective key informant surveillance system to measure maternal mortality - findings from indigenous populations in Jharkhand and Orissa, India. BMC Pregnancy Childbirth 8: 6.
30. Khatun F, Rasheed S, Moran AC, Alam MA, Shomik MS, et al. (2012) Causes of neonatal and maternal deaths in dhaka slums: implications for service delivery. BMC Public Health 12: 84.
31. Bartlett LA, Mawji S, Whitehead S, Crouse C, Dalil S, et al. (2005)Where giving birth is a forecast of death: maternal mortality in four districts of Afghanistan 1999–2002. Lancet 365: 864–870.
32. Nisar N, Sohoo NA (2010) Maternal mortality in rural community: a challenge for achieving millennium development goal. J Pak Med Assoc 60: 20–24. 33. Leitao J, Aleksandrowicz L, Byass P, Miasnikof P, Tollman S, et al. (2013)
Comparison of physician certified verbal autopsy with computerized coding of verbal autopsy for cause of death assignment in hospitalized patients in low and middle-income countries: literature review. BMC Med: Under Review. 34. Khan KS, Wojdyla D, Say L, Gu¨lmezoglu AM, Van Look PFA (2006) WHO
analysis of causes of maternal death: a systematic review. Lancet 367: 1066– 1074.
35. Swain S, Ojha KN, Prakash A, Bhatia BD (1993) Maternal and perinatal mortality due to eclampsia. Indian Pediatr 30: 771–773.
36. Khosla AH, Dahiya K, Sangwan K (2000) Maternal mortality and ‘near-miss’ in rural north India. Int J Gynecol Obstet 68: 163–164.
37. Cunningham FG, Williams JW (2009) William’s obstetrics. New York: McGraw-Hill Education, 23 edition.
38. RGI (2011) Sample Registration System statistical report 2010. New Delhi: Office of the Registrar General of India.