Abstract—In this paper, we have used the chi-squared test and Yule’s Q measure to discover associations in tables of patient audiology data. These records are examples of heterogeneous medical records, since they contain audiograms, textual notes and typical relational fields. In our first experiment we used the chi-squared measure to discover associations between the different fields of audiology data such as patient gender and patient age with diagnosis. Then, in our second experiment we used Yule’s Q to discover the strength and direction of the significant associations found by the chi-squared measure. We then examined two measures of association commonly used in market basket analysis, support and confidence. These did not yield any further associations. We discuss our findings in the context of producing an audiology decision support system.
Index Terms—Audiology, Chi-squared, Confidence, Support, Yule’s Q.
I. INTRODUCTION
Association measures can be used to measure the strength of relationship between the variables in medical data. Discovering associations in medical data has an important role in predicting the patient’s risk of certain diseases. Early detection of any disease can save time, money and painful procedures [1]. In our work we are looking for significant associations in heterogeneous audiology data with the ultimate aim of looking for factors influencing which patients would most benefit from being fitted with a hearing aid.
Support and confidence are measures of the interestingness of associations between variables [2, 3]. They show the usefulness and certainty of discovered associations. Strong associations are not always interesting, because support and confidence do not filter out uninteresting associations [4]. Thus, to overcome this problem a correlation measure is augmented to support and confidence. One of the correlation measures popularly used in the medical domain is chi-squared ( 2).
In section II we describe our database of audiology data. We first use the chi-squared measure to discover significant associations in our data, as described in section III. We then use Yule’s Q measure to discover the strength of each of our
Manuscript received March 17, 2010.
Muhammad N. Anwar is a PhD student at the Department of Computing, Engineering & Technology, University of Sunderland, England (e-mail: [email protected]).
Michael P. Oakes is a Senior Lecturer at the Department of Computing, Engineering & Technology, University of Sunderland, England (e-mail: [email protected]).
Ken McGarry is a Senior Lecturer in Statistics for Health Sciences, at the Department of Pharmacy, Health and Well-being, University of Sunderland, England (e-mail: [email protected]).
significant associations, as described in section IV. In Section V, we find the support and confidence for each of the significant associations, and contrast these with the strengths of the associations found in section III. We draw our conclusions in section VI.
II. AUDIOLOGY DATA
In this study, we have made use of audiology data collected at the hearing aid out-patient clinic at James Cook University Hospital in Middlesbrough. The data consists of about 180,000 individual records covering about 23,000 audiology patients. The data in the records is heterogeneous, consisting of the following fields:
1) Audiograms, which are the graphs of hearing ability at different frequencies (pitches). They consist of two graphs, AC and BC, each obtained for both ears. AC stands for air conduction (which uses sounds from a headphone on the ear for measuring the overall hearing ability), while BC stands for bone conduction (in which sound is given behind the ear at the mastoid bone, to measure the hearing ability of the inner ear – cochlea and auditory nerve). An example of an audiogram for one ear is |80|80|95|95|85|85|20|40|50|65|55|. The first six values are for AC thresholds (the faintest sound the patient can hear in decibels) at 250, 500, 1000, 2000, 4000 and 8000 Hz, and the last five values are for BC thresholds at the same frequencies excluding 8000Hz.
2) Structured data: gender, date of birth, diagnosis and hearing aid type, as stored in a typical database, e.g. |M|, |09-05-1958|, |TINNITUS|, |BE18|.
3) Textual notes: specific observations made about each patient, such as |HEARING TODAY NEAR NORMAL - USE AID ONLY IF NECESSARY|. In general, these audiology records represent all types of medical records because they involve both structured and unstructured data.
III. DISCOVERY OF ASSOCIATIONS WITH THE CHI-SQUARED TEST
The Chi-squared test is a simple way to provide estimates of quantities of interest and related confidence intervals [5]. It is a measure of associations between variables (such as the fields of the tables in a relational database) where the variables are nominal and related to each other [6]. The Chi-squared test is popular in the medical domain because of its simplicity. It has been used in pharmacology to classify text according to subtopics [7]. The resulting chi-squared
Chi-squared and Associations in Tabular
Audiology Data
value is a measure of the differences between a set of observed and expected frequencies within a population, and is given by the formula:
ij ij ij c
j r
i
E
E
O
X
2
1 1
2
(
−
)
=
= =[5] where r is the number of unique terms in a particular field of the patient records such as diagnosis or hearing aid type, corresponding to rows in Table 1. c is the number of categories in the data (such as age or gender) corresponding to columns in Table 1.
Table 1
Observed and Expected frequencies for diagnosis Diagnosis Age<=54 Age>54 R. Total
DOWNS 12 (6.18) [33.92]
0 (5.82)
[33.92] 12
FAM 11 (5.66) [28.50]
0 (5.34)
[28.50] 11
FAMILIAL 18 (9.26) [76.32]
0 (8.74)
[76.32] 18
INFO 4 (11.32) [53.62]
18 (10.68)
[53.62] 22
REV 9 (8.75)
[0.06]
8 (8.25)
[0.06] 17
TINNITUS 535 (580.02) [2027.24]
592 (546.98)
[2027.24] 1127 OTHERS 113 (80.80)
[1036.71]
44 (76.20)
[1036.71] 157
C. Total 702 662 1364
R. Total stands for row total C. Total stands for column total Expected frequencies are in ( )
(Observed frequency – Expected frequency)2 are in [ ] Table 1 is produced for 7 diagnoses occurring in the hearing diagnosis field. For example, if 535 of the hearing diagnosis fields of the records of patients ‘aged <= 54’ years contained the diagnosis ‘TINNITUS’, we would record a value of 535 for that term being associated with that category. These values were the “observed” values, denoted
O
ij in the formula above. The corresponding “expected” valuesE
ijwere foundby the formula:
Row total x Column total / Grand Total
The row total for ‘TINNITUS’ diagnosis is the total number of times the ‘TINNITUS’ diagnosis was assigned to patients in both age categories = 535 + 592 = 1127. The column total for ‘age<=54’ is the total number of patients in that age group over all 7 diagnoses = 702. The grand total is the total number of patient records in the study = 1364. Thus the “expected” number of patients diagnosed with ‘TINNITUS’ in the ‘age<=54’ group was 1127 * 702 / 1364 = 580.02. The significance of this is that the expected value is greater than
the observed value, suggesting that there is a negative degree of association between the ‘TINNITUS’ diagnosis and the category ‘age<=54’. The remainder of the test is then performed to discover if this association is statistically significant.
Next the
O
ij andE
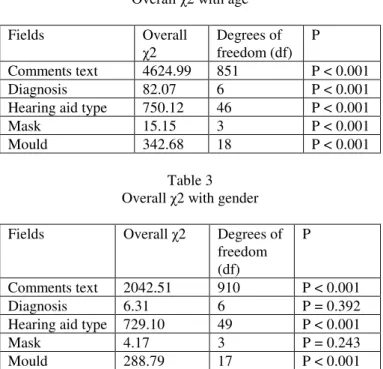
ij values were used to calculate an overall chi-squared value for the relationship between each of the text variables (hearing aid type, mould, mask and text comments fields) and age, as shown in Table 2. From this data we can show, with 99.9% confidence, that these keywords were not randomly distributed, and that some keywords definitely are associated with age. Similarly the associations of each of these variables with gender are shown in Table 3. Here we see that there are significant associations between the comments text, hearing aid type and mould with gender, but there are no significant associations between diagnosis and mask with gender.Table 2 Overall 2 with age
Fields Overall
2
Degrees of freedom (df)
P Comments text 4624.99 851 P < 0.001
Diagnosis 82.07 6 P < 0.001
Hearing aid type 750.12 46 P < 0.001
Mask 15.15 3 P < 0.001
Mould 342.68 18 P < 0.001
Table 3 Overall 2 with gender Fields Overall 2 Degrees of
freedom (df)
P
Comments text 2042.51 910 P < 0.001
Diagnosis 6.31 6 P = 0.392
Hearing aid type 729.10 49 P < 0.001
Mask 4.17 3 P = 0.243
Mould 288.79 17 P < 0.001
Having shown that overall, some keywords are more associated with some category; the next step was to discover exactly which individual keywords were most (and least) associated with each category. To do this, we considered the individual contributions of each word in each category to the overall chi-squared value for each text field, found by the formula
ij ij ij
E
E
O
X
2
2
(
−
)
=
Bonferroni correction [5] to control the rate of Type I errors where a word spuriously appears to be typical of a cluster.
Table 4
Categories with positive and negative keywords for age Positive keywords negative keywords Age<=54 **
OTHERS
**
Not found
Age>54 **
Not found
** OTHERS, FAMILIAL Age<=56 ****
Not found
****
Not found
Age>56 ****
Not found
****
Not found
Age<=70 *
masker, tinnitu, 2000, help, progress, dna, fta, counsel
***
PPCL, ITEHH, ITENL, -, PFPPCL, PPC2, BE101, OTHERS *****
N8, SIL, V2
*
dv, staff, map, ref, wax, reqd, gp, contact, cic, insert, reinstruct
***
ITENN, BE34, ITENH, BE36
***** 2107V1 Age>70 *
dv, staff, map, ref, wax, reqd, gp, contact, cic, insert, reinstruct
***
ITENN, BE34, ITENH, BE36
***** 2107V1
*
masker, tinnitu, 2000, help, progress, dna, fta, counsel
***
PPCL, ITEHH, ITENL, -, PFPPCL, PPC2, BE101, OTHERS ***** N8, SIL, V2
Note: words after * are for comment text ** are for diagnosis
*** are for hearing aid type **** are for mask
***** are for mould
We wished to be 99.9% confident that a particular keyword was typical of a particular cluster, the corresponding significance level of 0.001 had to be divided by the number of simultaneous tests, i.e. the number of unique words times the number of categories. In the case of words in the text fields,
this gave a corrected significance level of 0.001 / (7 * 2) = .0000714286. Using West’s chi-squared calculator [9], for significance at the 0.001 level with one degree of freedom, we obtained a chi-squared threshold of 15.77. Thus each word in each category with an individual contribution to the overall chi-squared value of more than 15.77 was taken to be significantly associated with that category at the 0.001 level.
Table 5
Categories with positive and negative keywords for gender positive keywords negative keywords
Male *
he, wife **
Not found
***
ITEHH, ITENH
****
Not found
***** V2, N8, IROS
* dv **
Not found
***
ITEHN, BE34, ITENN ****
Not found
*****
Not found
Female * dv **
Not found
***
ITEHN, BE34, ITENN ****
Not found
*****
Not found
* he, wife **
Not found
***
ITEHH, ITENH ****
Not found
***** V2, N8, IROS
Note: words after * are for comment text ** are for diagnosis
*** are for hearing aid type **** are for mask
***** are for mould
associated with this category were those with high gain, while low hearing aid types were negatively associated with this category.
For these experiments, we used all the records available in the database for each field under study, keeping the criterion that none of the field values should be empty. In Table 4, values of 54 and 56 were calculated as the median ages of the diagnosis and mask records respectively. 70 was the median age of the records for comment text, hearing aid type and mould. In both tables (Table 4 and Table 5) some keywords in the comments text were abbreviations such as ‘DV’ for ‘Domestic Visit’ and ‘DNA’ for ‘Did Not Attend’. ‘Tinnitus’ appears as ‘tinnitu’ in the tables, since all the text was passed through Porter’s stemmer [10] for the removal of grammatical endings. Similarly ‘unabl’ is the stemmed form of ‘unable’.
IV. MEASURES OF ASSOCIATION IN CATEGORICAL DATA Yule’s Q is a measure to find the strength of association for between categorical variables. Unlike the chi-squared test, which tells us how certain we can be that a relationship between two variables exists, Yule’s Q gives both the strength and direction of that relationship [6]. In the following 2 x 2 table,
Present Absent
Present A B
Absent C D
Yule’s Q is given by
BC
AD
BC
AD
Q
+
−
=
[2]where A, B, C and D are the observed quantities in each cell. Yule’s Q is in the range -1 to +1, where the sign indicates the direction of the relationship and the absolute value indicates the strength of the relationship. Yule’s Q does not distinguish complete associations (where one of the cell values = 0) and absolute relationships (where two diagonally opposite cell values are both zero), and is only suitable for 2 x 2 tables.
In Tables 6 – 10, Yule’s Q values for age with comment text, diagnosis, hearing aid type, mask and mould are given. Similarly, in the Table 11 – 13, Yule’s Q values for gender with comment text, hearing aid type and mould are given. “(P)” and “(A)”, stand for present and absent.
In Table 6, a Yule’s Q value of 0.75 shows that there is a positive association between the keyword ‘progress’ and the category ‘age<=70’, which can be restated as a negative association between the keyword ‘progress’ and the category ‘age>70’. In Table 7, for ‘diagnosis’ there is an absolute association between ‘FAMILIAL’ and ‘age<=54’, resulting in a Yule’s Q value of 1. This should be viewed in comparison to the chi-squared value for the same association, 17.20 (p < 0.001), showing both that the association is very strong and that we can be highly confident that it exists. The presence of this association shows that a higher proportion of younger people report to the hearing aid clinic with familial (inherited) deafness than older people.
Table 6
Yule’s Q for comment text and age
Comment text
age <= 70 (P)
age >70
(P)
age<=70 (A)
age>70 (A)
Yule’s Q
progress 93 13 46833 45555 0.75
dna 105 20 46821 45548 0.67
masker 565 126 46361 45442 0.63
tinnitus 385 123 46541 45445 0.51
help 222 84 46704 45484 0.44
counsel 191 80 46735 45488 0.40
2000 288 125 46638 45443 0.38
fta 542 332 46384 45236 0.23
gp 370 615 46162 55060 -0.16
wax 341 601 46191 55074 -0.19
ref 248 487 46284 55188 -0.24
contact 37 129 46495 55546 -0.49
insert 23 102 46509 55573 -0.58
reqd 15 111 46517 55564 -0.72
cic 10 76 46522 55599 -0.73
staff 17 132 46515 55543 -0.73
map 15 125 46517 55550 -0.75
dv 29 245 46503 55430 -0.75
reinstruct 8 68 46524 55607 -0.75
Table 7
Yule’s Q for diagnosis and age
Diagnosis age
<= 54 (P)
age >54
(P)
age<=54 (A)
age>54 (A)
Yule’s Q
FAMILIAL 18 0 684 662 1.00
OTHERS 113 44 589 618 0.46
Table 8
Yule’s Q for hearing aid type and age
Hearing aid type
age< = 70 (P)
age> 70 (P)
age<= 70 (A)
age>70 (A)
Yule’s Q
PFPPCL 42 1 11105 10899 0.95
PPCL 78 5 11069 10895 0.88
BE101 44 4 11103 10896 0.83
PPC2 53 6 11094 10894 0.79
ITENL 123 35 11024 10865 0.55
OTHERS 103 37 11044 10863 0.46
ITEHH 536 317 10611 10583 0.26
- 4668 3947 6479 6953 0.12
BE34 640 882 10507 10018 -0.18
ITENH 403 592 10744 10308 -0.21
ITENN 683 1063 10464 9837 -0.25
Table 9 Yule’s Q for mask and age
Mask
age <= 56 (P)
age >56
(P)
age<=56 (A)
age>56 (A)
Yule’s Q
AMTI 50 25 257 261 0.34
ITEM 20 12 287 274 0.23
OTHERS 230 230 77 56 -0.16
RM675 7 19 300 267 -0.51
Table 10
Yule’s Q for mould and age
Mould age
<= 70 (P)
age >70
(P)
age<=70 (A)
age>70 (A)
Yule’s Q
N8 261 94 10873 10805 0.47
SIL 255 101 10879 10798 0.43
V2 575 397 10559 10502 0.18
2107V1 601 913 10533 9986 -0.23
Table 11
Yule’s Q for comment text and gender Comment
text M (P) F (P) M (A) F (A)
Yule’s Q
he 67 2 46465 55673 0.95
wife 44 2 46488 55673 0.93
dv 80 254 46452 55421 -0.45
Table 12
Yule’s Q for hearing aid type and gender Hearing
aid type M (P) F (P) M (A) F (A)
Yule’s Q
ITEHH 665 201 11080 12467 0.58
ITENH 725 295 11020 12373 0.47
ITEHN 1280 1732 10465 10936 -0.13 ITENN 734 1038 11011 11630 -0.14
Table 13
Yule’s Q for mould and gender
Mould M (P) F
(P) M (A) F (A)
Yule’s Q
IROS 80 24 11671 12644 0.57
V2 640 342 11111 12326 0.35
N8 253 141 11498 12527 0.32
Familial deafness is relatively rare but can affect any age group, while “others” would include “old-age deafness” (presbyacusis) which is relatively common, but obviously restricted to older patients. However, in Table 10, Yule’s Q for ‘V2’ is 0.18, which shows only a weak association between mould and ‘age<=70’, while the chi-squared value for the same association of 30.25 (P < 0.001), showed that it is highly likely that the association exists. In Table 12, Yule’s Q for ‘ITEHN’ (a type of hearing aid worn inside the ear) is
-0.13, which shows a weak negative association between ‘ITEHN’ and ‘male’, or in other words, a weak positive association between ‘ITEHN’ and ‘female’. In comparison, the chi-squared value given in Table 5 for the same association of 43.36 (P < 0.001), showed that we can be highly confident that the relationship exists. These results show the complementary nature of the chi-squared and Yule’s Q results: in all three cases the chi-squared value was highly significant, suggesting that the relationship was highly likely to exist, while Yule’s Q showed the strength (strong in the first case, weak in the others) and the direction (positive in the first two cases, negative in the third) of the relationship differed among the three cases.
V. SUPPORT AND CONFIDENCE FOR ASSOCIATIONS In market basket analysis, A might refer to transactions in a travel agent’s where a holiday is booked and B might refer to transactions in a travel agent’s where money is changed. Support is the frequency of transactions that contain both the attributes (A U B) of the rule A B [11]. It can also be given as a probability P(A U B) [4]. Confidence is the frequency of transactions containing A that also contain B in the rule A B [11]. It is also given as probability P(B/A) [4]. Confidence is also defined as the ratio of support(A U B)/support(A) [12]. It is a measure of the strength of a rule. To summarize,
)
(
)
(
support
A
B
=
P
A
∪
B
)
(
support
)
(
support
)
/
(
)
(
confidence
A
B
A
A
B
P
B
A
=
=
∪
[4] Discovery of rules in the form A B would help in the development of an audiological decision support system. In general, A would be easy to determine variables such as age and gender, while B would be the goals of the system, such as choice of hearing aid-type, masker, mould and diagnosis.
‘TINNITUS’, thus swamping the data for all the other diagnoses. This is probably because in many cases, the task of the hearing aid clinic is to treat tinnitus, and thus it is important to record the diagnosis. The other diagnoses are not treated directly in the hearing aid clinic, although they do influence the shape of the audiogram which is the most important criterion in hearing aid selection.
Table 14
Support and Confidence for diagnosis and age
age<=54 age>54
Diagnosis Supp Conf Supp Conf
DOWNS 0.01 0.02 0.00 0.00
FAM 0.01 0.02 0.00 0.00
FAMILIAL 0.01 0.03 0.00 0.00
INFO 0.00 0.01 0.01 0.03
REV 0.01 0.01 0.01 0.01
TINNITUS 0.39 0.76 0.43 0.89
OTHERS 0.08 0.16 0.03 0.07
Note: ‘Supp’ denotes support ‘Conf’ denotes confidence
Table 15
Support and Confidence for diagnosis and gender
Male Female
Diagnosis Supp Conf Supp Conf
DOWNS 0.01 0.01 0.01 0.02
FAM 0.00 0.01 0.00 0.01
FAMILIAL 0.00 0.01 0.01 0.02
INFO 0.01 0.01 0.01 0.02
MENINGITIS 0.00 0.01 0.00 0.00
REV 0.01 0.01 0.01 0.01
TINNITUS 0.44 0.82 0.37 0.81
OTHERS 0.07 0.12 0.05 0.11
Note: ‘Supp’ denotes support ‘Conf’ denotes confidence
VI. CONCLUSION
In this work we looked for significant associations in heterogeneous audiology data as part of an overall project with the ultimate aim of looking for factors influencing which patients would most benefit most from being fitted with a hearing aid. We have discovered typical and atypical words related to different fields of audiology data, by first using the chi-squared measure to show which relations most probably exist, then using Yule’s Q measure of association to find the strength and direction of those relations. We also calculated support and confidence for all relations between age and diagnosis, and gender and diagnosis, but were unable to find many rules with high support and confidence due to the very high proportion of one type of diagnosis (‘TINNITUS’) in the records. However, we feel that given an audiology database where a diagnosis was routinely recorded for every patient, more rules in the form A B would be found. This would form the basis of a decision support system for audiologists,
where the variables in A would be easily obtained data such as age, gender, and audiogram, and B would be predictions of the most suitable hearing aid, tinnitus, masker or diagnosis.
It may be that for the 2 x 2 contingency tables the odds ratio would be a better measure of effect rather than support and confidence. This will be examined in future work.
Rules found by data mining should not only be accurate and comprehensible, but also “surprising”. McGarry presents a taxonomy of “interestingness” measures whereby the value of discovered rules may be evaluated [13]. In this paper we have looked at objective interestingness criteria, such as statistical significance and the confidence and support for the discovered rules, but we have not yet considered subjective criteria such as unexpectedness and novelty. These require comparing machine-derived rules with the prior expectations of domain experts. A very important subjective criterion is “actionability”, which includes such considerations as impact: will the discovered rule lead to any changes in current audiological practice?
ACKNOWLEDGMENT
We wish to thank Maurice Hawthorne, Graham Clarke and Martin Sandford at the Ear, Nose and Throat Clinic at James Cook University Hospital in Middlesbrough, England, UK, for making the large set of audiology records available to us.
REFERENCES
[1] P. C. Pendharkar, J. A. Rodger, G. J. Yaverbaum, N. Herman, M. Benner, “Association, statistical, mathematical and neural approaches for mining breast cancer patterns,” Expert Systems with Applications, Elsevier Science Ltd., vol. 17, 1999, pp. 223-232.
[2] M. Bramer, Principles of Data Mining. Springer 2007, pp. 187-218. [3] C. Ordonez, N. Ezquerra and C. A. Santana, “Constraining and
summarizing association rules in medical data”, Knowledge and Information Systems, Springer, N. Cercone, et al., Eds., 2006, pp. 259-283.
[4] J. Han, M. Kamber, Data Mining Concepts and Techniques. 2nd ed. Morgan Kaufmann Publishers, 2006, pp. 227-272.
[5] D. G. Altman, Practical statistics for medical research. Published by Chapman & Hall. 1991, pp. 241-248, 211,271.
[6] D. Lucy, Introduction to statistics for forensic scientists. John Wiley & Sons Ltd, 2005, pp. 45-52.
[7] M. Oakes, R. Gaizauskas, and H. Fowkes et al., “Comparison between a method based on the chi-square test and a support vector machine for document classification,” Proceedings of ACMSIGIR, New Orleans, 2001, pp. 440-441.
[8] A. Agresti, Categorial data analysis, 2nd ed. Wiley Series in Probability and Statistics, 2002, pp. 80.
[9] Chi-square calculator (2010, Mar 12) [Online]. Available:
www.stat.tamu.edu/~west/applets/chisqdemo.html
[10] M. F. Porter, “An algorithm for suffix stripping,” Program, Vol. 14, No. 3, 1980, pp. 130-137.
[11] H. Kwasnicka, and K. Switalski, “Discovery of association rules from medical data – classical and evolutionary approaches,” Annales, Informatica, vol. IV, M. Ganzha et al., Eds. Universytet Marii Curie-Skłodowskiej, ISSN 1732-1360, 2006, pp. 204-217.
[12] C. Ordonez, C. A. Santana, and L. Braal, “Discovering interesting association rules in medical data,” ACM DMKD workshop, 2000, pp. 78-85.