www.solid-earth.net/3/313/2012/ doi:10.5194/se-3-313-2012
© Author(s) 2012. CC Attribution 3.0 License.
Solid Earth
Using open sidewalls for modelling self-consistent lithosphere
subduction dynamics
M. V. Chertova, T. Geenen, A. van den Berg, and W. Spakman
Utrecht University, Utrecht, The Netherlands
Correspondence to:M. V. Chertova ([email protected])
Received: 11 May 2012 – Published in Solid Earth Discuss.: 18 June 2012
Revised: 6 September 2012 – Accepted: 8 September 2012 – Published: 9 October 2012
Abstract.Subduction modelling in regional model domains, in 2-D or 3-D, is commonly performed using closed (imper-meable) vertical boundaries. Here we investigate the merits of using open boundaries for 2-D modelling of lithosphere subduction. Our experiments are focused on using open and closed (free slip) sidewalls while comparing results for two model aspect ratios of 3:1 and 6:1. Slab buoyancy driven subduction with open boundaries and free plates immedi-ately develops into strong rollback with high trench retreat velocities and predominantly laminar asthenospheric flow. In contrast, free-slip sidewalls prove highly restrictive on sub-duction rollback evolution, unless the lithosphere plates are allowed to move away from the sidewalls. This initiates re-turn flows pushing both plates toward the subduction zone speeding up subduction. Increasing the aspect ratio to 6:1 does not change the overall flow pattern when using open sidewalls but only the flow magnitude. In contrast, for free-slip boundaries, the slab evolution does change with respect to the 3:1 aspect ratio model and slab evolution does not re-semble the evolution obtained with open boundaries using 6:1 aspect ratio. For models with open side boundaries, we could develop a flow-speed scaling based on energy dissi-pation arguments to convert between flow fields of different model aspect ratios. We have also investigated incorporating the effect of far-field generated lithosphere stress in our open boundary models. By applying realistic normal stress condi-tions to the strong part of the overriding plate at the sidewalls, we can transfer intraplate stress to influence subduction dy-namics varying from slab roll-back, stationary subduction, to advancing subduction. The relative independence of the flow field on model aspect ratio allows for a smaller modelling do-main. Open boundaries allow for subduction to evolve freely and avoid the adverse effects (e.g. forced return flows) of
free-slip boundaries. We conclude that open boundaries in combination with intraplate stress conditions are to be pre-ferred for modelling subduction evolution (rollback, station-ary or advancing) using regional model domains.
1 Introduction
In the past decades, numerical modelling of lithosphere sub-duction has advanced considerably by incorporating cou-pling between plates, between plates and mantle, and by in-corporating the complexity of detailed subduction zone pro-cesses (see Gerya, 2011, for a review and references therein). Up to now modelling of regional subduction evolution is still being performed within spatially bound modelling do-mains in 2-D or 3-D (e.g. Quinquis et al., 2011; Jadamec and Billen, 2012). The limited spatial domain particularly re-quires prescribing boundary conditions on the vertical side-walls of the domain. These conditions are an important in-fluence on the development of the model interior (Quinquis et al., 2011; Duretz et al., 2011, 2012; Ueda et al., 2012). The usual attempt to reduce possible sidewall influence is by moving these far away from where subduction occurs by us-ing a sufficiently large aspect ratio of model length to depth (e.g. Cizkova et al., 2012). Boundary conditions on the ver-tical sidewalls can be no-slip (no flow at the boundary), free slip (impermeable; no flow through the boundary and zero traction in tangential direction), or open to some particular form of through-flow.
conditions requiring that the through-flow at one side is the mirror image of through-flow on the other (e.g. Enns et al., 2004; Capitanio et al., 2010).
Open boundaries for which the horizontal in- and outflow are defined by a fully internally developed flow, have hardly been used and are the main topic of the present paper. Such open boundaries basically prescribe a hydrostatic pressure condition on the boundary preventing the model to collapse while horizontal in and outflow is free, in the sense that it is driven by the internal dynamics and the usual condition of in-compressible flow. Among the range of boundary conditions used, open boundaries may fit best to real-mantle flow con-ditions surrounding subduction zones. We know of only one example (Quinteros et al., 2010) of Eulerian modelling with non-periodic open boundaries.
Our aim in this paper is to investigate the benefits of using open boundaries as compared to using closed (free slip) con-ditions at the sidewalls of a two-dimensional (2-D) model domain. We focus on modelling self-consistent subduction driven by internal buoyancy and boundary stress conditions only, i.e. no kinematics are prescribed, in the presence of an overriding (oceanic) plate. Our focus will be on the effects of boundary conditions and model aspect ratios on subduction and mantle evolution. As our results show strong differences between using free slip and open boundaries, we are con-sidering first order aspects only. Our results also show that with open sidewalls increasing the model aspect ratio does not change the overall evolution of subduction and mantle flow. In contrast, closed boundaries keep influencing the evo-lution of the model even for large model size of 6000 km by 1000 km. The primary reason is that closed sidewalls basi-cally cause return flows from both sides towards the centre of the model, which feeds back artificially into the evolving subduction process. We expect this also to hold for 3-D mod-els despite the larger degree of freedom to develop lateral flow.
2 Model description
2.1 Model setup
We model self-consistent, internally driven, lithosphere sub-duction in the presence of an overriding plate in a 2-dimensional Cartesian geometry. Our main focus is on how distinctly different boundary conditions on the two sidewalls, open versus impermeable boundaries, affect subduction evo-lution. We will also investigate whether increasing the aspect ratio of the model domain from 3:1 (3000 km×1000 km) to 6:1 (6000 km×1000 km) is of influence, particularly, in re-ducing any observed adverse effect of boundary conditions.
The boundary condition for the top and the bottom of the box is free slip (impermeable). The surface condition will not allow for modelling topography but, as discussed later in Sect. 2.3, we impose a low-viscosity top layer of crust, which
will partly compensate for the impermeability condition by allowing for lithosphere bending prior to subduction. For the right and left sides, different types of boundary conditions were implemented: open boundaries or free-slip boundaries. Open boundaries are implemented by constraining zero tan-gential velocity on the boundary and by imposing a litho-static pressure condition for the normal stress on the bound-ary:σn=Plith.
This allows for horizontal in- and outflow purely driven by the internal dynamics of the model. The pressure condi-tion prevents that the model collapses. As discussed in the introduction, open boundaries are hardly used in subduction modelling, but provide a more natural simulation of the man-tle outside the model domain than the more common free slip, impermeable boundary conditions. The free-slip con-dition prevents material transport through the boundary and forces the flow parallel to the boundary.
2.2 Governing equations
We adopt the Boussinesq approximation comprising three coupled equations, namely mass conservation of an incom-pressible viscous fluid,
∇ ·u=0 (1)
the Stokes equation describing force balance,
−∇P+ ∇ ·τ =f (ρ) (2)
and the heat equation, which here only takes into acount heat diffusion and heat advection:
ρcp
dT
dt − ∇ ·(κ∇T )=0 (3)
(for explanation of symbols see Table 1). This system of equations is solved numerically using the finite element mod-elling package SEPRAN (Segal and Praagman, 2005). The mesh element size varies from 1.5 km in the trench region to 20 km at the bottom of the model. Advection of the low viscosity material defining the crust and wedge is performed with a Lagrangian tracer technique where material properties are defined on tracers that are advected with the flow. Tracers are distributed initially only over the top 200 km of our do-main where we use them to define rheological properties for a low viscosity top layer and wedge.
2.3 Rheological model
A composite rheology is used, which comprises dislocation and diffusion creep and a viscosity maximumηmax(Fig. 1). The effective viscosityηeffis determined as
1
ηeff = 1
ηdiff + 1
ηdisl + 1
Table 1.Parameters of the model.
Symbol Meaning Value Dimension
cp Specific heat 1250 J kg−1K−1
k Thermal conductivity 4.27 W m−1K−1
R Gas constant 8.31 J K−1m−3
Ra Thermal Rayleigh number 1.7×10⁷
-t Time:
slab initialisation 3.5 My slab retreating 10–30 My Age of the lithosphere 100 My
T Temperature – K
T0 Surface temperature 273 K δT Vertical temperature contrast 1700 K
vsubd Initial subduction velocity 10 cm yr−1
u Velocity – m s−1
α Thermal expansion coefficient 3×10⁻⁵ K−1
ρ0 Reference density 3413 kg m−3 h Height of the model domain 1000 km
Width of the domain 3000–6000 km Reference strain rate 10−18 s−1
η Reference viscosity 1021 Pa s
κ Thermal diffusivity 10−6 m2s−1 Phase transition at 410 km:
clapeyron slope 4.1 MPa K−1 density contrast 273 kg m−3 Phase transition at 660 km:
clapeyron slope –1.9 MPa K−1 density contrast 342 kg m−3 Viscosity of LVZ 1019 Pa s
Ŵk Phase function forkth phase – –
g Gravitational acceleration 9.8 m s−2
P Hydrostatic pressure – Pa Rheological parameters, wet olivine:
Adif diffusion prefactor 5.3×10¹⁵ s−1
Adis dislocation prefactor 2.0×10¹⁸ s−1 b Burgers vector 5×10⁻¹⁰ m
d grain size 1×10⁻³ mm
m grain size exponent 2.5 –
n stress exponent dislocation creep 3 –
V activation volume, diffusion creep 5 cm3mol−1
V activation volume, dislocation creep 10 cm3mol−1
E activation energy, diffusion creep 240 KJ mol−1
E activation energy, dislocation creep 423 KJ mol−1
τij ijth component of the stress tensor – –
˙
ǫij ijth component of the strain rate – –
ui ith component of the velocity – –
withηmax=1024Pas limiting the effective viscosity in the coldest parts of the lithosphere, with the viscosity due to dif-fusion creep,
ηdiff=µA−diff1(
b d)
−mexpEdiff+P Vdiff
RT
(4)
and dislocation(power law) creep
ηdisl=µA −1n dislǫ˙
1−n n exp
Edisl+P Vdisl
nRT
, (5)
whereǫ˙is the second invariant of the strain-rate tensor,Adiff,
Adisare diffusion and dislocation creep viscosity prefactors,
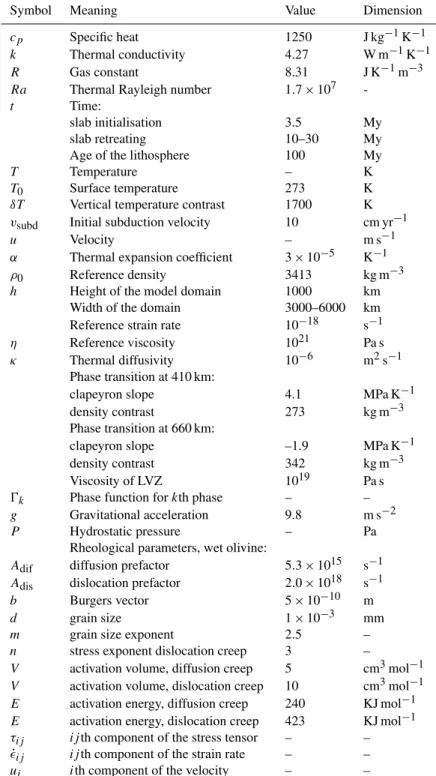
Fig. 1.The rheology and flow field after the initial 3.5 My of kine-matically forced subduction consistent with(A)– open sidewalls, (B)– closed sidewalls. The colour scale shows 10-logarithm of ef-fective viscosity. White lines corresponds to the approximate posi-tion of phase transiposi-tion zones at 410 km and 660 km.
size, m is the grain size exponent,Vdiff,dis andEdiff,dis are activation volume and activation energy for diffusion and dislocation creep, respectively,P is the lithostatic pressure andT-temperature (Table 1). Parameters are taken for wet olivine (Karato et al., 2001), values are given in Table 1. Ac-tivation volumes, energy and grain size were chosen to fit seismic studies and postglacial rebound estimations of up-per mantle and astenosphere viscosities (Kaufmann, 2000; Burgmann and Dresen, 2008; Simmons et al., 2006).
2.4 First order phase changes
Our models include the two major phase transitions at ap-proximately 410 km and 660 km depth. The values of the Clapeyron slope and density contrast are given in Table 1. These parameters are chosen following Billen (2010). The 410 km phase change contributes to the buoyancy force and increases slab pull. The phase change at 660 km has a posi-tive buoyancy effect on cool material resisting slab penetra-tion to the deeper mantle. We ignore thermal effects associ-ated with the phase changes. Phase transitions are parameter-ized in the model with the phase-transition function:
Ŵk=
1 2
1+sinπ zdiff
w
, (6)
wherezdiff=z−ztr−γk·(T−Ttr),w is the half-width of
kth transition zone, ztr andTtr are the reference depth and temperature of the phase transition, respectively, γk is the
Clapeyrone slope,T is the temperature (Cristensen and Yuen, 1985; van Hunen, 2001).
2.5 The starting configuration leading to the initial buoyancy field
To enable internally-driven subduction, first an initial buoy-ancy distribution is created by kinematically forced subduc-tion (10 cm yr−1) along an arc-shaped fault extending from 0 to 300 km depth. The lithosphere temperature distribu-tion prior to subducdistribu-tion is determined from the equadistribu-tion of cooling of a semi-infinite half-space (Turcotte and Schubert, 2002) for a lithosphere age of 100 My. Boundary tempera-ture conditions areT =273 K at the surface,T =2000 K at the bottom. On the side boundaries we prescribe a stationary temperature profile during the subduction process. This also defines the thermal structure of the overriding plate.
We implemented a 10 km thick weak layer (1019Pas) on the top of the subducted plate (Han and Gurnis, 1999; Manea and Gurnis, 2007; Cizkova et al., 2007; Behounkova and Cizkova, 2008; Babeyko and Sobolev, 2008; Quinteros et al., 2010). This mimics a subduction channel and proves sufficient for initiating and maintaining subduction in our modelling. An accretionary wedge of weak crust is formed above the subduction zone and has the advantage to prevent artificial rheological coupling between the subducting and overriding plates. The presence/absence of the accretionary wedge only leads to small differences in dip angle and stress field of the trench zone and does not affect the overall sub-ducting slab evolution for the boundary conditions we con-sider in our models, we conclude from various tests. The fo-cus in our paper is on the large-scale evolution of the subduc-tion system linked to various boundary condisubduc-tions and aspect ratios of the model domain rather than on the detailed evolu-tion of the plate boundary region.
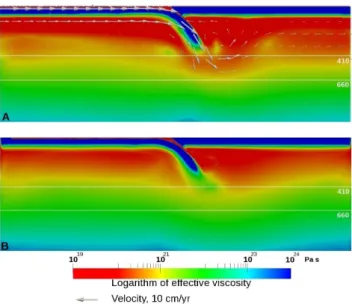
Figure 1a shows the initial rheology field for the model with open boundaries. In the oldest part of the slab, both dislocation and diffusion creep give high viscosity values, which are limited here byηmax=1024Pas. In the astheno-sphere viscosity decreases to values of 1019Pas, below which it increases to 0.5×10²¹Pas in the transition zone and to 1022Pas at the top of the lower mantle. The tip of the slab in this initial configuration shows thickening due to mantle resistance, which is also visible in theτ22 component of the stress distribution (Fig. 2). The starting configuration, rhe-ology and flow field, using free-slip sidewalls is illustrated in Fig. 1b. The two types of boundary conditions, closed or open, lead to a different internal flow field and velocity gradi-ent field on which viscosity depends. Therefore, the starting configuration, particularly the viscosity field, depends on the boundary conditions used and is different when using open sidewalls or free-slip sidewalls.
Fig. 2.Stress componentτ22for the initial model with open
bound-aries after 3.5 My of kinematically forced evolution (Fig. 1a). Note the down-dip compression in the slab.
toηmax=1024Pas. The low viscosity crustal layer and ac-cretionary wedge are shown in yellow.
3 Results of numerical modelling
We first focus on models with open versus closed boundary conditions and on model domains with different aspect ra-tios. This concerns end-member models driven by slab buoy-ancy only. Subsequently, we incorporate far-field effects ad-ditionally constraining the motion of the upper plate. These are imposed by means of a normal-stress boundary condition (τ11) acting on the strong lithosphere at the sidewall. This condition allows investigating stationary or advancing sub-duction using open boundaries of which we will show several results.
After the initial 3.5 My of kinematically forced subduction has provided an initial buoyancy configuration as discussed in Sect. 2.5, the forcing is removed and the internal dynam-ics take over in driving subduction. We label the models us-ing “O” to denote open, “C” for closed, “R” for “spreadus-ing ridge”, and “3” and “6” to denote aspect ratios 3:1, and 6:1, respectively.
3.1 Open versus closed vertical boundaries and aspect ratio of 3:1
For the models with aspect ratio 3:1, Fig. 4 shows the veloc-ity field and rheology structure of four models (columns) at 2 My intervals (rows) and with different boundary conditions on the left and right sidewalls.
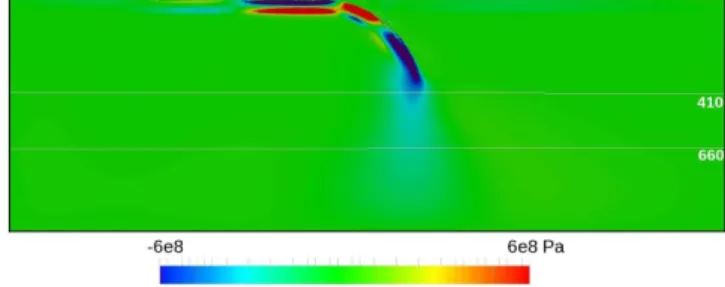
Figure 4a depicts the evolution of the model OO3 with two open side boundaries. During the initial stage, about 3.5– 4 My from the beginning of the subduction, we observe a strong horizontal flow associated with the subducting plate. This flow pattern bends into the subduction zone following the slab. During this early stage, the upper plate does not move appreciably. However, in the next 2 My slab rollback starts and forces an overall left directed horizontal flow of the upper plate and its underlying asthenosphere. The subducting plate is still being pulled into the subduction zone, but with decreasing speed. Around 5.5 My the slab reaches the base
Fig. 3.Dominant deformation mechanism in the initial model with open side boundaries of Fig. 1a. Different colours correspond to regions where the individual deformation mechanism are dominant.
of the upper mantle and further subduction meets resistance due to slab interaction with the 660 km phase transition and with the increased mantle viscosities of the lower mantle. This is followed by the onset of increased slab retreat. The overriding plate attains velocities of 10–15 cm yr−1, while the advance velocity of the subducting plate drops down to small values (2–3 cm yr−1). During the subsequent sub-duction evolution, we observe strong horizontal left-directed laminar flow concentrated in the asthenosphere and charac-terized by low viscosity (red colours) in Fig. 4a. This de-velopment proves to be characteristic for models with open boundaries and driven by slab buoyancy only.
Figure 4b illustrates the evolution of a model with a closed left and an open right boundary (CO3). The closed left boundary effectively fixes the upper plate to the side. Dur-ing the whole evolution of the subduction process, we ob-serve a low velocity magnitude (more than 10 times lower than for model OO3). As a result also the viscosity struc-ture is different from model OO3. The minimum viscosities for the asthenosphere, corresponding to lower strain rate, are higher (around 1 order of magnitude), and the rheological width of the asthenosphere is reduced considerably. After the slab reaches the top of the lower mantle, we observe no more trench retreat and the velocity magnitude drops to al-most zero. This occurs because the left part of the domain effectively forms a closed volume at this stage in which the slab is blocking flow to the right part of the domain. This is a pure 2-D effect. In 3-D modelling flow is developing at the (open) lateral edge of the slab, which allows material to move away sideways from below the slab (e.g. OzBench et al., 2008; Stegman et al., 2010; Funiciello et al., 2003; Piro-mallo et al., 2006).
Fig. 4.Evolution of the subduction process for model OO3 with open boundaries, model CO3closed left and open right boundary, model
CCR3 with closed right and left boundaries with spreading centre on the right boundary and model CRCR3 with closed boundaries. Arrows show the direction and magnitude of flow field. Identical scaling of the velocity vectors applies to all cases.
right corner of the model (CCR3) (e.g. Enns et al., 2004). The spreading ridge enables the lithosphere plate to separate from the vertical boundary by allowing hot asthenosphere to flow upward. This facilitates more free lateral movement of the upper plate and is initiated by defining a warm weak zone at the boundary in the initial temperature field. For this model we also observe much lower flow magnitudes (1 cm yr−1 af-ter arriving of the slab at the 660 km boundary) compared to OO3 and, correspondingly, a different evolution of the vis-cosity structure. The slab behaviour and trench rollback are similar to the model CO3 except one difference: in model CCR3 a gap between the subducted slab and the overriding plate forms. This gap is filled with asthenosphere material as can be seen from Fig. 4c mimicking the formation of a back-arc basin. While in model CO3, the open right boundary al-lows for modest inflow of asthenosphere material with flow speeds comparable to the overlying upper plate, this does not happen in model CCR3. When the slab reaches the bottom of the upper mantle material exchange with the left part of the model is mostly blocked as in model CO3. However, the closed right boundary now forces an asthenospheric return flow in response to slab rollback with larger magnitude than the free upper plate can attain. As a consequence back-arc basin opening develops.
Lastly, Fig. 4d illustrates the evolution of a model with closed boundaries but with spreading ridges in both upper corners (CRCR3) allowing both lithosphere plates to sep-arate from the sidewall. Although the 3:1 aspect ratio was
wide enough to enable the development of large horizontal flow in the model with open boundaries OO3, this proves more complicated for model CRCR3 with closed boundaries in combination with free plates. We observe strong bound-ary influence on the motion of the plates and the flow field around the slab. This flow is directed upward close to the vertical boundaries and pushes both plates toward the sub-duction zone. For this model with closed boundaries and free plates, we observe a lower velocity for the overriding plate (5–6 cm yr−1on average) compared to OO3 model and higher viscosities for the asthenosphere. The rollback pro-cess develops slower than in model OO3, but the evolution of the slab and the overriding plate, as well as the evolu-tion of rollback, are more similar to the model OO3 than to models CO3and CCR3. No back-arc basin evolves in model CRCR3. The reason is that, while rolling back, the subduct-ing plate is still advancsubduct-ing as can be inferred from the slab reaching larger depths, which reduces the sinking velocity and no gap appears between upper and lower plate.
3.2 Comparison of the end-member (OO3 and CRCR3) models
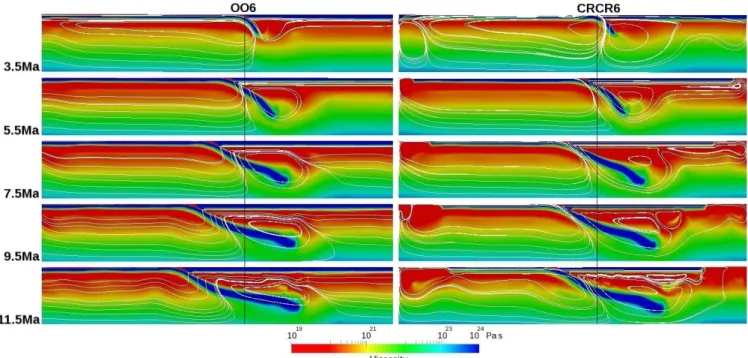
Fig. 5.Snapshots of the effective viscosity and flow pattern for 2 subduction models, on the right-model domain with ratio 6:1, closed boundaries (CRCR6), on the left-model domain with ratio 6:1, open boundaries (OO6).
of the ridge push from the spreading centres at both sides of the subduction zone. The flow patterns in both models are distinctly different: in model OO3 a strong lateral flow is created by slab rollback pushing material out of the model domain. This sets up a high-magnitude channel flow in the low-viscous asthenosphere (peak velocity 16.5 cm yr−1). For the model with closed boundaries, the flow aligns with the slab and splits up into two cells with upward limbs near the side boundaries.
Besides the differences in magnitude of the velocity field, we notice also a difference in rheological structure. For model OO3, at the start of the subduction process, the min-imum viscosities in the asthenosphere are around 1019Pas. For model CRCR3 these are by one order of magnitude larger. These viscosity values decrease with time, but the as-thenosphere in model CRCR3 stays narrower than in model OO3. This feature is related to the dominant deformation mechanism in the asthenosphere, which is strain-rate depen-dent dislocation creep (Fig. 2). Overall, viscosity values in model CRCR3 are larger during the entire subduction pro-cess.
The evolution of the subduction angle is also different be-tween the two end member models OO3 and CRCR3: for model OO3 it gradually decreases while for model CRCR3 it increases with time. This is related to the large difference in the speed of trench retreat while the deep part of the slab is not moving backward. In OO3 this changes the average slab dip and subduction angle. In model CRCR3, the slab pen-etrates deeper into the lower mantle during the subduction
process as a result of a smaller rate of trench retreat creating a steeper average subduction angle.
3.3 Comparison of models with different aspect ratios
One possible way to reduce the influence of the sidewalls conditions on the evolution of lithosphere subduction is to increase the width of the domain, but at increased cost of computations. To investigate this we increased the domain width to 6000 km doubling the aspect ratio to 6:1. Figure 5 shows results for models with open and closed sidewalls with spreading ridges, labelled OO6 and CRCR6, respectively. The flow fields are illustrated here by plotting the instanta-neous streamlines, which show again significant differences between both models.
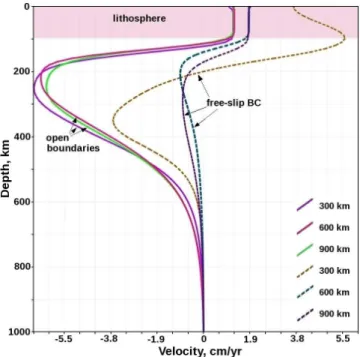
Fig. 6.Velocity profiles for the model with open boundaries, OO6 (solid lines) and model with closed boundaries, CRCR6 (dashed lines). Profiles were taken after 14 My from the beginning of the subduction process, distances from the left side of the model domain indicated in the legend.
velocities are higher for the closed boundary case with free plates. Apparently the slab rollback process produces a sig-nificant pressure gradient that drives laminar flow in the as-tenosphere.
In contrast, model CRCR3 shows weaker slab rollback as-sociated with only little asthenosphere return flow from the far-field. Flow patterns around the slab in model CRCR6 are different from those in OO6 due to the different retreat veloc-ity and the return flow resulting from the closed sidewalls. In model OO6 with open boundaries streamlines cross the slab and leave the domain, illustrating that the boundary does not obstruct the slab migration. For the closed boundary model CRCR6 the flow tends to follow the slab then deflects down-ward and forms closed streamlines. In this model the return flow in the upwelling limbs of the convective cells at both sides contributes to the convergence of the two plates, which puts the subduction channel under lateral compression. For models with a thin crustal weak layer this lateral compression may lead to locking between the subducting and overriding plates. We conclude that using a larger aspect ratio does not reduce the differences in subduction evolution and overall flow field between models with open and closed boundaries.
Fig. 7.Speed of rollback for the model with open boundaries and model with closed boundaries: model OO3 (yellow line), model CRCR3 (green line), model OO6 (blue line) and model CRCR6 (red line).
3.4 Rollback velocity and the overall magnitude of flow speed
The almost uniform velocities within the subducting and overriding plates allow us to focus on the speed of slab roll-back measured from the trench position through time. Fig-ure 7 shows the speed of rollback for the models with as-pect ratio 3:1 and 6:1 and different side boundary conditions. For the models OO3 and CRCR3, yellow and green curves respectively, Fig. 7 shows the difference between rollback speed amounting to a factor of nearly 3 after 8 My of subduc-tion. We observe common trends in the development of the rollback speed: (1) until the slab reaches the 410-km phase change, the speed of rollback increases with a factor of 2; (2) next subduction rollback slows down until the slab reaches the 660-km phase change and the top of the lower mantle; (3) Lastly, slab rollback continues while the tip of the slab is hanging in the highly viscous lower mantle, i.e. without an increase in the penetration depth of the slab.
For model OO3, we observe an increase in rollback speed during this last stage of subduction, which is linked to the trench coming closer to the open boundary. This latter effect is not observed in the 1:6 aspect ratio model OO6 (Fig. 7, blue curve). For model OO6, the rollback speed stabilises after the slab tip gets stuck in the high viscosity lower man-tle. Model CRCR6 (Fig. 7, red curve) with free plates has a particular evolution from initially no rollback to strongly in-creasing speeds peaking around 8 My. This evolution is dom-inated by the detaching of the overriding plate from the right boundary while low-viscosity mantle material starts filling the gap. Figure 7 demonstrates in a different way the large effects of boundary conditions, open versus closed, which cannot be reduced using larger aspect ratio.
roughly 15 cm yr−1, whereas for the model with aspect ratio 6:1 it is around 5 cm yr−1. A similar reduction in flow speed characterizes the mantle flow. In all aspect-ratio cases the ini-tial driving slab buoyancy is the same. These flow speed re-ductions can be tied to the longer length of the lithosphere plates in the 6:1 models causing a longer sublithospheric fric-tional shear zone where a significant part of the mechanical energy of the system is dissipated.
For models with open boundaries, we can, in an approx-imate way, compensate for the reduced (increased) effect of viscous dissipation in the 3:1 (6:1) models by a scaling rela-tion applied to the velocity field and which accounts for the effect of additional viscous dissipation in an extended com-putational domain. To determine this velocity scaling, we in-vestigated aspect ratios of 3:1, 4:1, 5:1 and 6:1, where an aspect ratio of 6:1 would correspond to the ocean halfwidth of 3000 km of the subducting plate. The scaling procedure is explained in more details in Appendix A. The scaling proce-dure compensates the overall velocity field for the effect of bottom-side traction of that part of the plate located outside the model domain, which allows to account for bottom-side traction of the whole plate from the spreading ridge to the trench. In combination with intraplate stress imposed at the sidewalls, it facilitates modelling of a natural subduction pro-cess with correct plate length and ridge push within a smaller model domain.
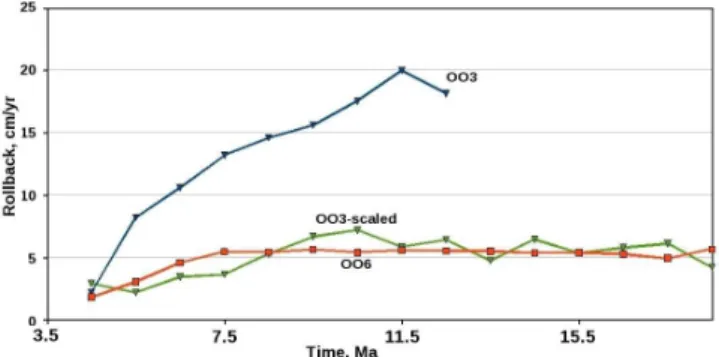
This scaling procedure has been applied during the compu-tation of the OO3 model to approximate flow speed results as observed for the 6:1 aspect ratio. Figure 8 shows scaled roll-back velocities of the OO3 model together with original (un-scaled) velocities for both the OO3 and OO6 models. These results illustrate the feasibility of approximate upscaling the numerical results for a larger domain. For the models with closed boundaries, we cannot apply velocity scaling due to lateral variations of the flow close to the side boundaries. For models with closed boundaries not only the velocity mag-nitude but also the flow pattern is changing with decreas-ing/increasing domain size. In this case comparison of the subduction dynamics in models with different aspect ratio is not meaningful.
3.5 Constraining the motion of the lithosphere plates
In the open boundary models OO3 and OO6, the motion of the subducting and overriding plate are entirely controlled by the buoyancy of the subducting slab. We invariably ob-serve (relatively fast) slab rollback in these models, whereas on Earth not all subduction zones show strong rollback and advancing trenches are also proposed (e.g. Funiciello et al., 2008; Schellart et al., 2008). OO3 and OO6 are in fact end-member models as on Earth the global coupling between plates may impose far-field control on the velocity of both overriding and subducting plate. We devised a number of ex-periments to investigate the combination of far-field control and local slab buoyancy on the evolution of subduction
us-Fig. 8.Evolution of the speed of rollback for two models: model OO3 with aspect ratio 3:1 (blue line), and model OO6 with aspect ratio 6:1 (red line) and scaled speed of rollback for the model OO3 with aspect ratio 3:1 (green line)
ing various boundary conditions in combination with open boundaries.
As a first open-boundary experiment, we impose far-field control by just fixing (F) the upper plate to the right bound-ary (model OOF3). We compare this to a model in which the left boundary is open while the right boundary is entirely closed (model OC3). The latter experiment is similar to that of Quinteros et al. (2010) who also use a single open verti-cal boundary in their numeriverti-cal modelling of free slab move-ment.
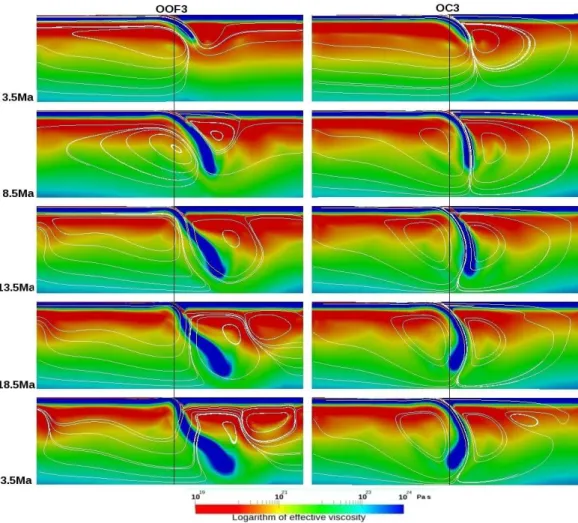
Results are presented in Fig. 9 showing snapshots of the effective viscosity field at 5 My intervals. The initial models at 3.5 My are similar apart from the fact that model OOF3 al-ready shows clear laminar flow field in the asthenosphere un-der the overriding plate as facilitated by the open boundaries. During the next 5 My the flow fields are of comparable mag-nitude and differ mostly in the flow near the tip of the slab. The average slab dip develops different between the models and particularly when the slab reaches the transition zone the evolution of these models starts to diverge. For model OOF3, active subduction continues and the slab penetrates deeper under the overriding plate, although with a decreasing speed and with overall shape deformation (along dip buckling) as a result of the interaction with increased viscosities at depth.
In the second model (OC3), the slab starts hanging in the transition zone after 8 My of evolution, the dip angle in-creases and the slab tends to overturn. The position of the trench does not change with time. The flow field pattern to the right of the slab is completely different from that of model OOF3 with an open right boundary, which allows flow to leave the domain. In the second model OC3, the closed right boundary creates a circulation beneath the upper plate, which in combination with increasing viscosity below 660 km depth results in slab bending and folding.
Fig. 9.Evolution of the subduction process for model OOF3 with open boundaries and fixed overriding plate (on the left) and model OC3 with closed right boundary (on the right). Arrows show the direction and magnitude of flow field.
applied this to the upper plate only. Some examples are pre-sented here demonstrating that open boundaries in combi-nation with intraplate stress constraints can lead to strongly reduced slab rollback, (temporary) stationary subduction, or even advancing trenches as compared to the end-member “free” in/outflow models OO3 or OO6.
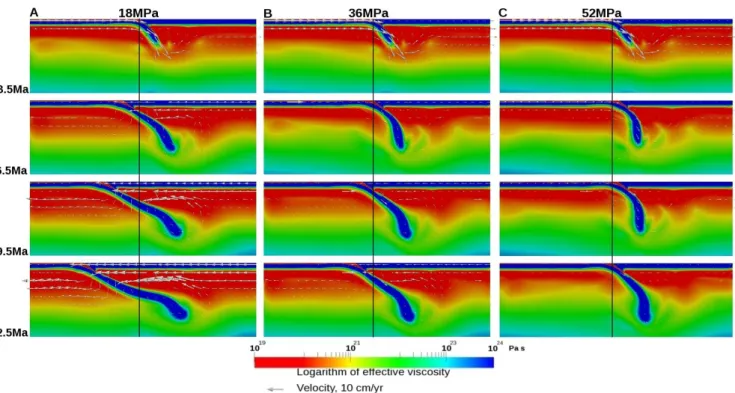
We varied the applied intraplate stress within reason-able limits for subduction zones (up to 52 MPa, Lithgow-Bertelloni and Guynn, 2004). The results of the subduction models with different intraplate stress values applied to the upper plate are presented in Fig. 10 where a pull is exerted of 18 MPa (10A), 36 MPa (10B), and 52 MPa (10C) on the upper plate. With increasing value of the intraplate stress we generally observe decreasing trench retreat. In more de-tail Fig. 10b shows an initial stage of stationary subduction, while Fig. 10c exhibits an initial phase of trench advance (to the right). These initial stages differ when as a result of a rela-tively short slab, the slab pull is still small and the pull on the upper plate is able to force stationary subduction or even slab advance. When the slab touches the 660-km boundary, there is a short episode of trench-stationary subduction, and after
a few My trench retreat develops in the model (Funiciello et al., 2003). These results demonstrate that open boundaries are not restrictive on modelling rollback, stationary subduc-tion or trench advance. In addisubduc-tion they again demonstrate the strong dependence of the evolution of trench motion and slab morphology on boundary conditions.
4 Discussion and conclusions
Fig. 10.The evolution of the models with open boundary conditions with different intraplate stress values on the overriding plate:(A)model with intraplate stress 18 MPa;(B)model with intraplate stress 36 MPa;(C)model with intraplate stress 52 MPa. Vertical black lines represent the initial trench position.
thick, 1019Pas) allowed for modelling continuous subduc-tion without prescribing a particularly subducsubduc-tion channel geometry. We observed that changing the aspect ratio for models with open boundaries did not change the general flow patterns and subduction evolution, except for a general drop in flow speed amplitude for which we derived an approxi-mate scaling procedure based on energy dissipation.
The modelling results obtained with the usual free-slip condition (no horizontal flow) at the sidewalls are in strong contrast with the results obtained for open boundaries. We observed in all experiments a strongly deviating subduction evolution due to the unavoidable influence of return flows in-duced by the free-slip boundaries and an order of magnitude difference in flow-dependent effective viscosity. If the litho-sphere plates are allowed to move away from the boundary, which we implemented to relax the free-slip condition on the motion of the plates, upward return flows at either boundary have an important adverse effect on subduction evolution, by forcing additional convergence, and model evolution in gen-eral. These effects could not be sufficiently reduced by taking a larger 6:1 aspect ratio (simulating the half-size of modern oceans), whereas for open boundaries it was found that the flow pattern and subduction evolution was basically indepen-dent of the aspect ratio. Also for closed sidewalls a general drop in flow speed was observed for larger aspect ratio mod-els. However, the free- slip boundaries prevented application of a useful scaling procedure.
While the width of the model domain was varied we kept the depth of the model constant. In our rollback models, the slab is draping on the 660-boundary as a result of in-creasing viscosity in combination with a decrease in nega-tive buoyancy resulting from the 660 km phase transition. In this model scenario, the effect of the bottom boundary will not be very strong. For the investigation of slab behaviour in the lower mantle a model with much larger depth is re-quired. But, for such models we still expect that the open boundaries would allow using a smaller lateral extent of the domain (2000–3000 km) in comparison to free-slip models to reduce the effect of the sidewall boundary conditions.
Although our experiments are in 2-D, we do expect that using open boundaries in 3-D modelling of subduction evo-lution (e.g. Jadamec and Billen, 2010; Piromallo et al., 2006; van Hunen et al., 2011) may proof beneficial. In 3-D, flow patterns have larger degrees of freedom as toroidal flow can be excited, e.g. around slab edges, and perhaps remote free-slip boundaries may suffice, but as no material is allowed to leave or enter the model unfavourable effects of free-slip sidewalls cannot be excluded.
Fig. A1.Energy dissipation for the model with open boundaries and aspect ratio 3:1 at time = 3.5 My.
on the plates at the sidewalls, to simulate the far-field con-trol of global plate tectonics. As also noted by Capitanio et al. (2010), and van Dinther et al. (2010), the tectonic style of subduction can be strongly controlled by far-field effects on both upper and lower plate. We notice a strong interac-tion between boundary condiinterac-tions, internal flow field, and the viscosity field when using non-linear strain-rate depen-dent rheology. For closed boundaries this feeds back into an effective viscosity of one order of magnitude larger in the as-thenosphere, as compared to the asthenosphere viscosity in open-boundary models.
Open boundary flow, if any, is restricted to be perpendic-ular to the sidewall. This condition, as any type of boundary condition, poses constraints on the internal flow. But the ad-vantage we experience from using open boundaries is that we can deal with lateral in- and outflow of the lithosphere in a more general way (in 2-D and current 3-D models), e.g. by prescribing intraplate stress, or even just by imposing kine-matic constraints on the side walls, while lateral flow below the lithosphere can fully develop, in the sense that it is not influenced by (possibly remote) impermeable vertical bound-aries.
Other advantages are the independence of the aspect ra-tio of the model domain, which allows for smaller models with increased resolution for modelling detail. An approxi-mate scaling procedure can be used to tune the overall flow speed amplitude to levels consistent with the mantle outside the model domain as far as buoyancy inside the model would drive motions outside the model.
Appendix A
Scaling of the velocity for models with contrasting aspect ratios
We have shown that for models with open boundaries, the convective flow pattern is unaffected by the aspect ratio of the domain. However, due to the fact that the amount of viscous dissipation in the model interior decreases with decreasing aspect ratio, we observe an increase in the magnitude of the flow velocity with decreasing aspect ratio of the model. We present an iterative method that allows us to scale the velocity
Fig. A2.Schematic representation of the subduction model. See text for the explanation.
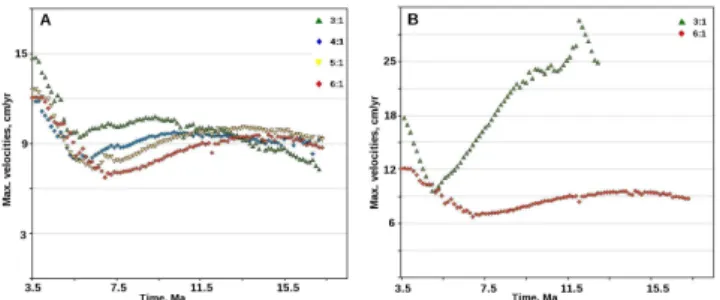
Fig. A3. (A)Maximum velocities for model with aspect ratio 6:1, and scaled maximum velocities for models with 3:1, 4:1 and 5:1 as-pect ratios.(B)Comparison of maximum velocities for two models without applying the velocity scaling procedure.
of the small aspect ratio domain such that it is in agreement with larger aspect ratio models.
Figure A1 shows a snapshot of the dissipated power distri-bution:
8=1
2ǫ˙ijτij (A1)
where, ǫ˙ij=∂iuj+∂jui and τij=ηǫ˙ij. This figure
illus-trates that the dissipative power is concentrated within the slab and its surrounding in the central region of the domain. Other areas of significant dissipative power are located in the asthenosphere directly below the lithospheric plates towards the left and right hand boundary of the domain. The astheno-spheric contribution to the dissipative power scales with the width of the domain.
Based on this configuration of the dissipative power, we have applied an approximate scheme to scale the velocity for the effect of power dissipated in a virtual lateral extension of the domain, schematically illustrated in Fig. A2.
This way a uniform velocity scale factor is determined it-eratively in the following steps:
1. Compute the volume integrated dissipative power for the interior domain labelled model 1 in Fig. A2,
Pinj = Z
Vin
8(j )dV , (A2)
2. Estimate the corresponding power, dissipated in the vir-tual extensions of the model, the regions labeled 1 and 2 in Fig. A2,
Pout(j )= Z
Vout
8(j )dV (A3)
This is done by uniform lateral extrapolation of the dis-sipation function profiles at the left and right hand side boundaries of the interior domain.
3. A velocity scaling factor is defined as
fj=
(Pout(j )+Pin(j ))
Pin(1) (A4)
4. Apply the scaling factor to the velocity field,
U(j+1)=fjU(j ). (A5)
This procedure is repeated until convergence|fj+1−fj |≤
10−6, which is typically obtained within a few iterations. De-spite of the fact that the values for the dissipation in the ex-ternal regions represent less than 15–20 % of the total dissi-pation in the model, this iterative procedure leads to a sig-nificant reduction in the velocity field magnitude, due to the non-linear rheology.
The above-mentioned procedure was tested on several models with different aspect ratios. The results of the veloc-ity scaling for these models are shown in Fig. A3.
The results of the velocity scaling for these models are shown in Fig. A3a where maximum velocity values in the domain for the model with aspect ratio 6 and scaled mod-els with smaller aspect ratios are presented. The maximum velocities are typically observed in the asthenosphere be-low the overriding plate. The maximum evolution time is 18 My since, for the model with the smallest aspect ratio, the trench has reached the left boundary at this stage. The time-averaged difference in maximum velocities is∼6 % for the 4:1 and 5:1 model and 14 % for 3:1. The maximum differ-ence in velocity magnitude is, 20 % for the 5:1 model 30 % for the 4:1 model and 45 % for the 3:1 model. Without veloc-ity scaling the difference in maximum velocities between 3:1 and 6:1 aspect ratio models after 12 My of evolution reaches approximately 70 % and increases over time as illustrated in Fig. A3b.
Acknowledgements. We thank T. Gerya and M. I. Billen for their thoughtful comments and suggestions which helped us to improve our paper. This study is a contribution to the ESF EUROCORES project TOPO-EUROPE, particularly component TOPO-4D, of which our project is funded by NWO (Netherlands Organisation for Scientific Research) through grant 855.01.141. This work also contributes to ISES (the Netherlands Research Center for Integrated Solid Earth Science) who provided the computational resources.
Special Issue: “Subduction zones”
Edited by: S. Buiter, F. Funiciello, and J. van Hunen
References
Babeyko, A. Y. and Sobolev, S. V.: High-resolution numerical mod-elling of stress distribution in visco-elasto-plastic subducting slabs, Lithos, 103, 205–216, 2008.
Baes, M., Govers, R., and Wortel, R.: Subduction initiation along the inherited weakness zone at the edge of a slab: Insights from numerical models, Geophys. J. Int., 184, 991–1008.
Behounkova, M. and Cizkova, H.: Long-wavelength character of subducted slabs in the lower mantle, Earth Planet. Sci. Lett., 275, 43–53, 2010.
Billen, M. I. and Gurnis, M.: Comparison of dynamic flow models for the Central Aleutian and Tonga-Kermadec subduction zones, Geochem. Geophys., 4, 17 pp., doi:10.1029/2001GC0002952003, 2003.
Billen, M. I.: Slab dynamics in the transition zone. Physics of the Earth and planetary interiors, 25, 297–356, 2010.
Burgmann, R. and Dresen, G.: Rheology of the lower crust and up-per mantle: evidence from rock mechanics, geodesy and field ob-servations, Annu. Rev. Earth Planet. Sci., 36, 531–536, 2008. Capitanio, F. A., Stegman, D. R., Moresi, L. N., and Sharples, W.:
Upper plate controls on deep subduction,trench migration and deformations at convergent margins, Tectonophys., 483, 80–92, 2010.
Cizkova, H., van den Berg, A. P., Spakman, W., and Matyska, C.: The viscosity of Earth’s lower mantle inferred from sinking speed of subducted lithosphere, Phys. Earth Planet. Int., 200– 201, 56–62, 2012.
Cizkova, H., van Hunen, J., and van den Berg, A. P.: Stress distri-bution within subducting slabs and their deformation in the tran-sition zone, Phys. Earth Planet. Int., 161, 202–214, 2007. Cristensen, U. R. and Yuen, D. A.: Layered convection indiced by
phase transition, J. Geophys. Res., 99, 10291–10300, 1985. Duretz, T., Gerya, T. V., and May, D. A: Numerical modelling of
spontaneous slab breakoff and subsequent topographic response, Tectonophysics, 502, 244–256, 2011.
Duretz, T., Gerya, T. V., Kaus, B. J. P., and Andersen, T. B.: Ther-momechanical modeling of slab eduction, J. Geophys. Res., 117, doi:10.1029/2012JB009137, 2012.
Enns, A., Becker, T. W., and Schmeling, H.: The dynamics of sub-duction and trench migration for viscosity stratification, Geo-phys. J. Int., 160, 761–775, 2005.
Funiciello, F., Faccenna, C., Heuret, A., Lallemand, S., Giuseppe, E. Di., and Becker, T. W.: Trench migration, net rotation and slab-mantle coupling, Earth Planet. Sci. Lett., 271, 233–240, 2008. Gerya, T.: Future directions in subduction modelling, J. Geodynam.,
52, 344378, 2011.
Han, L. and Gurnis, M.: How valid are dynamic models of sub-duction and convection when plate motion are prescribed? Phys. Earth Planet. Int., 110, 235–246, 1999.
Jadamec, M. A. and Billen, M. I.: Reconciling surface plate motions with rapid three-dimensional mantle flow around a slab edge, Nat. Lett., 465, 338–342, 2010.
Jadamec, M. A. and Billen, M. I.: The role of rheology and slab shape on rapid mantle flow: Three-dimensional numerical mod-els of the Alaska slab edge, J. Geophys. Res., 117, 20 pp., doi:10.1029/2011JB008563, 2012.
Karato, S., Rubie, D., Hong Yan, S.: Dislocation recovery in olivine under deep upper mantle conditions: implication for creep and diffusion, J. Geophy. Res., 98, 9761–9768, 1993.
Karato, S., Riedel, M., Yuen, D. A.: Rheological structure and de-formation of subducted slabs in mantle transition zone: implica-tions for mantle circulation and deep earthquakes, Phys. Earth Planet. Int., 127, 83–108, 2001.
Kaufmann, G. and Lambek, K.: Mantle dynamics, postglacial re-bound and the radial viscosity profile, Phys. Earth Planet. Int., 121, 301–324, 2000.
Lithgow-Bertelloni, C. and Guynn, J. H.: Origin of the lithospheric stress field, J. Geophys. Res., 109, 32 pp., doi:10.1029/2003JB002467, 2004.
Manea, V. and Gurnis, M.: Subduction zone evolution and low-viscosity wedges and channels. Earth Planet. Sci. Lett., 264, 22– 45, 2007.
Ozbench, M., Regenauer-Lieb, K., Stegman, D., Morra, G., Far-rington, R., Hale, A., May, D. A., Freeman, J., Bourgouin, L., Muhlhaus, H., and Moresi, L.: A model comparison study of large-scale mantle-lithosphere dynamics driven by subduction, Phys. Earth Planet. Int., 171, 224–234, 2008.
Piromallo, C., Becker, T. W., Funiciello, F., and Faccenna, C.: Three-dimensional instantaneous mantle flow in-duced by subduction, Geophys. Res. Lett., 33, 4 pp., doi:10.1029/2005GL025390, 2006.
Quinquis, M., Buiter, S., and Ellis, S.: The role of boundary conditions in numerical models of subduction zone dynamics, Tectonophys., 497, 57–70, 2011.
Quinteros, J., Sobolev, S. V., and Popov, A. A.: Viscosity in tran-sition zone and lower mantle: Implication for slab penetration, Geophys. Res. Lett., 37, 5 pp., doi:10.1029/2010GL043140, 2010.
Schellart, W. P., Freeman, J., Stegman, D. R., Moresi, L., and May, D.: Evolution and diversity of subduction zones controlled by slab width, Nature, 446, 308–311, 2007.
Schellart, W. P., Stegman, D. R., and Freeman, J.: Global trench mi-gration velocities and slab mimi-gration induced upper mantle vol-ume fluxes: Constraints to find an Earth reference frame based on minimizing viscous dissipation, Earth Sci. Rev., 88, 118–144, 2008.
Schmeling, H., Babeyko, A., Enns, A., Faccena, C., Funiciello, F., Gerya, T., Golabek, G., Grigull, S., Kaus, B., Morra, G., Schmal-holz, S. M., and van Hunen, J.: A benchmark omparison of spon-taneous subduction models-towards a free surface, Phys. Earth Planet. Int., 171, 198–223, 2008.
Simmons, N. A., Forte, A. M., and Grand, S. P.: Constraining man-tle flow with seismic and geodynamic data: a joint approach, Earth Planet. Sci. Lett., 246, 109–124, 2006.
Stegman, D. R., Schellart, W. P., and Freeman, J.: Competing influ-ence of plate width and far-field boundary conditions on trench migration and morphology of subducted slabs in the upper man-tle, Tectonophys., 483, 46–57, 2010.
Turcotte, D. L. and Schubert, G.: Geodynamics, Cambridge Univer-sity Press, 2002.
Ueda, K., Gerya, T. V., and Burg, J.-P. C.: Delamination in colli-sional orogens: thermo-mechanical modeling, J. Geophys. Res., 117, 25 pp., B08411, doi:10.1029/2012JB009144, 2012. van den Berg, A. P., Yuen, D., and van Keken, P. E.: Efect of depth
variations in creep laws on the formation of plates in mantle dy-namics, Geophys. Res. Lett., 18, 2197–2200, 1991.
van Dinther, Y., Morra, G., Funiciello, F., and Faccena, C.: Role of the overriding plate in the subduction process: insights from numerocal models, Tetonophys., 484, 74–86, 2010.
van Hunen, J.: Shallow and buoyant lithospheric subduction: causes and impliations from thermo-chemical numerical modelling, PhD thesis, Utrecht University, Utrecht, 2001.
van Hunen, J., van den Berg, A. P., and Vlaar, N. J.: A thermo-mechanical model of horizontal subduction below an overriding plate, Earth Planet. Sci. Lett., 182, 157–169, 2000.