Journal of Computer Science 4 (3): 186-191, 2008 ISSN 1549-3636
© 2008 Science Publications
Corresponding Author: Baljit Singh, Department of Computer Science and Engineering, BBSB Engineering College, Fatehgarh Sahib-140407, Punjab, India Tel: +919463446505
Edge Detection in Gray Level Images based on the Shannon Entropy
1
Baljit Singh and
2Amar Partap Singh
1
Department of Computer Science and Engineering, BBSB Engineering College,
Fatehgarh Sahib-140407, Punjab, India
2
Department of Electronics and Communications Engineering, SLIET, Longowal-148106
(District: Sangrur) Punjab, India
Abstract: Most of the classical mathematical methods for edge detection based on the derivative of the pixels of the original image are Gradient operators, Laplacian and Laplacian of Gaussian operators. Gradient based edge detection methods, such as Roberts, Sobel and Prewitts, have used two 2-D linear filters to process vertical edges and horizontal edges separately to approximate first-order derivative of pixel values of the image. The Laplacian edge detection method has used a 2-D linear filter to approximate second-order derivative of pixel values of the image. Major drawback of second-order derivative approach is that the response at and around the isolated pixel is much stronger. In this research study, a novel approach utilizing Shannon entropy other than the evaluation of derivates of the image in detecting edges in gray level images has been proposed. The proposed approach solves this problem at some extent. In the proposed method, we have used a suitable threshold value to segment the image and achieve the binary image. After this the proposed edge detector is introduced to detect and locate the edges in the image. A standard test image is used to compare the results of the proposed edge detector with the Laplacian of Gaussian edge detector operator. In order to validate the results, seven different kinds of test images are considered to examine the versatility of the proposed edge detector. It has been observed that the proposed edge detector works effectively for different gray scale digital images. The results of this study were quite promising.
Key words: Edge detection, shannon entropy, gradient, laplacian, threshold value
INTRODUCTION
Edge detection has received much attention during the past two decade because of its significant importance in many research areas[1]. Since, the edge is a prominent feature of an image; it is the front-end processing stage in object recognition and image understanding system. The accuracy with which this task can be performed is a crucial factor in determining overall system performance[2]. The detection results benefit applications such as image enhancement, recognition, morphing, compression, retrieval, watermarking, hiding, restorationand registration etc[3]. Edge detection concerns localization of abrupt changes in the gray level of an image[4]. Edge detection can be defined as the boundary between two regions separated by two relatively distinct gray level properties[5]. The causes of the region dissimilarity may be due to some factors such as the geometry of the scene, the radio metric characteristics of the surface, the illumination and so on[6].
finding edges via zero-crossings. Marr and Hildreth achieved this by using the Laplacian of a Gaussian (LOG) function as a filter[10]. LOG filtered images also suffer from the problem of missing edges-edges in the original image may not have corresponding edges in a filtered image. In addition, it turns out to be very difficult to combine LOG zero-crossings from different scales, primarily because of the following[11]:
• A physically significant edge does not match a
zero-crossing for more than a few and very limited number of scales
• Zero-crossings in larger scales move very far away from the true edge position due to poor localization of the LOG operator
• There are too many zero-crossings in the small scales of a LOG filtered image, most of which is due to noise
To solve these problems, the study proposed a novel approach based on information theory. Shannon entropy is the most important among several measures of information. Edges can be extracted by the detection of all pixels on the borders between different homogenous areas. Entropy measures the randomness of intensity distribution[12]. According to this property of entropy, the value of entropy is low for homogenous areas and is high where the diversity of gray level of pixels is large[13].
Concept of entropy: Entropy is a concept in
information theory. Entropy is used to measure the amount of information[14]. Entropy is defined in terms of the probabilistic behavior of a source of information. In accordance with this definition, a random event A that occurs with probability P(A) is said to contain
)] A ( P log[ )] A ( P / 1 log[ ) A (
I = =−
Units of information. The amount I(A) is called the information of event A. The amount of self-information of the event is inversely related to its probability. If P(A) = 1, then I(A) = 0 and no information is attributed to it. In this case, uncertainty associated with the event is zero. Thus, if the event always occurs, then no information would be transferred by communicating that the event has occurred. If P(A) = 0.8, then some information would be transferred by communicating that the event has occurred.
The base of the logarithm determines the unit which is used to measure the information. If the base of
the logarithm is 2, then unit of information is bit. If P(A) = ½, then I(A) = -log2(½) = 1 bit. That is, 1 bit is
the amount of information conveyed when one of two possible equally likely events occurs. A simple example of such a situation is flipping a coin and communicating the result (Head or Tail).
The basic concept of entropy in information theory has to do with how much randomness is in a signal or in a random event. An alternative way to look at this is to talk about how much information is carried by the signal. Entropy is a measure of randomness.
Consider a probabilistic experiment in which the output of a discrete source is observed during every unit of time (signaling interval). The source output is modeled as a discrete random variable S. S is referred as a set of source symbols[15].
1 2 3 j K
Z={s ,s ,s ,...,s ,...s }
The above set of source symbols is referred to as the source alphabet.
The set of all source symbol probabilities is denoted by P
1 2 3 j K
P={p , p , p ,..., p ,..., p }
This set of probabilities must satisfy the condition
1 p
K
1 j
j=
=
The symbols generated by the source during successive signaling intervals are statistically independent. A source that satisfies such property is called a discrete memory-less source; memory-less source is that in which the symbol emitted at any time is independent of previous choices.
The amount of self-information of the event S=sj
which occurs with probability pj is:
j j
I(s )=log(1/ p )
j
log(p ), j 1, 2,3,..., K
= − =
) s (
I j Is a discrete random variable that takes on the
values I(s1), I(s2),...,I(sk) with probabilities p1, p2,...,pk
respectively[16]. The self-information generated by the production of a single source symbol is I(sj) = -log (pj).
the average self –information obtained from n outputs is given by
1 1 2 2 K K
np I(s )+np I(s )+...+np I(s )
) s ( I p
n j j
K
1 j= =
) p / 1 log( p
n j j
K
1 j=
=
) p log( p
n j j
K
1 j= −
=
The average information per source output, denoted H (Z)[17], is:
) p log( p ) Z (
H j j
K
1 j= −
=
The important quantity H(Z) is called the entropy of a discrete memory less source with source alphabet Z . It is a measure of the average information content per source symbol. The entropy H(Z) depends only on the probabilities of the symbols in the alphabet Z in H(Z) is not an argument of a function but rather a label for a source.
Selection of threshold value: Threshold value is used to transform a dataset containing values that vary over some range into a new dataset containing just two values. When a threshold value is applied on to the input data, then input values that fall below the threshold are replaced by one of the output values and input values that at or above the threshold are replaced by the other output value. Image thresholding[18] is a segmentation technique because it classifies pixels into two categories. Category1: Pixels whose gray level values fall below the threshold and category2: Pixels whose gray level values are equal or exceed the threshold. In gray level image, range of input dataset is [0,255]. After thresholding, output dataset contains only two values 0 and 255. Thus, thresholding creates a binary image. If T is a threshold value, then any pixel (x, y) for which f(x, y)>T is called an object point; otherwise the pixel is called a background pixel. In general, the threshold can be chosen as the relation, T=T[x, y, p(x, y), f(x, y)] where f(x, y) is the gray level of the pixel(x, y) and p(x, y) denotes some local property of this pixel, for example, the average gray level of a neighborhood centered on (x, y). A threshold
image h(x, y) is defined as h(x, y)=1 if f(x, y)>T; otherwise h(x, y)=0. Thus, pixels labeled 1 correspond to objects, whereas pixels labeled 0 correspond to the background. When T depends only on f(x, y) (only on gray level values), the threshold is called global. If T depends on f(x, y) and p(x, y), the threshold is called local. If T depends on the pixel position (x, y) as well as f(x, y) at that pixel position, then it is called dynamic or adaptive threshold. In proposed scheme to detect edges, global threshold value is used.
Procedure to select suitable threshold value
Step 1: Select an initial estimate for T.
Step 2: Segment the image using T. This will produce two groups of pixels:
R1 consisting of all pixels with gray level
values >Tand
R2 consisting of pixels with gray level values
T.
Step 3: Compute the average gray level values µ1 and
µ2 for the pixels in region
R1 and R2.
Step 4: Compute a new threshold value Set TNew = (µ1 + µ2)/2 and
Set TOld=0
Step 5: While (TNew TOld ) do
µ1 =Mean gray level of pixels for which f(x,
y)>TNew
µ2 =Mean gray level of pixels for which f(x,
y) TNew
Set TOld =TNew
Set TNew = (µ1 +µ2)/2
End while
Step 6: Suitable threshold value Set T=TNew
Step 7: Stop
Proposed scheme for edge detection: In digital image processing, an image defined in the real world is considered to be a function of two real variables, for example, f(x, y) with f as the amplitude (brightness) of the image at the real coordinate position (x, y). A spatial filter mask may be defined as a (template) matrix w of size m × n. Assume that m = 2a+1 and n = 2b+1, where a, b are nonzero positive integers. Smallest meaningful size of the mask is 3×3. Such mask coefficients, showing coordinate arrangement as:
w(-1,1) w(-1,0) w(-1,1)
w(0,1) w(0,0) w(0,1)
w(1,1) w(1,0) w(1,1)
f(x-1,y-1) f(x-1,y) f(x-1,y+1)
f(x,y-1) f(x, y) f(x,y+1)
f(x+1,y-1) f(x+1,y) f(x+1,y+1)
Basic idea behind edge detection is:
1 1 1
1 × 1
1 1 1
• Classification of all pixels that satisfy the criterion
of homogeneousness
• Detection of all pixels on the borders between different homogeneous areas
In the proposed scheme, first create a binary image by choosing a suitable threshold value. Window is applied on the binary image. Set all window coefficients equal to 1 except centre, centre equal to × as shown below:
Move the window on the whole binary image and find the probability of each central pixel of image under the window. Then, the entropy of each central pixel of image under the window is calculated as
) p log( p ) el centralPix (
H =−
Where, p is the probability of central pixel of binary image under the window. For example, at any instance the image under the window is:
Now, the probability of central pixel, p = 4/9 and the entropy of central pixel,
3604 . 0 ) 9 / 4 log( ) 9 / 4 ( ) p log( p ) el centralPix (
H =− =− =
If, for any other instance, the image under the window is:
In this case, the probability of central pixel, p = 2/9 and the entropy of central pixel,
3342 . 0 ) 9 / 2 log( ) 9 / 2 ( ) p log( p ) el centralPix (
H =− =− =
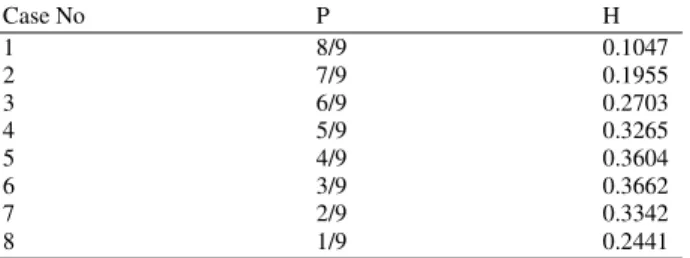
When the probability of central pixel, p=1, then the entropy of this pixel is zero. Thus, if the gray level of all pixels under the window homogeneous, p=1and H=0.In this case, the central pixel is not an edge pixel. Other possibilities of entropy of central pixel under window are shown in Table1.
In case no.1, 2, the diversity for gray level of pixels under the window is low. So, in these cases, central pixel is not an edge pixel. In remaining cases, the diversity for gray level of pixels under the window is high. So, for these cases, central pixel is an edge pixel.
Table 1: p and H of central under window
Case No P H
1 8/9 0.1047
2 7/9 0.1955
3 6/9 0.2703
4 5/9 0.3265
5 4/9 0.3604
6 3/9 0.3662
7 2/9 0.3342
8 1/9 0.2441
Thus, the central pixel with entropy greater than and equal to 0.2441 is an edge pixel, otherwise not.
Proposed Algorithm:
Step 1: Create a binary image by choosing a suitable threshold value.
If (f(x, y) > threshold value), then Set f(x, y) = 1
Else
Set f(x, y) = 0 End if
Step 2: Find edge pixels in binary image: Create a mask, w, with dimensions m×n Normally, m = 3 and n = 3
Calculate a = (m-1)/2 and b = (n-1)/2
Create an M×N output image, g: For all pixel coordinates, x and y, do Set g(x, y) = f(x, y)
End for
Checking for edge pixels: For y = b+1 to N-b, do For x = a+1 to M-a, do Set Sum = 0 For k = -b to b For j = -a to a
If (f(x, y) = = f (x + j, y + k)), then Set Sum=Sum+1
End if End for End for p=sum/9 H = -plog(p)
If (H<(-(1/9)log(1/9))), Then Set g(x,y)=0
Else
Set g(x,y)=1 End if End for End for
RESULTS AND DISCUSSION
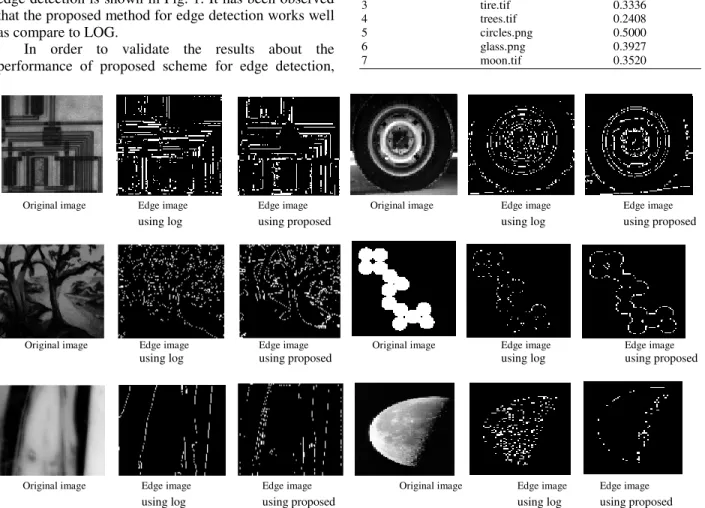
The performance of the proposed scheme is evaluated through the simulation results using MATLAB 7 for a set of eight test images and the results of the proposed scheme are compared with the results of well-established edge detection operator on the same set of test images. Such edge detection operator is Laplacian of Gaussian (LOG).LOG is chosen for comparison because both approaches are rotation invariant. For this purpose, first, a standard test image eight.tif was taken from MATLAB 7 environment. Its edge was detected using LOG edge detector whose function was inbuilt in MATLAB 7. After this, the performance of proposed approach for edge detection on the same image was checked. In the proposed scheme, a suitable threshold value was calculated using the threshold evaluation procedure given in the research. Such threshold value for the test image is 0.3472 when image in normalized form (all gray level values lie between 0 and 1). The result of edge detection is shown in Fig. 1. It has been observed that the proposed method for edge detection works well as compare to LOG.
In order to validate the results about the performance of proposed scheme for edge detection,
seven different test images are considered which are present in MATLAB 7 environment. Suitable threshold values calculated by the threshold evaluation procedure for different test images are given in Table 2.The results of edge detections for these test images using LOG and proposed scheme are shown in Fig. 2. From the results;
Original image Edge image Edge image using log using proposed
Fig. 1: Performance of Proposed Edge Detector for
Table 2: Threshold values for different standard images
S. No. Image Threshold Value
1 coins.png 0.4943
2 circuit.tif 0.3350
3 tire.tif 0.3336
4 trees.tif 0.2408
5 circles.png 0.5000
6 glass.png 0.3927
7 moon.tif 0.3520
Original image Edge image Edge image Original image Edge image Edge image
using log using proposed using log using proposed
Original image Edge image Edge image Original image Edge image Edge image
using log using proposed using log using proposed
Original image Edge image Edge image Original image Edge image Edge image
using log using proposed using log using proposed
it has again been observed that the performance of the proposed edge detection scheme is found to be satisfactory for all the test images as compare to the performance of LOG.
CONCLUSION
In this study, an attempt is made to develop a new technique for edge detection. Experiment results have demonstrated that the proposed scheme for edge detection works satisfactorily for different gray level digital images. The theoretical principles and systematic development of the algorithm for the proposed versatile edge detector is described in detail. The technique has potential future in the field of digital image processing. The work is under further progress to examine the performance of the proposed edge detector for different gray level images affected with different kinds of noise.
ACKNOWLEDGEMENTS
Authors are greatly indebted to the Department of Electronics and Communications Engineering, SLIET, Longowal-148106 (District: Sangrur) Punjab for providing excellent lab facilities that make this work feasible.
REFERENCES
1. Yuan-Hui Yu and Chin-Chen Chang, 2006. A new edge detection approach based on Image Context Analysis. Int. J. Image Vision Comput, 24: 1090-1102.
2. Suchendra, M., B.Z. Yiqing and D.P. Walter, 1993. A Genetic Algorithm-based Edge Detection Technique. In: IEEE Proceedings of the IJCNN’93 Oct 25-29, 3: 2995-2999.
3. Ziou, D. and S. Tabbone, 1998. Edge detection techniques- an overview. Intl. J. Pattern Recognition and Image Analysis, 8: 537-559. 4. Kresic-Juric, S., D. Madej and S. Fadil, 2006.
Applications of Hidden Markov Models in Bar Code Decoding. Intl. J. Pattern Recognition letters, 27: 1665-1672.
5. Markus, G., Essam A. EI-Kwae and R.K. Mansur, 1998. Edge detection in medical images using a genetic algorithm. IEEE Trans. on Medical Imaging, 17: 469-474.
6. Laura, C., A. Nicola and C. Gerardo, 1994. A Genetic Approach to Edge Detection. In: IEEE Proceedings of the ICIP’94 Nov 13-16, 1: 318-322. 7. Wang M. and Y. Shuyuan, 2005. A Hybrid Genetic Algorithm based Edge Detection Method for SAR Image. In: IEEE Proceedings of the Radar Conference’05 May 9-12, 1:503-506.
8. Renyan Zhang, Guoliang Zhao and Li Su, 2005. A New Edge Detection Method in Image Processing. In: IEEE Proceedings of the ISCIT’05 Oct 12-14, 1: 445-448.
9. Rafael, C.G. and E.W. Richard, 2004. Digital Image Processing. Pearson Education India Publishers, pp: 572-585.
10. Mitra, B., 2002. Gaussian based edge detection methods- a survey. IEEE Trans. on Systems, Manand Cybernetics, 32:252-260.
11. Qian, R.J. and T.S. Huag, 1996. Optimal Edge Detection in two-dimensional Images. IEEE Trans. Image Proc., 5: 1215-1220.
12. AboulElla Hassanien, 2007. Fuzzy Rough Sets Hybrid Scheme for Breast Cancer Detection. Intl. J. Image Vision Comput., 25: 172-183.
13. Yasuhiro Tsujimura and Mitsuo GEN, 1998. Entropy-based Genetic Algorithm for Solving TSP. In: IEEE Proceedings of the KES’98 April 21-23,2: 285-290.
14. Shannon, C.E., 1948. A mathematical theory of communication. Int. J. Bell. Syst. Technical, 27: 379-423.
15. Simor Haykin, 1995. Communication System. John Wiley and Sons New York Publishers, pp. 614-621.
16. Kapur, J.N., 1994. Measures of Information and their Applications. John Wiley and Sons New Delhi Publishers, pp: 1-20.
17. Franck Luthon, Marc Lievin and Francis Faux, 2004. On the use of entropy power for threshold selection. Int. J. Signal Proc., 84: 1789-1804. 18. Chanda, B. and D. Dutta Majumder, 2004. Digital