Interactive Change Detection Using High Resolution Remote Sensing Images
Based on Active Learning with Gaussian Processes
Hui Ru a, Huai Yu a,*, Pingping Huang b, Wen Yang a
a School of Electronic Information, Wuhan University, 430072 Wuhan, China - (ruhui, yuhuai, yangwen)@whu.edu.cn b College of Information Engineer, Inner Mongolia University of Technology, 101051 Hohhot, China - [email protected]
Commission VII, WG VII/5
KEY WORDS: High Resolution Remote Sensing Images, Change Detection, Active Learning, Gaussian Processes
ABSTRACT:
Although there have been many studies for change detection, the effective and efficient use of high resolution remote sensing images is still a problem. Conventional supervised methods need lots of annotations to classify the land cover categories and detect their changes. Besides, the training set in supervised methods often has lots of redundant samples without any essential information. In this study, we present a method for interactive change detection using high resolution remote sensing images with active learning to overcome the shortages of existing remote sensing image change detection techniques. In our method, there is no annotation of actual land cover category at the beginning. First, we find a certain number of the most representative objects in unsupervised way. Then, we can detect the change areas from multi-temporal high resolution remote sensing images by active learning with Gaussian processes in an interactive way gradually until the detection results do not change notably. The artificial labelling can be reduced substantially, and a desirable detection result can be obtained in a few iterations. The experiments on Geo-Eye1 and WorldView2 remote sensing images demonstrate the effectiveness and efficiency of our proposed method.
* Corresponding author: E-mail: [email protected] 1. ITRODUCTION
The change detection technique for multi-temporal high resolution remote sensing images plays an important role in many applications, such as monitoring land cover transitions, nature disasters (e.g. earthquake, tsunami), land desertification and urbanization. There are many algorithms of change detection in literature which can be roughly divided into two categories: unsupervised and supervised. Among unsupervised methods, the land cover transitions are often detected from spectral reflectance properties of high resolution remote sensing images, and the difficulty lies in choosing an appropriate threshold. Among supervised methods, from the labelled training samples, we can use the classification results from different temporal remote sensing images to detect the land cover transitions. In general, unsupervised methods can provide binary maps which only present “change” or “no change” information. Supervised methods can provide the land cover transitions with knowing the land cover categories in each temporal additionally. The unsupervised techniques are usually affected by certain objective factors like the atmosphere conditions, sensor calibration, etc. On the other hand, the supervised techniques need lots of manual intervention and will increase the cumulative errors in the process of comparing classification results. From the previous experience, the user should choose an appropriate change detection algorithm for the specific requirement in practice.
Another difficulty for classification and change detection of remote sensing images is the acquisition of actual land cover category data since it is difficult and expensive. We need comprehensive surveys over the area of interest, and the labelling task must be performed by experts in related fields. In
literature, there have been some supervised methods with active learning to promote the efficiency of classification and change detection, because active learning is helpful to overcome the lack of labelled samples. Begüm et al proposed an active
learning technique developed in the framework of the Bayes’
rule for compound classification (Begüm D., 2012). It selected the unlabelled pixels that were classified with the maximum uncertainty which was assessed by joint entropy. This algorithm tried to use statistical methods to classify the land cover categories in remote sensing images under certain conditions. Furlani et al used the support vector data description to identify the most relevant training samples in classification, and selected unlabelled samples by adopting diversity criterion with the support vector data description classifier (Furlani M., 2012). However, the effectiveness of support vector data description highly depended on the quantity and quality labelled samples used to define the enclosing hypersphere. So diversity criterion were needed to select candidate training pixels. This kind of method was not adequate for large scale problems, since the computation complexity of support vector machine was very high. Jefersson et al proposed an interactive classification of remote sensing images considering multiscale segmentation (Jefersson, 2013). They used a boosting-based active learning strategy to select regions at the most appropriate scales of representation and found that the combination of scales produces better results than isolated scales in a relevance feedback process. Moumita et al presented a change detection technique (Moumita, 2014) using neural networks in active learning, and the network was iteratively trained with labelled patterns, using the query functions: uncertainty sampling and query-by-committee. However, the optimal parameters are hard to find but play important roles in neural network. Kiran et al
presented a cohesive algorithm for image classification and
change detection based on active learning which tackled the lack of actual land cover category data to detect deforestation (Kiran, 2014). They used Expectation Maximization algorithm as a pre-clustering, an active learning classification based on maximum likelihood estimation, and an automatic threshold of pair-wise PCA as post-classification comparison. Xiao et al
used the structural feature description combined with both local and global information and query expansion for object detection (Xiao B., 2014). They converted the detection task to a ranking query task by using a ranking support vector machine for the object detection in very high resolution remote sensing images. In literature, only few approaches for detecting land cover category transitions by supervised techniques with active learning have been presented. Active learning is a sample selection strategy which can be used in many kinds of classification algorithms. The difference between them is the classification algorithm, and what we need to do is designing an appropriate criterion for them respectively.
In this study, we presented an interactive change detection method for high resolution remote sensing images under the framework of Alexander’s method (Alexander F., 2012), which used active learning to overcome the shortages of existing remote sensing image change detection techniques. There is no need for any annotation of actual land cover category at the beginning in our method. First, we use unsupervised way to find a certain number of the most representative objects in the first iteration and label them with “change” or “no change” by user as the initial training set. Then, we can detect the change areas from multi-temporal high resolution remote sensing images by active learning with Gaussian processes in an interactive way gradually until the detection result doesn’t change notably. Specifically, select the most representative sample in each
iteration, label it with “change” and “no change”, add this labelled sample into training set, and delete it from the testing set. Repeat this process until the result meets the requirement. In our method, the manual annotation can be reduced substantially, and a desirable detection result can be obtained in a few iterations.
This paper is organized as follows. Section 2 presents the interactive change detection algorithm based on active learning in detail, and gives a specific interpretation for every step in the proposed method. Some representative experimental results are exhibited in section 3. Finally, Section 4 draws the conclusion of this work.
2. INTERACTIVE CHANGE DETECTION BASED ON ACTIVE LEARNING
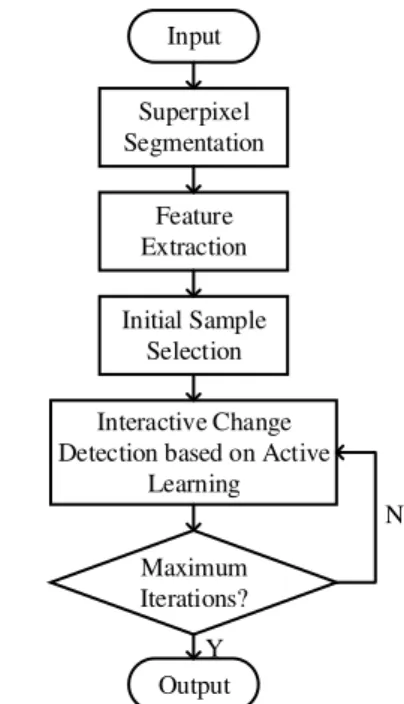
This work of interactive change detection use active learning to construct an efficient training set in order to make full use of various information in high resolution remote sensing images. We use the original images without any annotation to select the most representative samples, and obtain the results meeting the requirements gradually by adding those representative samples into training set after labelling them manually. Repeat this process until reach a satisfactory detection result. The whole framework flow chart is shown in Figure 1. And each step of this interactive change detection for high resolution remote sensing images based on active learning will be introduced in the following parts.
Input
Superpixel Segmentation
Feature Extraction
Initial Sample Selection
Interactive Change Detection based on Active
Learning
Maximum Iterations?
Output
N
Y
Figure 1. The flow chart of the whole interactive change detection system
2.1 Superpixel Segmentation
Superpixel segmentation algorithms can be roughly divided into two categories: algorithms based on graph theory and algorithms based on gradient descent. We choose Simple Linear Iteration Clustering (SLIC) segmentation algorithm (Achanta R., 2012) by comparing the segmentation speed and results of some segmentation algorithms. Furthermore, this method can produce consistent superpixels with similar size and shape, and it can keep image boundary at the same time.
In this step, the remote sensing image with complex boundaries is segmented into several superpixels, and then the superpixel segmentation boundary is applied to other temporal remote sensing images, so that the superpixels in different multi-temporal remote sensing images can stay the same with each other. The region size of superpixels can be set in experiments manually.
2.2 Feature Extraction
Represent all superpixels with their features. Specifically, take the external rectangular range of each superpixel in different temporal remote sensing images, calculate color and structure features of each rectangular region, concatenate various features of the same region as the descriptor of that superpixel, and all descriptors of the same temporal remote sensing image constitute the feature set of that temporal. We first calculate the discriminate color descriptor (Rahat K., 2013) and sift descriptor (Lazebnik S., 2006) to represent color and structure information for each superpixel, and then concatenate them to represent the superpixel after normalization.
Discriminate color descriptor represents color feature based on an information theoretic approach. Cluster color values together based on their discriminative power in a classification problem, so that each cluster has the explicit objective to minimize the decline of mutual information of the final representation. Besides, this kind of color description can automatically maintain photometric invariance to some extent. Thus, we use a
universal color representation, which is learned from other data sets, to describe our superpixels in multi-temporal high resolution remote sensing images. The specific theory and calculation process of discriminate color descriptor can be found in (Rahat K., 2013).
On the other hand, we use sift descriptor of each superpixel to represent its structure information. We extract a 32 dimension sift descriptor from each superpixel. The feature extraction program is proposed by (Lazebnik S., 2006).
Calculate color and structure descriptor at the center of each superpixel, and normalize all feature descriptors according to their categories. The last procedure is concatenating the normalized color and sift descriptors to constitute descriptor sets for all temporal remote sensing images.
2.3 Similarity Calculation
Calculate the histogram intersection kernel of feature descriptor for superpixel pairs at the same location in different temporal remote sensing images as the similarity metric. We use the histogram intersection kernel proposed in (Kristen G., 2005), the concrete definition is as formula (1).
, ' min
, '
HIK
d d
K x x x x (1)
where x, x’ = superpixels’ feature vectors of different temporal remote sensing images
xd, xd’= the d-th dimension of superpixels’ feature vectors for different temporal remote sensing images
KHIK = Histogram Intersection Kernel of feature
vectors extracted in superpixel pairs
Thus, the similarity metric for each pair of superpixels in different temporal remote sensing images has the same dimension with descriptors for the original superpixels.
2.4 Initial Sample Selection
Choose initial sample from all superpixel pairs without any annotation, which means selecting the most representative samples from the original remote sensing image superpixel pairs using certain selection strategy. Thus, we propose three selection strategies to find the target pairs in this part.
2.4.1 Random Selection: For there is no prior knowledge of the actual land cover change, we can select certain samples from the original data set randomly as the initial samples.
2.4.2 EM Algorithm: As far as we know, any signals affected by additive noises can be fitted by Gaussian Mixture Distribution model. Thus, we use Expectation Maximum algorithm fitting all similarity vectors with Gaussian mixture distribution and choose the most marginal ones as the initial samples.
2.4.3 K-means Clustering: There are two categories:
“change” and “no change” in the task of change detection for high resolution remote sensing images. Thus, we choose certain superpixel pairs that are nearest to the clustering centers found by k-means cluster algorithm as the initial samples.
All selected initial samples will be annotated by technician with expert knowledge, which is simulated by actual change type in
the following experiments. In each experiment, we can only choose one initial selection strategy and set the amount of initial samples manually in all above three selection strategies. Although there are several choices, we decided to choose the K-means cluster algorithm as the initial sample selection method in our experiments.
2.5 Interactive Change Detection based on Active Learning
In this interactive change detection framework, we believe that supervised classification based on active learning can accomplish the task of detecting changes in high resolution remote sensing images. Since high resolution remote sensing images with high dimension are huge, and the process of them is very complex, so we use the rapid uncertainty computation with Gaussian processes (Alexander F., 2012) to implement the interactive change detection. The specific components of active learning with Gaussian process is shown in Figure 2.Using Gaussian processes has a prominent advantage, which means we can directly estimate classification uncertainties in a Bayesian manner.
Gaussian Processes
Maximum Iterations?
END
Sample Selected by Query Strategy Labelled by
User Initial
Sample
N
Add to Training Set
Y
Figure. 2 Active Learning with Gaussian Process
The result for the classification problem of two categories in Gaussian process is obvious, because the symbol of predictive mean directly reflects the classified category. However, the computation complexity of Gaussian process is O(n), which means it is not suitable for large scale classification problems. Until Alexander F. et al proposed a series of optimization, the computation complexity of Gaussian process was significantly reduced, which made it possible to use Gaussian process in large scale classification tasks. The specific optimization for rapid computation of Gaussian processes has been presented in (Erik R., 2012), and the sample selection strategies based on rapid uncertainty computation with Gaussian processes is specified in the following part (Alexander F., 2012).
We use the Gaussian process model to simulate the fundamental classification framework. Given training data {xi, yi}, we would like to estimate the underlying latent function f, which maps inputs x to outputs y. We assume that outputs y are disturbed by Gaussian noise ~ (0, 2)
n N
,
n
is the standard deviation of white noise, i.e.
( )ii
y f x , yi is the predictive value for testing sample and the symbol of
i
y reflects the category of that
sample, ( )i
x is the descriptor vector for that sample. Assume that
f is sampled from a Gaussian process with zero mean and covariance (kernel) function K. Thus, the predictive distribution of the output y* for a new test input x* is shown as follows:
*
2
1* *
T n
x k y
K
I (2)
12 * 2 2
* ** * *
T
n n
x k k k
K I
(3)
where x* = descriptor vector for new test input y = vector containing the output values of the training set
*
k
,k
**, K = the kernel values of the test input, between training set and test input, and of the training set itself, respectivelyI = unit matrix
*
= predictive mean2 *
= predictive variance
In this task of change detection, we have discrete outputs (labels) {1, 1}
y for “change” and “no change”. And the symbol of predicted mean
*
is the label of testing inputs.
We will mainly specify the active learning with Gaussian process. In our interactive change detection, there is a small set
1 1
{( , ),..., ( n, n)}
L x y x y consisting of labelled data which will grow in quantity gradually and an arbitrary large set
1
{ ,...,ˆ ˆm}
U x x of unlabelled examples. The query strategies in active learning scenario can be roughly divided into two groups: exploitative methods and explorative methods. The exploitative methods utilize examples of L including the labels and rely on scores derived from outputs of the involved classifier, whereas the explorative methods neglect the label information and query new examples only based on the distribution of the current examples.
For active learning with Gaussian processes, there are several possible query strategies (Alexander F., 2012, Freytag A., 2013):
2.5.1 The Random Selection (Alexander F., 2012):
Without thinking of exploitative method or explorative method, the random selection strategy just select certain samples randomly. However, the change detection results are not stable, for the selection of initial samples will influence the change detection results significantly.
2.5.2 The Predictive mean (Alexander F., 2012):
( )
*( ) *
ˆ
arg m ni ˆ
i
i x U
x U
(4)
Select samples close to the current decision boundary, which belongs to exploitative methods.
2.5.3 The Predictive variance (Alexander F., 2012):
2 ( ) * 2 ( ˆ ) *arg max ˆ
i
i
x U
x U
(5)
Select samples with highest classification uncertainty regarding to the training examples, which belongs to explorative methods.
2.5.4 The Uncertainty (Alexander F., 2012):
( ) ( ) * unc2 ( ) *
ˆ
arg min ˆ
ˆ i i i x U x U x
(6)
Select the most representative samples by making trade-offs between exploitative and explorative methods.
2.5.5 New Example Weight (Freytag A., 2013):
( ) ( )
( ) ( ) * 2 * { 1,1} ˆ *arg max min ˆ
i i i i weight y x U
U x y
x
(7)
Consider the resulting weight for new example, which means we choose the most pessimistic estimate of model change based on the available information currently, without knowing the ground-truth label of y*.
2.5.6 Impact on the Overall Model Change (Freytag A., 2013):
( ) ( ) 1( ) ( ) 2
* * 2 * { 1,1} * 1 ˆ arg max min
1 ˆ i i impact i i n y x U
x y k
U x
K I
(8)
Choose the samples that will affect the current model heavily even with the most plausible label.
The meanings for all parameters appeared in above formulations have been illuminated in previous parts, thus there is no specific interpretation for them in this part.
In experiments, we can choose any query strategies listed above. All those chosen representative samples will be added into training set after labelling them “change” or “no change” manually, which is simulated with actual land cover change truth. Repeat this process until reach the maximum iteration limitation.
3. EXPERIMENTS AND DISSCUSIONS
In this section, we test the proposed interactive change detection method based on active learning with Gaussian processes on remote sensing images from different satellites in MATLAB. The resolution of panchromatic image is relatively higher than multispectral data, and we can add the color information into the image without losing its spatial resolution by pansharping.
3.1 Experiment A
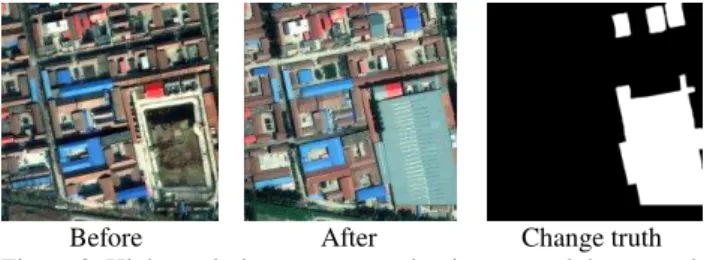
We test the proposed interactive change detection method on two Geo-Eye1 high resolution remote sensing images of Beijing on November 21, 2009 and June 23, 2010, with size of 600*600 pixels and resolution of 0.5 meters in this part. High resolution remote sensing images and the land cover category change truth are shown in Figure 3.
Before After Change truth Figure 3. High resolution remote sensing images and the ground
truth of land cover changes.
Before: on November 21, 2009 After: on June 23, 2010
First, we segment the more complex temporal remote sensing image with SLIC superpixel segmentation method setting the superpixel size to 20*20 pixels, and process the other temporal remote sensing image with previous segmentation boundary. Then, calculate discriminate color descriptor and sift descriptor, and concatenate them after normalization. Calculate the histogram intersection kernel of feature descriptors for superpixel pairs at the same location in different temporal remote sensing images as the similarity metric. The next step is the interactive change detection based on active learning with Gaussian processes which can achieve rapid uncertainty computation. The last is repeating this process until reach the maximum iteration limitation. In this experiment, we set the number of iteration to 40. In the whole process, about 5% of total samples are labelled with user.
Now, we compare the influence of different descriptors: 1) sift descriptor, 2) discriminate color descriptor, 3) sift descriptor and discriminate color descriptor, in contrast experiments using
the same query strategy, such as “the predictive mean”, and the
change detection results are shown in Figure 4 and Table 1. We use Kappa coefficient to measure the consistency between the detected results and the reference value. Pc and Pu represent the detection accuracy for change and no change pixels respectively, OA is the overall accuracy.
SIFT DCD SIFT+DCD
Figure 4. The change detection results of “the predictive mean” for different superpixel descriptors.
Pc Pu OA Kappa
SIFT 0.3803 0.9906 0.8654 0.4734 DCD 0.6896 0.9559 0.9013 0.6807 SIFT+DCD 0.8416 0.9363 0.9169 0.7532 Table 1. The comparison of change detection results generated
by “the predictive mean” for different superpixel descriptors.
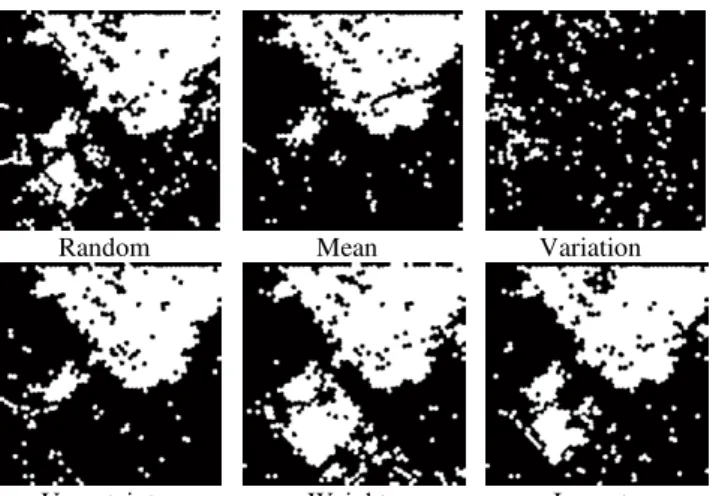
From the change detection results of several experiments, we could find the concatenation of discriminative color descriptor and sift descriptor is efficient. So in the following experiments, we will show the difference between these query strategies with concatenated descriptor. And there is a set of representative experiments in Figure 5 and Table 2, the calculation time needed for each strategy is shown in Figure 6.
Random Mean Variation
Uncertainty Weight Impact
Figure 5. The change detection results for different query strategies with active learning.
Pc Pu OA Kappa
Random 0.8166 0.8941 0.8782 0.6555 Mean 0.8416 0.9363 0.9169 0.7532 Variation 0.0045 1.0000 0.7958 0.0071 Uncertainty 0.8163 0.9459 0.9193 0.7550 Weight 0.8481 0.8362 0.8386 0.5804 Impact 0.8512 0.8477 0.8484 0.6006 Table 2. The comparison of change detection results for
different query strategies with active learning.
Figure 6. The calculation time needed for active learning with Gaussian process
In this set of experiments, we found that “the predictive mean”,
“the uncertainty” are relatively better query strategies for the change detection of high resolution remote sensing images.
3.2 Experiment B
We test the proposed method on two World View high resolution remote sensing images of Inner Mongolia on September 18, 2013 and September 12, 2015, with size of 1000*1000 pixels and resolution of 0.5 meters in this part. High resolution remote sensing images and the land cover category change truth are shown in Figure 7. The size of superpixels sets to 20*20 pixels, and the number of iteration set to 50. The change detection results are shown in Figure 8 and Table 3, the calculation time for each strategy is shown in Figure 9.
Before After Ground Truth Figure 7. High resolution remote sensing images and the ground
truth of land cover changes.
Before: on September 18, 2013 After: on September 12, 2015
Random Mean Variation
Uncertainty Weight Impact
Figure 8. The change detection results for different query strategies with active learning.
Pc Pu OA Kappa
Random 0.7577 0.8503 0.8165 0.6055 Mean 0.7378 0.9549 0.8759 0.7210 Variation 0.1008 0.9092 0.6148 0.0119 Uncertainty 0.7793 0.9385 0.8805 0.7356 Weight 0.7909 0.7946 0.7933 0.5674 Impact 0.7639 0.8742 0.8341 0.6404 Table 3. The comparison of change detection results for
different query strategies with active learning.
Figure 9. The calculation time needed for active learning with Gaussian process
In this set of experiments, we found that “the predictive mean”,
“the uncertainty”, and “impact on overall model change” are three relatively better query strategies for the change detection of high resolution remote sensing images, while the results of
“therandom selection” varied intensely.
4. CONCLUSION
In this change detection framework, we have addressed an interactive change detection method based on active learning with Gaussian processes. First, we demonstrated the effective-ness of the feature combination in classification problem for high resolution remote sensing images. Then, we proposed an interactive change detection framework based on active learning with Gaussian processes for which there are various sample selection strategies, and the user can choose the most appropriate sample selection strategy by comparison in practice. Finally, from the experimental results, we found that “the
predictive mean”, “the uncertainty” and “impact on overall
model change” are three relatively better and more stable query strategies for the change detection of high resolution remote sensing images. In future work, we intend to find more representative sample selection strategies for active learning and explore new ways in eliminating the artefacts near the class borders and sparse erroneously classified superpixels in the change detection results.
ACKNOWLEDGEMENTS
This work is supported by Inner Mongolia Science & Technology Plan (20140155) and Inner Mongolia Key Science & Technology Special Project and the Program for Young Talents of Science and Technology in Universities of Inner Mongolia Autonomous Region (NJYT-14-B09).
REFERENCES
Begüm D., Francesca B., et al, 2012. Detection of Land-Cover Transitions in Multitemporal Remote Sensing Images with Active-Learning-Based Compound Classification. IEEE Transactions on Geoscience and Remote Sensing, 5(5), pp. 1930-1941.
Furlani M., Tuia D., et al, 2012. Discovering Single Classes in Remote Sensing Images with Active Learning. IEEE International Geoscience and Remote Sensing Symposium (IGARSS), pp. 7341-7344.
Jefersson A., Philippe-Henri G., et al, 2013. Interactive Multiscale Classification of High-Resolution Remote Sensing Images. IEEE Journal of Selected Topics in Applied Earth Observations and Remote Sensing, 6(4), pp. 2020-2034.
Moumita R., Susmita G., et al, 2014. A Neural Approach under Active Learning Mode for Change Detection in Remotely Sensed Images. IEEE Journal of Selected Topics in Applied Earth Observations and Remote Sensing, 7(4), pp. 1200-1206.
Kiran M., Jos´e A., et al, 2014. Active Learning classification and change detection on multispectral images. IEEE International Conference on Industrial Informatics, pp. 26-30.
Xiao B., Huigang Z., et al, 2014. VHR Object Detection Based on Structural Feature Extraction and Query Expansion. IEEE Transactions on Geoscience and Remote Sensing, 52(10), pp. 6508-6520.
Achanta R., Shaji A., et al, 2012. SLIC superpixels compared to state-of-the-art superpixel methods. IEEE Transactions on Pattern Analysis and Machine Intelligence, 34(11), pp. 2274-2282.
Rahat K., Joost V., et al, 2013. Discriminative Color Descriptors.Proceedings ofCVPR, pp. 2866-2873.
Lazebnik S., Schmid C., et al, 2006. Beyond bags of features: Spatial pyramid matching for recognizing natural scene categories. IEEE Computer Society Conference on Computer Vision and Pattern Recognition, 2, pp. 2169-2178.
Kristen G., Trevor D., 2005. The Pyramid Match Kernel Discriminative Classification with Sets of Image Features.
Proceedings of ICCV, pp. 1550-1557.
Alexander F., Erik R., et al, 2012. Rapid Uncertainty Computation with Gaussian Processes and Histogram Intersection Kernels. Proceedings of ACCV, pp. 511-524.
Erik R., Alexander F., et al, 2012. Large-Scale Gaussian Process Classification with Flexible Adaptive Histogram Kernels. Proceedings of ECCV, pp. 85-98.
Freytag A., Rodner E., et al, 2013. Labelling examples that matter: Relevance-Based Active Learning with Gaussian Processes. Proceedings of GCPR. pp. 282-291.