www.atmos-chem-phys.org/acp/4/1237/
SRef-ID: 1680-7324/acp/2004-4-1237
Chemistry
and Physics
Ultra-violet absorption cross sections of isotopically substituted
nitrous oxide species:
14
N
14
NO,
15
N
14
NO,
14
N
15
NO and
15
N
15
NO
P. von Hessberg1, J. Kaiser2, *, M. B. Enghoff1, C. A. McLinden3, S. L. Sorensen4, T. R¨ockmann2, and M. S. Johnson1
1Department of Chemistry, University of Copenhagen, Copenhagen, Denmark
2Max-Planck Institute for Nuclear Physics, Atmospheric Physics Division, Heidelberg, Germany 3Air Quality Research Branch, Meteorological Service of Canada, Toronto, Ontario, Canada 4Synchrotron Radiation Research, Lund University, Lund, Sweden
*now at Department of Geosciences, Princeton University, Princeton, New Jersey, USA Received: 23 January 2004 – Published in Atmos. Chem. Phys. Discuss.: 5 May 2004 Revised: 16 July 2004 – Accepted: 16 July 2004 – Published: 10 August 2004
Abstract. The isotopically substituted nitrous oxide species
14N14NO, 15N14NO,14N15NO and 15N15NO were investi-gated by ultra-violet (UV) absorption spectroscopy. High precision cross sections were obtained for the wavelength range 181 to 218 nm at temperatures of 233 and 283 K. These data are used to calculate photolytic isotopic fractionation constants as a function of wavelength. The fractionation con-stants were used in a three-dimensional chemical transport model in order to simulate the actual fractionation of N2O in the stratosphere, and the results were found to be in good agreement with field studies.
1 Introduction
Nitrous oxide is a greenhouse gas (Yung et al., 1976) and the main source of ozone depleting stratospheric NOx(Crutzen, 1970). Through the last decades there has been an inter-est in the isotopic composition of atmospheric nitrous ox-ide. Sources of atmospheric N2O are mainly microbial ni-trogen conversion processes in soils and oceans (Houghton et al., 2001) which generally produce isotopically light N2O compared to atmospheric samples. The N2O emissions are balanced by the downflux of isotopically heavy N2O from the stratosphere (Kim and Craig, 1993; Yoshida and Matsuo, 1983).
The isotopic enrichment of N2O in the stratosphere is caused by its sink reactions: Stratospheric photolysis is the main sink of atmospheric N2O and the reaction with O(1D) also plays a role:
N2O+hν→N2+O(1D)(90%) (1)
N2O+O(1D)→2NO(6%) (2)
Correspondence to:M. S. Johnson ([email protected])
N2O+O(1D)→N2+O2(4%) (3)
Isotopic fractionation due to photolysis is quantified by the fractionation constantε:
ε (λ)= Jheavy Jlight
−1=I (λ) σheavy(λ) I (λ) σlight(λ)
−1= σheavy(λ) σlight(λ)
−1, (4) whereJare photolysis rates of the different isotopic species, σ are isotope specific absorption cross sections andI is the actinic flux. We employ the definition of most studies in the field of atmospheric N2O isotope measurements. The quan-tum yield for photodissociation (1) is unity (DeMore et al., 1997).
Initial measurements of isotopic fractionation in N2O pho-tolysis showed an isotopic enrichment in the residual N2O (Yoshida et al., 1990), but experiments at 185 nm (close to the UV absorption maximum) indicated near zero enrich-ments (Johnston et al., 1995). Therefore several authors sug-gested that non-standard atmospheric chemistry was respon-sible for generating isotopically enriched N2O (McElroy and Jones, 1996; Prasad, 1997; Zipf and Prasad, 1998).
In 1997, Yung and Miller presented a model that used the difference in vibrational zero point energy of isotopically substituted molecules in order to explain shifts in their ab-sorption spectrum and consequently,ε(λ). This model ap-proximates the UV absorption spectra of isotopically heavy N2O by simply blue shifting the spectrum of 14N14N16O by an amount corresponding to the difference in zero point energy, implying near zero isotopic fractionation at the ab-sorption maximum at 182 nm (Yung and Miller, 1997). This model predicted enrichments of isotopically heavy species of N2O half as large as found by laboratory experiments (Rahn et al., 1998).
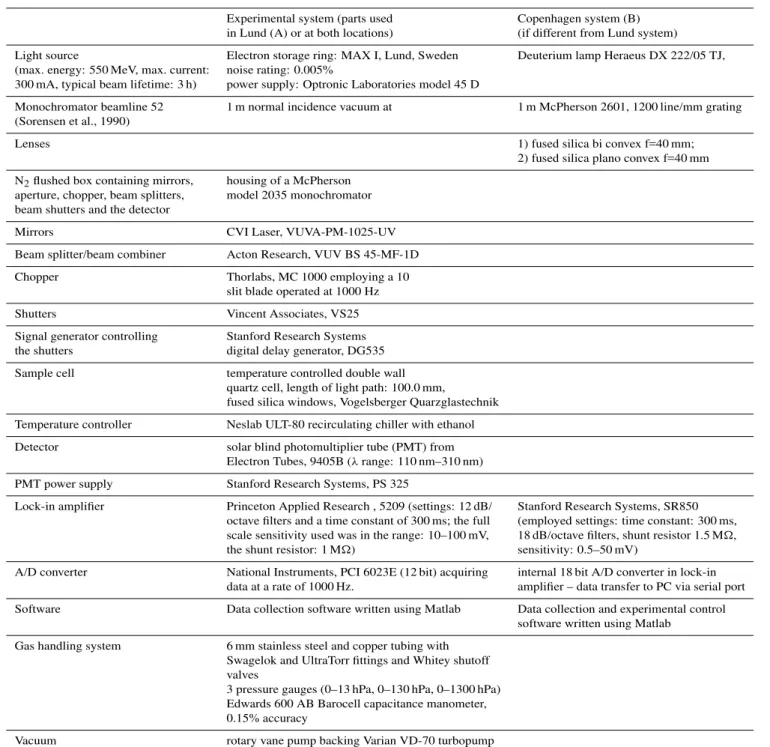
Table 1.The components of the experimental system.
Experimental system (parts used Copenhagen system (B) in Lund (A) or at both locations) (if different from Lund system) Light source Electron storage ring: MAX I, Lund, Sweden Deuterium lamp Heraeus DX 222/05 TJ, (max. energy: 550 MeV, max. current: noise rating: 0.005%
300 mA, typical beam lifetime: 3 h) power supply: Optronic Laboratories model 45 D
Monochromator beamline 52 1 m normal incidence vacuum at 1 m McPherson 2601, 1200 line/mm grating (Sorensen et al., 1990)
Lenses 1) fused silica bi convex f=40 mm;
2) fused silica plano convex f=40 mm
N2flushed box containing mirrors, housing of a McPherson
aperture, chopper, beam splitters, model 2035 monochromator beam shutters and the detector
Mirrors CVI Laser, VUVA-PM-1025-UV
Beam splitter/beam combiner Acton Research, VUV BS 45-MF-1D
Chopper Thorlabs, MC 1000 employing a 10
slit blade operated at 1000 Hz
Shutters Vincent Associates, VS25
Signal generator controlling Stanford Research Systems the shutters digital delay generator, DG535 Sample cell temperature controlled double wall
quartz cell, length of light path: 100.0 mm,
fused silica windows, Vogelsberger Quarzglastechnik
Temperature controller Neslab ULT-80 recirculating chiller with ethanol Detector solar blind photomultiplier tube (PMT) from
Electron Tubes, 9405B (λrange: 110 nm–310 nm) PMT power supply Stanford Research Systems, PS 325
Lock-in amplifier Princeton Applied Research , 5209 (settings: 12 dB/ Stanford Research Systems, SR850 octave filters and a time constant of 300 ms; the full (employed settings: time constant: 300 ms, scale sensitivity used was in the range: 10–100 mV, 18 dB/octave filters, shunt resistor 1.5 M, the shunt resistor: 1 M) sensitivity: 0.5–50 mV)
A/D converter National Instruments, PCI 6023E (12 bit) acquiring internal 18 bit A/D converter in lock-in data at a rate of 1000 Hz. amplifier – data transfer to PC via serial port Software Data collection software written using Matlab Data collection and experimental control
software written using Matlab Gas handling system 6 mm stainless steel and copper tubing with
Swagelok and UltraTorr fittings and Whitey shutoff valves
3 pressure gauges (0–13 hPa, 0–130 hPa, 0–1300 hPa) Edwards 600 AB Barocell capacitance manometer, 0.15% accuracy
Vacuum rotary vane pump backing Varian VD-70 turbopump
R¨ockmann et al., 2000, 2001; Toyoda et al., 2001a; Turatti et al., 2000; Umemoto, 1999; Zhang et al., 2000) have been carried out to investigate the isotopic composition of N2O in the atmosphere and to determine the effect of stratospheric photolysis on the isotopic composition. Also, new theoreti-cal models of the absorption cross section and the resulting isotopic fractionation constants have been presented (Blake et al., 2003; Johnson et al., 2001; Morgan et al., 2004; Nanbu and Johnson, 2004).
Laboratory data and theoretical models of the isotopomer and isotopologue fractionation constants have been used as input for atmospheric models in an effort to refine our knowl-edge of the emissions and chemical sources and sinks of this greenhouse gas (Kaiser, 2002; Kaiser et al., 2001; McLinden et al., 2003; Morgan et al., 2004).
irradiance spectrum in the relevant regions of the strato-sphere. A chemistry and transport model (see Sect. 4) shows that over 99% of the stratospheric N2O photolysis takes place within the wavelength range 181–218 nm. Knowledge of the photolytic fractionation combined with an understanding of atmospheric transport and mixing can lead to realistic models of the actual isotopic distributions.
The UV absorption spectra of the main isotopologues of 14N14NO are yet to be fully investigated. Selwyn and John-ston (1981) published data on14N14NO,15N14NO,14N15NO and15N15NO in the wavelength region 173–197 nm. As the wavelength region 200 to 210 nm is the most important in terms of stratospheric photolysis of nitrous oxide (Yung and Miller, 1997), the data from Selwyn and Johnston are insuf-ficient. Since the red shoulder of the N2O absorption spec-trum above about 188 nm has very little vibrational structure (Yoshino et al., 1997), broadband photolysis and subsequent isotopic analysis appears to be a reasonable way of charac-terizing the magnitude of isotopic fractionation (Kaiser et al., 2002b, 2003c; R¨ockmann et al., 2001). Kaiser et al. (2003c) used the collective results from broadband photolysis and “single wavelength” photolysis experiments to derive a lin-ear fit of fractionation constant vs. wavelength for the range 190 to 220 nm.
We undertook the present study to extend the work of Sel-wyn and Johnston to stratospherically relevant wavelengths, to obtain more detailed information than is available from broadband or single wavelength photolysis studies and to validate the existing data. A secondary purpose is to help refine theoretical models of the effect of isotopic substitu-tion on absorpsubstitu-tion cross secsubstitu-tions (Blake et al., 2003; son et al., 2001; Morgan et al., 2004; Nanbu and John-son, 2004). We report the absorption spectra of14N14NO, 14N15NO,15N14NO and15N15NO at 233 and 283 K over the wavelength range 181 to 218 nm.
2 Experimental
2.1 Spectrometer
The main requirement for the experimental setup was high precision of the resulting cross sections in order to be able to determine fractionation constants in the ‰ range. In order to meet this requirement a custom-designed double beam/single detector setup was used.
The experiments were carried out at two locations: 1. One set of measurements at MAX-lab in Lund, Sweden
using synchrotron radiation together with a 1 m vacuum monochromator.
2. A second set of measurements at the Department of Chemistry at the University of Copenhagen using a deu-terium continuum lamp as light source and a UV/VIS
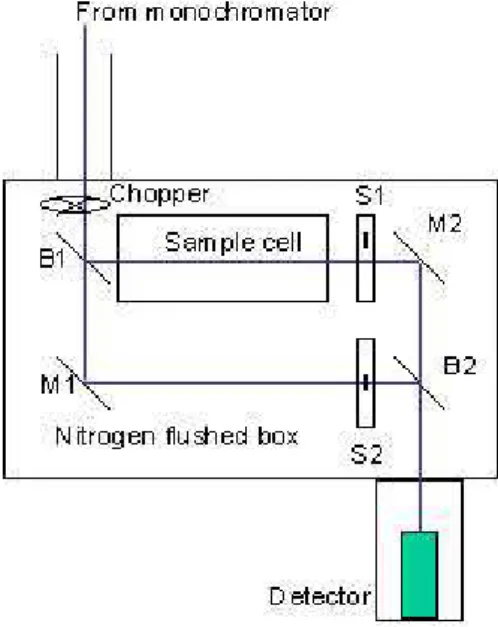
Fig. 1.Outline of the spectrometer design (B1 and B2: semi
trans-parent mirrors (beamsplitters), M1 and M2: mirrors, S1 and S2: shutters switching between sample and reference light paths).
monochromator (1 m). The double beam compartment was the same in both systems.
The elements of the experimental setup are shown and de-scribed in Fig. 1 and Table 1.
2.1.1 Temperature controlled sample cell
The sample cell was a special double-walled design with a path length of 100 mm. Both front and rear windows (quartz) were double with an evacuated spacing in between to provide thermal insulation. The cell was surrounded by 12 mm of insulating foam.
Ethanol was used as cooling liquid and was flushed through the outer jacket of the insulated sample cell. The temperature was monitored via thermistors located at the exit tube for ethanol from the double beam compartment and at the cooling unit. Later (at site B) the temperature monitoring was improved by increasing the ethanol flow and inserting a thermistor in the ethanol directly after the exit from the sam-ple cell. The cooling unit was a Neslab ULT-80 cryogenic cooler. It was able to stabilize the temperature to +/−0.1 K over a range of 193 K to 283 K. The recirculating cooling unit was connected to the sample cell via 2 insulated hoses of about 1.5 m length and 10 mm inner diameter.
170 175 180 185 190 195 200 205 210 215 220 −60
−40 −20 0 20 40 60
relative difference in cross sections / 10
−
3
λ / nm
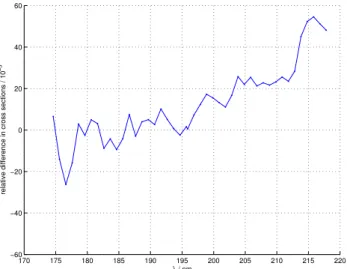
Fig. 2.Comparison of measured absolute cross sections (T=283 K)
of natural abundance nitrous oxide with literature values (Yoshino et al., 1984). The literature cross sections were measured at room tem-perature and have been temtem-perature corrected following (Selwyn et al., 1977). The literature values are high resolution, averages have been calculated employing a Gaussian filter with width 0.6 nm.
2.1.2 Gases The gases used were:
– Natural abundance N2O, 99% (manufacturer specified) chemical purity, Sigma Aldrich, cat. no.: 29 559-0, 99.3% isotopic purity14N14NO (this work)
– 15N15NO ICON 99.50% isotopic purity
– 14N15NO ICON 98.95% isotopic purity
– 15N14NO ICON 99.22% isotopic purity
The isotopic composition of the enriched samples was checked using isotope ratio mass spectrometry and Fourier transform infrared spectroscopy (FTIR). The quoted purities reflect these measurements. The small isotopic impurities are unimportant; for example: 1% isotopic impurity of iso-topically different N2O with anσ (λ)differing by as much as 100‰ (from the main species in the sample) would lead to an error inεof only 1‰. While the symbol ‘O’ is used through-out this paper for oxygen (denoting a mixture of16O,17O and18O), it is important to note that the samples, containing less than a few per mil of the heavy isotopes, are essentially 16O.
Before measurements the enriched samples underwent two freeze/pump/thaw cycles (using liquid N2) in order to re-move non-condensable gases. After finishing the experi-ments FTIR spectra of all the N2O samples were obtained in order to check for impurities. All observed bands in the investigated infrared region (1500 cm−1–4000 cm−1)could
be attributed to N2O, H2O or CO2. The water concentra-tion was found to be<1‰ and the CO2concentration was <0.5‰ of the total. The CO2 and water content were esti-mated employing the HITRAN line parameters (Rothman et al., 2003) and the spectral fitting softwareNLM4from David Griffith (Feilberg et al., 2002).
Nitrogen (99.998% purity) was used to flush the 30 L dou-ble beam compartment at a flow rate of∼10 L/min.
2.2 Experimental procedure 2.2.1 Procedure at MAX-lab
The 1 m normal incidence monochromator was used with a 1200 line/mm spherical grating. The slit width was set to 400µm; this resulted in an effective photon bandwidth of about 0.7 nm.
The double beam setup comprising a beam splitter, a beam combiner and two mirrors with the thermostatic sample cell in the sample channel (see Fig. 1) was aligned using the zero order light from the bending magnet source; the visi-ble spot was quite well defined which made alignment by sight straightforward. The goal of the alignment was to com-bine the split beam into a parallel single beam in order to have light from the same region of the source beam hitting the same spot on the detector no matter which path it may have followed. In this way we minimized the influence of any possible spatial variations in detector sensitivity.
The double beam compartment containing the sample cell and detector was connected to the evacuated beam line exit port through a sapphire window. The box itself was not evac-uated but flushed with N2in order to avoid UV absorption by O2and H2O.
An optical chopper was mounted before the beam splitter and operated at 1000 Hz. It was required in order to remove DC offset from for example detector dark current. The signal from the PMT was demodulated by a lock-in amplifier that generated a DC voltage proportional to the AC part of the incoming signal. The DC voltage was fed into a 12-bit A/D converter and recorded by a computer.
sections could be obtained over a broader spectral range. The final measurements were carried out at p≈40 hPa.
A wavelength calibration was carried out after the N2O experiments employing a linear fit on the basis of oxygen absorption lines in the Schumann- Runge band at∼180 nm, and the zero order light. After the calibration (which re-sulted in a wavelength shift of:λest imat ed=1.0034*λreading)
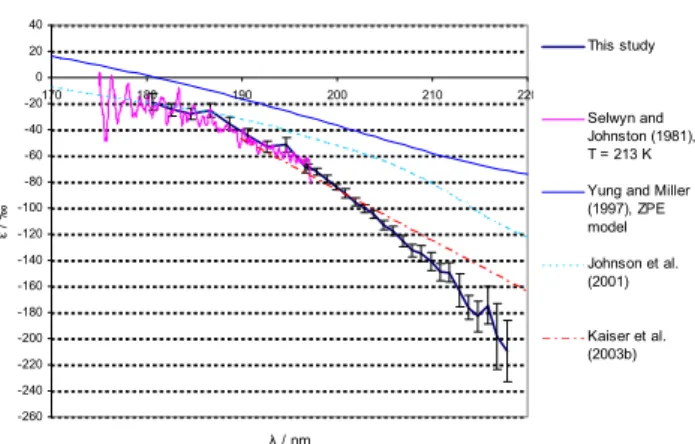
a comparison of the natural abundance spectrum with the temperature-corrected high-resolution data from Yoshino et al. (1997) showed a good match (Fig. 2). The temperature correction was performed using the parameterisation of Sel-wyn et al. (1977).
Spectra of the four gases (natural abundance, 15N15NO, 14N15NO and15N14NO) were measured at 233 and 283 K. Reference spectra of the empty sample cell were recorded before and after every sample spectrum. The 233 K spectra were recorded with a step size of about 2 nm, whereas the 283 K spectra were recorded with a step size of about 1 nm. The spectral region investigated was 166 to 230 nm. How-ever, highly accurate cross sections could only be obtained for the wavelength range of ca. 181 nm to about 200 nm due to small impurities of water in the isotopically rare sam-ples that absorbed strongly at shorter wavelengths, and pro-hibitively small absorbances at longer wavelengths.
While making measurements at MAX-lab during daytime, the reproducibility was significantly worse compared to night time measurements. The data presented here are solely based on night time measurements. A simple test using liquid N2 to cool the detector housing suggested that elevated daytime detector temperatures were at least partly responsible for this. 2.2.2 Procedure in Copenhagen
Overall the experimental setup and procedure were largely the same as those employed at MAX-lab. The spectrome-ter room in Copenhagen was thermostatically stabilized to 295(+/−1)K using a mobile air conditioner. Before mea-suring spectra the monochromator was calibrated using lines from an Hg discharge lamp. The alignment procedure for the double beam setup was similar to the one outlined above with the exception that a HeNe laser was the alignment light source. The data acquisition was slightly altered: A differ-ent lock-in amplifier was used allowing acquisition of the signal in digital form directly from the amplifier. The light source was an ultra stable deuterium lamp. The short-term drift and noise of the complete system (light source, detec-tor and amplifier) was found to be<0.2‰ (within>1 min). Convex lenses of fused silica were mounted between lamp and monochromator as well as between monochromator and double beam compartment in order to get a strong collimated beam through the double beam setup. The Copenhagen data was collected using a one meter monochromator (McPher-son model 2061, 1200 groove/mm grating) with a range ex-tending to 185 nm. The instrument did not support nitrogen
flushing. The changing oxygen concentration and absorption made cross section measurements below 195 nm imprecise.
In Copenhagen spectra were recorded at 233 K and 283 K at N2O pressures of ca. 95 hPa. The slit widths of the monochromator were set to 800µm and the effective instru-mental bandwidth (tested using an Hg line at 254 nm) was 1.10 nm. Four spectra were taken for every one of the four gas samples at both temperatures. The spectral range covered was 196–218 nm. The step width was 1 nm.
3 Results
3.1 Cross sections and fractionation constants
Fractionation constants for the isotopically rare species (14N15NO, 15N14NO and 15N15NO) were calculated from their cross sections relative to the natural abundance sample cross sections (which is regarded as14N14NO). Cross sec-tions were calculated from three consecutive spectra: empty cell/filled cell/empty cell. The average of the two empty cell spectra was employed to quantify the background ab-sorbance. The final results constitute an average of 3 or 4 independent sets of spectra.
In general the cross sections obtained with setup (B) dis-played a better reproducibility than the Lund data (A). How-ever the Copenhagen experiments (B) were hampered by O2 in the light path. It was therefore decided to combine the Lund (A) and Copenhagen (B) results into a single data set: The data for wavelengths shorter than 196.8 nm were taken from the Lund measurements (A) and the Copenhagen mea-surements (B) are used for the longer wavelengths. For all species and temperatures theεvalues derived from the Lund and Copenhagen measurements coincide within the mutual experimental errors.
The fractionation constants are presented in Figs. 3 and 4 and Tables 2 and 3. The tables also show the measured absolute cross sections; in Fig. 2 the measured absolute cross section for natural abundance is compared with the dataset from Yoshino et al. (1984).
3.2 Uncertainties
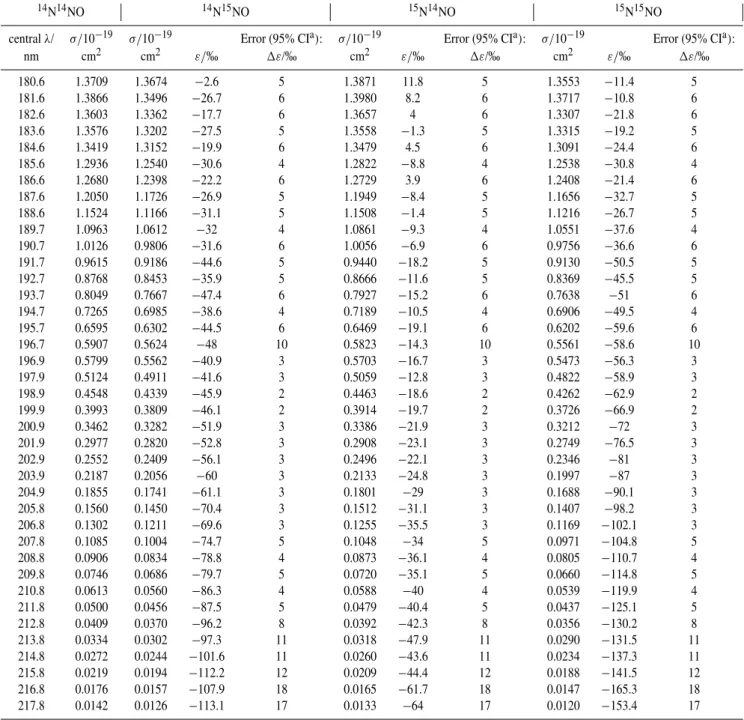
Table 2.Cross sections and fractionation constants at 283 K.
14N14NO 14N15NO 15N14NO 15N15NO
centralλ/ σ/10−19 σ/10−19 Error (95% CIa): σ/10−19 Error (95% CIa): σ/10−19 Error (95% CIa):
nm cm2 cm2 ε/‰ 1ε/‰ cm2 ε/‰ 1ε/‰ cm2 ε/‰ 1ε/‰
180.6 1.3709 1.3674 −2.6 5 1.3871 11.8 5 1.3553 −11.4 5
181.6 1.3866 1.3496 −26.7 6 1.3980 8.2 6 1.3717 −10.8 6
182.6 1.3603 1.3362 −17.7 6 1.3657 4 6 1.3307 −21.8 6
183.6 1.3576 1.3202 −27.5 5 1.3558 −1.3 5 1.3315 −19.2 5
184.6 1.3419 1.3152 −19.9 6 1.3479 4.5 6 1.3091 −24.4 6
185.6 1.2936 1.2540 −30.6 4 1.2822 −8.8 4 1.2538 −30.8 4
186.6 1.2680 1.2398 −22.2 6 1.2729 3.9 6 1.2408 −21.4 6
187.6 1.2050 1.1726 −26.9 5 1.1949 −8.4 5 1.1656 −32.7 5
188.6 1.1524 1.1166 −31.1 5 1.1508 −1.4 5 1.1216 −26.7 5
189.7 1.0963 1.0612 −32 4 1.0861 −9.3 4 1.0551 −37.6 4
190.7 1.0126 0.9806 −31.6 6 1.0056 −6.9 6 0.9756 −36.6 6
191.7 0.9615 0.9186 −44.6 5 0.9440 −18.2 5 0.9130 −50.5 5
192.7 0.8768 0.8453 −35.9 5 0.8666 −11.6 5 0.8369 −45.5 5
193.7 0.8049 0.7667 −47.4 6 0.7927 −15.2 6 0.7638 −51 6
194.7 0.7265 0.6985 −38.6 4 0.7189 −10.5 4 0.6906 −49.5 4
195.7 0.6595 0.6302 −44.5 6 0.6469 −19.1 6 0.6202 −59.6 6
196.7 0.5907 0.5624 −48 10 0.5823 −14.3 10 0.5561 −58.6 10
196.9 0.5799 0.5562 −40.9 3 0.5703 −16.7 3 0.5473 −56.3 3
197.9 0.5124 0.4911 −41.6 3 0.5059 −12.8 3 0.4822 −58.9 3
198.9 0.4548 0.4339 −45.9 2 0.4463 −18.6 2 0.4262 −62.9 2
199.9 0.3993 0.3809 −46.1 2 0.3914 −19.7 2 0.3726 −66.9 2
200.9 0.3462 0.3282 −51.9 3 0.3386 −21.9 3 0.3212 −72 3
201.9 0.2977 0.2820 −52.8 3 0.2908 −23.1 3 0.2749 −76.5 3
202.9 0.2552 0.2409 −56.1 3 0.2496 −22.1 3 0.2346 −81 3
203.9 0.2187 0.2056 −60 3 0.2133 −24.8 3 0.1997 −87 3
204.9 0.1855 0.1741 −61.1 3 0.1801 −29 3 0.1688 −90.1 3
205.8 0.1560 0.1450 −70.4 3 0.1512 −31.1 3 0.1407 −98.2 3
206.8 0.1302 0.1211 −69.6 3 0.1255 −35.5 3 0.1169 −102.1 3
207.8 0.1085 0.1004 −74.7 5 0.1048 −34 5 0.0971 −104.8 5
208.8 0.0906 0.0834 −78.8 4 0.0873 −36.1 4 0.0805 −110.7 4
209.8 0.0746 0.0686 −79.7 5 0.0720 −35.1 5 0.0660 −114.8 5
210.8 0.0613 0.0560 −86.3 4 0.0588 −40 4 0.0539 −119.9 4
211.8 0.0500 0.0456 −87.5 5 0.0479 −40.4 5 0.0437 −125.1 5
212.8 0.0409 0.0370 −96.2 8 0.0392 −42.3 8 0.0356 −130.2 8
213.8 0.0334 0.0302 −97.3 11 0.0318 −47.9 11 0.0290 −131.5 11
214.8 0.0272 0.0244 −101.6 11 0.0260 −43.6 11 0.0234 −137.3 11
215.8 0.0219 0.0194 −112.2 12 0.0209 −44.4 12 0.0188 −141.5 12
216.8 0.0176 0.0157 −107.9 18 0.0165 −61.7 18 0.0147 −165.3 18
217.8 0.0142 0.0126 −113.1 17 0.0133 −64 17 0.0120 −153.4 17
a95% confidence intervals.
3.2.1 Pressure
The relative cross sections are based on measurements of both the isotopically rare sample and natural abundance ni-trous oxide with approximately equal pressures (for the Lund measurements (A) ca. 40 hPa and for the Copenhagen mea-surements (B) ca. 95 hPa). This approach minimizes detri-mental effects from non-linear or otherwise inaccurate
pres-sure gauges and contributions from prespres-sure dependent ef-fects on the absorption cross-section. The pressure of a given gas was measured using a calibrated high-precision capaci-tance pressure gauge with a nominal accuracy of 0.15%.
Table 3.Cross sections and fractionation constants at 233 K.
14N14NO 14N15NO 15N14NO 15N15NO
central σ/10−19 σ/10−19 Error (95% CIa): σ/10−19 Error (95% CIa): σ/10−19 Error (95% CIa):
λ/nm cm2 cm2 ε/‰ 1ε/‰ cm2 ε/‰ 1ε/‰ cm2 ε/‰ 1ε/‰
180.6 1.3206 1.3121 −6.4 7 1.3364 12 7 1.2956 −18.9 7
182.6 1.3075 1.2806 −20.6 5 1.3154 6 5 1.2752 −24.7 5
184.6 1.2685 1.2382 −23.9 4 1.2781 7.6 4 1.2330 −28 4
186.6 1.1849 1.1563 −24.1 5 1.1966 9.9 5 1.1550 −25.2 5
188.6 1.0683 1.0331 −32.9 5 1.0689 0.6 5 1.0306 −35.3 5
190.7 0.9263 0.8942 −34.6 5 0.9235 −3 5 0.8853 −44.3 5
192.7 0.7864 0.7574 −36.8 4 0.7836 −3.6 4 0.7446 −53.1 4
194.7 0.6394 0.6128 −41.6 5 0.6357 −5.8 5 0.6063 −51.7 5
196.7 0.5100 0.4833 −52.5 5 0.5022 −15.3 5 0.4751 −68.4 5
196.9 0.5000 0.4738 −52.4 2 0.4894 −21.1 2 0.4659 −68.2 2
197.9 0.4375 0.4144 −52.6 3 0.4289 −19.5 3 0.4058 −72.4 3
198.9 0.3841 0.3614 −59 3 0.3742 −25.6 3 0.3541 −78 3
199.9 0.3330 0.3130 −60.1 2 0.3246 −25.3 2 0.3051 −83.8 2
200.9 0.2856 0.2668 −65.7 3 0.2773 −29 3 0.2602 −88.8 3
201.9 0.2424 0.2259 −68 3 0.2352 −29.6 3 0.2193 −95.2 3
202.9 0.2052 0.1901 −73.5 3 0.1985 −32.7 3 0.1846 −100.2 3
203.9 0.1733 0.1599 −77 3 0.1672 −34.9 3 0.1551 −104.8 3
204.9 0.1451 0.1332 −82.2 3 0.1397 −37.4 3 0.1287 −113.2 3
205.8 0.1199 0.1096 −86.1 4 0.1153 −38.7 4 0.1058 −117.2 4
206.8 0.0986 0.0896 −91.4 4 0.0946 −40 4 0.0862 −125.1 4
207.8 0.0807 0.0727 −98.2 5 0.0774 −40.7 5 0.0700 −132.5 5
208.8 0.0665 0.0597 −103.1 6 0.0634 −46.5 6 0.0575 −134.8 6
209.8 0.0540 0.0482 −106.4 7 0.0515 −46.5 7 0.0464 −140.8 7
210.8 0.0435 0.0385 −114.7 7 0.0413 −50.5 7 0.0370 −149.1 7
211.8 0.0349 0.0308 −116.7 7 0.0328 −58.8 7 0.0297 −149.5 7
212.8 0.0282 0.0246 −127.1 12 0.0263 −68.7 12 0.0236 −163.1 12
213.8 0.0228 0.0198 −129.5 9 0.0214 −62 9 0.0188 −176.2 9
214.8 0.0182 0.0157 −138.7 12 0.0171 −63 12 0.0149 −183 12
215.8 0.0144 0.0122 −155.3 15 0.0135 −60.2 15 0.0119 −174.4 15
216.8 0.0115 0.0095 −169.3 25 0.0106 −74.7 25 0.0092 −198.3 25
217.8 0.0091 0.0076 −168 24 0.0082 −103.7 24 0.0072 −209.4 24
a95% confidence intervals.
3.2.2 Purity of gas
The purity of the gas samples is crucial for the accuracy of the quoted fractionation values. The purity of the isotopi-cally rare gas samples was analysed before and after the ex-periments using FTIR spectroscopy: After the exex-periments the only detectable non-N2O impurities were CO2and water at mixing ratios of <0.5 mmol/mol and <1 mmol/mol, re-spectively. For the Copenhagen experiments the reservoir gas was kept at T<170 K during filling of the spectrometer cell, thus the water vapor content was essentially zero. The nat-ural abundance N2O sample was analysed using FTIR spec-troscopy; no infrared active compounds were present above the detection limit; we estimate the chemical purity to be >99.9% (the manufacturer’s specification is only 99% chem-ical purity). The total estimated error due to impurities of the gas is:<1.5‰ (Lund) and<1‰ (Copenhagen).
3.2.3 Noise and drift
ε(14N15NO), T = 283 K -140 -120 -100 -80 -60 -40 -20 0 20 40
170 180 190 200 210 220
λ / nm
ε
/ ‰
This study
Selwyn and Johnston (1981), T = 301 K Röckmann et al. (2000)
Turatti et al. (2000)
Zhang et al. (2000)
Kaiser (2002)
Kaiser et al. (2003b), linear fit
Yung and Miller (1997), ZPE model Johnson et al. (2001), HP
σ
Fig. 3a.Measured fractionation constant (ε)for14N15NO at 283 K, compared with: previous experiments at room temperature (298 K or 301 K) and results from model calculations (HP and ZPE models) for T=283 K. Y error bars indicate 95% confidence intervals (this study) and 2σ for the previous studies. X error bars indicate 25% and 75% photolysis quartiles for the broadband experiments.
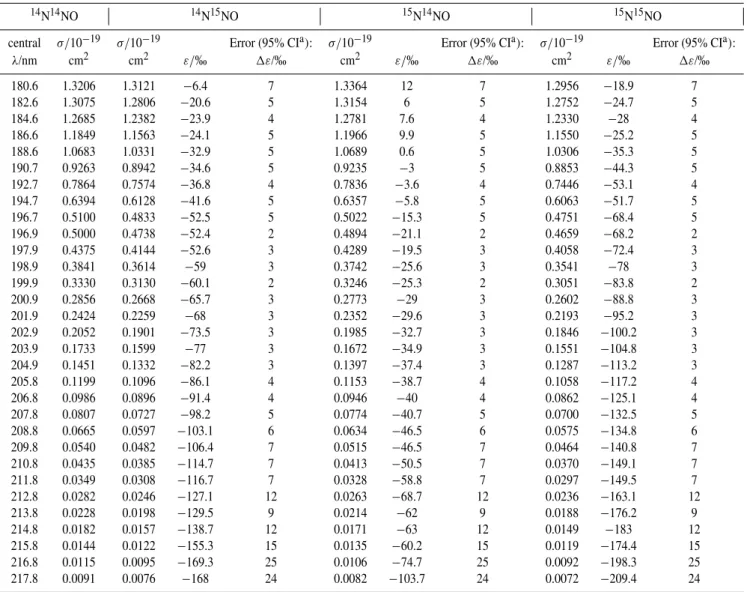
ε(15N14NO), T = 283 K
-100 -80 -60 -40 -20 0 20 40 60
170 180 190 200 210 220
λ / nm
ε
/ ‰
This study
Selwyn and Johnston (1981), T = 301 K Röckmann et al. (2000)
Turatti et al. (2000)
Zhang et al. (2000)
Kaiser (2002)
Kaiser et al. (2003b), linear fit
Yung and Miller (1997), ZPE model Johnson et al. (2001), HP model
σ
Fig. 3b.Measured fractionation constant (ε)for15N14NO at 283 K, compared with: previous experiments at room temperature (298 K or 301 K) and results from model calculations (HP and ZPE models) for T=283 K. Y error bars indicate 95% confidence intervals (this study) and 2σ for the previous studies. X error bars indicate 25% and 75% photolysis quartiles for the broadband experiments.
3.2.4 Temperature
For all sets of experiments the spectra of natural abundance nitrous oxide measured at the start and end of the correspond-ing measurement session showed no significant change in cross sections that could be attributed to temperature drift. 3.2.5 Total uncertainty of fractionation constants
The total error estimate constitutes the sum of random er-ror (95% confidence intervals) and an estimated 1‰ (Copen-hagen) or 1.5‰ (Lund) systematic contribution due to pos-sible impurities in the samples. Pressure, temperature, noise
ε(15N15NO), T = 283 K
-200 -180 -160 -140 -120 -100 -80 -60 -40 -20 0 20 40 60
170 180 190 200 210 220
λ / nm
ε
/ ‰
This study
Selwyn and Johnston (1981), T = 301 K Röckmann et al. (2000)
Turatti et al. (2000)
Zhang et al. (2000)
Kaiser (2002)
Kaiser et al. (2003b), linear fit
Yung and Miller (1997), ZPE model Johnson et al. (2001), HP model
σ
Fig. 3c.Measured fractionation constant (ε)for15N15NO at 283 K, compared with: previous experiments at room temperature (298 K or 301 K) temperature and results from model calculations (HP and ZPE models) for T=283 K. The data from R¨ockmann et al. (2000), Turatti et al. (2000), Zhang et al. (2000), Kaiser (2002, 2003b) rep-resent the sum ofε(14N15NO) andε(15N14NO). Y error bars indi-cate 95% confidence intervals (this study) and 2*σ for the previous studies. X error bars indicate 25% and 75% photolysis quartiles for the broadband experiments.
and drift contributions to the error were regarded as being of random nature.
3.3 Instrumental bandwidth
The monochromator slit widths in the Lund experiments were 400µm which resulted in an instrumental bandwidth of ca. 0.7 nm. The step size during the scan was 2 nm (T=233 K) and 1 nm (T=283 K) – larger than the instrumental band-width. This was a mistake: To obtain valid average values for the cross section over the complete spectral range, the instru-mental bandwidth should be larger than the step size. The high resolution UV spectrum of nitrous oxide by Yoshino et al. (1984) shows that there is little vibrational fine struc-ture forλ<185 nm. The features measured in our spectra are therefore representative of the spectra which could be ob-tained with a smaller step size. It can thus be concluded that the potential error due to inconsistent bandwidths and step sizes is limited.
For the Copenhagen experiments (λ>196.8 nm) the instru-mental bandwidth was 1.1 nm and the step size 1 nm. 3.4 Comparison with other data
ε(14N15NO), T = 233 K -220 -200 -180 -160 -140 -120 -100 -80 -60 -40 -20 0 20 40
170 180 190 200 210 220
λ / nm
ε
/ ‰
This study
Selwyn and Johnston (1981), T = 213 K Yung and Miller (1997), ZPE model Johnson et al. (2001)
Kaiser et al. (2003b), linear fit, T corrected
Fig. 4a.Measured fractionation constant (ε)for14N15NO at 233 K, compared with: Temperature shifted (see Eq. 6) linear fit on basis of photolysis experiments (Kaiser et al., 2003c), HP model results (Johnson et al., 2001) and ZPE model results (Yung and Miller, 1997). Error bars indicate 95% confidence intervals.
range from 185 to 213 nm (Kaiser et al., 2002b, 2003c; Rahn et al., 1998; R¨ockmann et al., 2000, 2001; Toyoda et al., 2001a; Turatti et al., 2000; Umemoto, 1999; Zhang et al., 2000), broadband photolysis experiments (Kaiser et al., 2003c; R¨ockmann et al., 2001) as well as spectroscopic data from 173 nm to 197 nm (Selwyn and Johnston, 1981). For the low temperatures the only existing wavelength re-solved experimental data are those from Selwyn and John-ston (1981) from 173 nm to 197 nm; however a tempera-ture dependence study based on broadband photolysis exists (Kaiser et al., 2002b). For15N15NO the only existing data are those from Selwyn and Johnston and one broadband pho-tolysis study (Kaiser et al., 2003a).
The standard error for the linear fit (Kaiser et al., 2003a) is not shown in Figs. 3 to 5 because it is very small (error (dε/dλ)=0.02 to 0.25‰/nm, error (ε200 nm)=0.1‰). This er-ror estimate relies on the validity of the underlying assump-tion thatεcan be represented by a linear function ofλ.
The magnitude of error on the εdata from the previous spectroscopic study by Selwyn and Johnston (1981) is not well known, but apparently quite substantial: The authors write: ‘at low energies the isotope shift and the random ex-perimental error are about equal’.
Most of the single wavelength photolysis experiments were carried out at mixing ratios of ≥4 mmol/mol (Zhang et al., 2000): ca. 10 mmol/mol, (Turatti et al., 2000): ca. 7 mmol/mol, (R¨ockmann et al., 2000): ca. 4 mmol/mol); for a mixing ratio of 4 mmol/mol, Kaiser et al. (2002b) found a significantly non-linear relationship between εln(f) and ln(1+1δ)at mixing ratios of 4 mmol/mol (probably due to reaction between O(1D) and N2O), while mixing ratios of 1 mmol/mol produced essentially linear results. The pub-lishedεvalues are based on the assumption of a linear re-lationship betweenεln(f) and ln(1+1δ), therefore the values may be (slightly) erroneous.
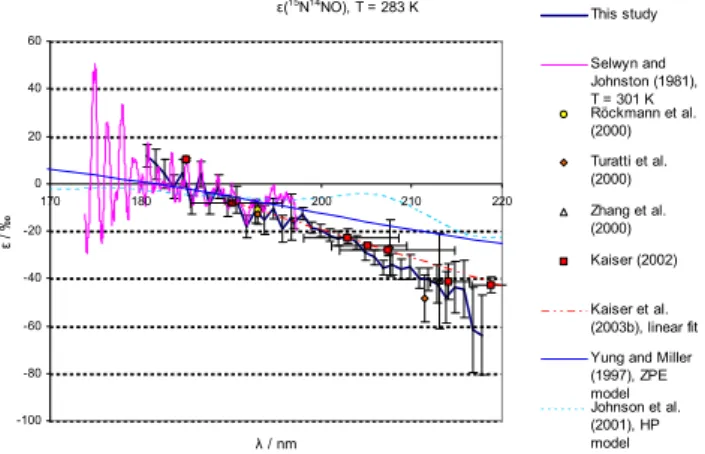
ε(15N14NO), T = 233 K
-140 -120 -100 -80 -60 -40 -20 0 20 40 60
170 180 190 200 210 220
λ / nm
ε
/ ‰
This study
Selwyn and Johnston (1981), T = 213 K
Yung and Miller (1997), ZPE model
Johnson et al. (2001)
Kaiser et al. (2003b), linear fit, T corrected
Fig. 4b.Measured fractionation constant (ε)for15N14NO at 233 K, compared with: Temperature shifted (cf. Eq. 6) linear fit on ba-sis of photolyba-sis experiments (Kaiser et al., 2003c), HP model re-sults (Johnson et al., 2001) and ZPE model rere-sults (Yung and Miller, 1997). Error bars indicate 95% confidence intervals.
ε(15N15NO), T = 233 K
-260 -240 -220 -200 -180 -160 -140 -120 -100 -80 -60 -40 -20 0 20 40
170 180 190 200 210 220
λ / nm
ε
/ ‰
This study
Selwyn and Johnston (1981), T = 213 K
Yung and Miller (1997), ZPE model
Johnson et al. (2001)
Kaiser et al. (2003b)
Fig. 4c. Measured fractionation constants for 15N15NO at
T=233 K, compared with model results from the Temperature shifted linear fit (cf. Eq. 6) based on photolysis experiments (ε(14N15NO)+ε(15N14NO)(Kaiser et al., 2003b), HP model (John-son et al., 2001) and ZPE model (Yung and Miller, 1997). Error bars indicate 95% confidence intervals.
3.4.1 Comparison with previous experiments
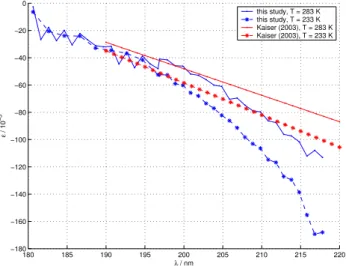
The temperature dependence ofεis only slight, therefore the data from this study (T=283 K) may be directly compared to room temperature measurements.
180 185 190 195 200 205 210 215 220 −180
−160 −140 −120 −100 −80 −60 −40 −20 0
ε
/ 10
−
3
λ / nm
this study, T = 283 K this study, T = 233 K Kaiser (2003), T = 283 K Kaiser (2003), T = 233 K
λ
Fig. 5.Temperature dependence of fractionation constant (ε)–
ex-emplified by14N15NO. The reference (Kaiser et al., 2002b) data represent the linear fit ofε(λ)based on combined wavelength de-pendent room temperature photolysis data (Kaiser et al., 2003c) and broadband photolysis experiments with variable T (Kaiser et al., 2002b)(cf. Eq. 6).
disagreement with the linear fit grows forλ>205 nm. The data from this study are in good agreement with the single wavelength results for 185 nm (Kaiser et al., 2003c), 193 nm (R¨ockmann et al., 2000) and 207.6 nm (Turatti et al., 2000); whereas this study is not in agreement with the 193 nm and 211.5 nm experiments by Turatti et al. (2000) as well as the 213 nm experiment by Zhang et al. (2000). The disagree-ment forε(14N15NO) atλ>205 nm with the existing data is a matter of concern. The disagreement with the linear fit is not so worrying since a closer look at the underlying broad-band photolysis results (Kaiser et al., 2002a) reveals that the 95% confidence intervals of our data overlap with the results from broadband experiments at median wavelengths of ca. 204, 214 and 219 nm (Kaiser et al., 2003). However con-sidering the better precision and higher wavelength resolu-tion of the present data-set, it seems likely that theε(λ)has some negative curvature and the linear fit applied by Kaiser et al. (2003c) is most probably not appropriate. This is also in line with the qualitative results from most recent theoret-ical models, comprising the time-dependent (Johnson et al., 2001; Nanbu and Johnson, 2004) and the semi-empirical ‘re-flection principle’ approaches (Blake et al., 2003; Morgan et al., 2004) – the present findings point to a negative curvature of the function representingε(λ). The agreement with the previous spectroscopic study (Selwyn and Johnston, 1981) is quite good for all species and temperatures atλ<187 nm. The disagreement at longer wavelengths is probably due to the insufficient accuracy of the old data.
3.4.2 Comparison with models
The model results from the HP and ZPE models are in quan-titative disagreement with this study. For 283 K both the HP and ZPE model underestimate the magnitude of isotopic fractionation roughly by a factor of two (around 200 nm); at 233 K the HP model is in better agreement with the mea-sured values in the case of14N15NO and15N15NO (a factor of 1.3 difference for 14N15NO and 1.5 for15N15NO). The ZPE model clearly is a very crude model – only one mass dependent term (the vibrational zero point energy in the elec-tronic ground state) in the complex function representing the photodissociation cross section is considered. As shown in Johnson et al. (2001) a whole suite of mass dependent ef-fects are of importance for the photodissociation cross sec-tions. The disagreement with the HP model results may be explained by the deficiencies of the employed potential en-ergy surface (PES) in the model, which does not incorporate the N-N stretching motion.
Morgan et al. (2004) have developed a semi-empirical model for the isotope effects. The detailed description of the employed method and formulae were not available at the time of writing – therefore Figs. 3 and 4 do not show a com-parison with these model results. A rough comcom-parison shows that their model is in agreement with the new15N14NO 283 K data presented here. Both the14N15NO and 15N15NO pre-dictions are shifted towards higher fractionation constants by 15–20‰ compared with the experiments. This leads to an erroneous fractionation factor at the absorption peak wave-length and may be related to the lack of some types of dy-namic behaviour in their model as discussed in Sect. 5.
4 Modelling
One way of evaluating these data is to use them in the pre-diction of stratospheric abundances of the isotopically rare species of nitrous oxide in a global atmospheric model and then compare these predictions with field studies. Two-dimensional (Kaiser et al., 2001; Kaiser, 2002; Miller and Yung, 2000; Morgan et al., 2004; Yung and Miller, 1997) and three-dimensional (McLinden et al., 2003) models have been used previously to simulate the distribution of the iso-topically rare species of N2O; however, each of these model studies relied on theoretical values for the cross section frac-tionation constants. In this work we have the advantage of using detailed laboratory data to model the photolysis.
Table 4.Overview of previous studies of N2O fractionation constants used as comparison in Figs. 3 and 4.
Author(s) year method wavelength/nm temperature(s)/K
Selwyn and Johnston 1981 VUV spectroscopy 173–197 213 and 301
Turatti et al. 2000 laser photolysis, FTIR detection 193, 211.5, 207.6 298
R¨ockmann et al. 2000 laser photolysis, IRMS detection 193 298
Zhang et al. 2000 laser photolysis, FTIR detection 212.8 298
Kaiser et al. 2003b photolysis with Hg(Ar) lamp, IRMS detection 185 301
Kaiser et al. 2003b linear fit on basis of broadband and single wavelength photolysis 190–220 room temperature
Yung and Miller 1997 zero point energy (ZPE) model all all
Johnson et al. 2001 ab initio Hermite propagator (HP) model all all
realistic N2O distributions with a lifetime of about 115 years (Olsen et al., 2001). It has been used previously to model iso-topologues of14N14N16O by treating each as an independent tracer (McLinden et al., 2003).
In the CTM, chemical loss is implemented using a pre-calculated loss frequency (J+k[O(1D)], see Eqs. 1–3) table for each N2O isotopologue. Each table is calculated in a photochemical box model (McLinden et al., 2000) as a func-tion of latitude, altitude, and time of year and is based on climatological atmospheres and standard chemical rate data and cross sections (Sander et al., 2000). Photolysis rates (J) for the isotopically rare species (14N15NO, 15N14NO, and 15N15NO) are calculated using the standard 14N14NO ab-sorption cross sections modified by the cross section frac-tionation constants in Tables 2 and 3, analogous to the pro-cedure in (McLinden et al., 2003). Loss of the isotopically rare species through the reactions with O(1D) is modelled using reaction rate coefficients for14N14NO (Sander et al., 2000) modified by a constant fractionation constant as mea-sured by Kaiser et al. (2002a). To simulate the distributions in the CTM, each of the isotopic species is run to an annu-ally repeating steady state using an arbitrary lower bound-ary condition of 310 nmol/mol. The isotopic composition of 14N15NO,15N14NO, and 15N15NO relative to the mean tropospheric abundance is easily calculated from their abun-dances relative to that of14N14NO. In a comparison with ob-servations, the modelled delta values must be shifted by the value of the bulk troposphere (in essence, the model tropo-sphere has a delta value of 0‰). Using atmospheric N2as a reference material, typical troposphericδ values have been found to be 30‰ for14N15N16O and−16‰ for15N14N16O by Kaiser et al. (2003d) or 16‰ for14N15N16O and−2‰ for15N14N16O by Yoshida and Toyoda (2000). This discrep-ancy, likely connected to calibration, is yet to be resolved.
The resultant model delta values are evaluated through a comparison with observed (apparent) stratospheric fraction-ation constants. These are derived assuming a Rayleigh dis-tillation process (Johnson et al., 2002):
ln(1+δ)=ln(1+δ0)+εapplnf, (5)
where f is the ratio of stratospheric to tropospheric
14N14N16O mixing ratios andδ=R/R
0−1 is the isotopic com-position (or delta value) and denotes the heavy-to-light iso-tope ratio (R)of a given isotopomer relative to some standard (R0). Comparisons of model apparent stratospheric frac-tionation constants (εapp)are made with five in-situ datasets
(Park et al. 2004; Rahn and Wahlen, 1997; R¨ockmann et al., 2001; Toyoda et al., 2001b; Yoshida and Toyoda, 2000) and one remotely sensed dataset (Griffith et al., 2000, personal communication, 2002). Stratospheric fractionation constants (εapp)were derived by fitting the enrichment data
to Eq. (5). Each of these datasets, where necessary, has been re-evaluated so that the fractionation constant has been cal-culated using Eq. (5), as opposed to commonly used approx-imations (Kaiser, 2002). Also, separate constants have been derived for the lower stratosphere, LS (−ln f>0.6) and mid-dle stratosphere, MS (−ln f<0.6). This type of comparison has the advantage over a direct comparison of δ in that a somewhat arbitrary tropospheric offset does not need to be applied to the model data and the measuredεapp will have
a higher signal to noise ratio than individual δ values. A least squares fit forεapp is performed restricting the model
values used to the month, latitude and [N2O] range of the observations. The observations used in this comparison are summarised in Table 5.
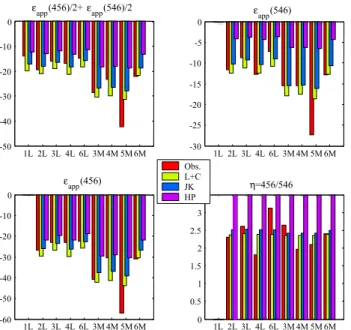
The model-observation comparisons are presented in Fig. 6. Shown are CTM results based on the photolysis frac-tionation constants of this work and the Hermite Propaga-tion model (Johnson et al., 2001) as shown in McLinden et al. (2003) but using O(1D) fractionation factors from Kaiser et al. (2002a). Also included is a CTM simulation using the linear wavelength and temperature parameterisations of the fractionation constants (Kaiser et al., 2002b, 2003c) which were derived from a collection of experimental data. These individual expressions were combined and the following pa-rameterisation resulted:
1L 2L 3L 4L 6L 3M 4M 5M 6M -50
-40 -30 -20 -10 0
εapp(456)/2+εapp(546)/2
1L 2L 3L 4L 6L 3M 4M 5M 6M -30
-25 -20 -15 -10 -5 0
εapp(546)
1L 2L 3L 4L 6L 3M 4M 5M 6M -60
-50 -40 -30 -20 -10 0
εapp(456)
1L 2L 3L 4L 6L 3M 4M 5M 6M 0
0.5 1 1.5 2 2.5 3 3.5
η=456/546 Obs.
L+C JK HP
η
Fig. 6. Comparison of model derived stratospheric fractionation
constantsεapp (assuming a Rayleigh fractionation process) with
observations in ‰. 456=14N15NO, 546=15N14NO. Bottom right panel comparesη, the [14N15NO]:[15N14NO] ratio (a y-axis limit of 3.5 was used to highlight Obs., L+C, and JK values; HP values vary from 4.9 to 5.1). Numbers on x-axis indicate the source of the observations as given in Table 5 (L = lower stratosphere, M = middle stratosphere). (L+C = Lund + Copenhagen data (this work); JK = parameterisation from Kaiser et al. (2002b, 2003c); HP = Her-mite Propagator photolysis model (Johnson et al., 2001) updated with recent O(1D) fractionation data (Kaiser et al., 2002a).)
each model and the observations are shown in Fig. 7. The last panel shows the root-mean-square (RMS) differences for each model over all comparisons.
Overall the comparison between the combined Lund/Copenhagen (L+C in Figs. 6 and 7) modelled apparent fractionation constants (Fig. 7) and the observations is very good: root-mean-square (RMS) differences are about 3 to 7‰. There does appear to be a slight bias in both14N15NO and 15N14NO as the L+C values were generally smaller (more negative) than the observations. The comparison with the Kaiser et al. (JK in Figs. 6 and 7) parameterisations is comparable with no obvious bias. Also shown are the HP model results. (Note that the overall impact of the new O(1D) fractionation constants on the apparent fractionation is small, <0.4‰.) This model systematically under pre-dicts the apparent fractionation constants, particularly for 15N14NO as discussed in McLinden et al. (2003) although we note that for14N14N18O, not considered in this study, the agreement between the HP model with observations is much better.
Results from the Caltech/JPL two-dimensional model which employs a semi-analytical photolysis model based on the Born-Oppenheimer approximation (Blake et al., 2003;
1L 2L 3L 4L 6L 3M 4M 5M 6M -10
0 10 20 30
εapp(456)/2+εapp(546)/2
1L 2L 3L 4L 6L 3M 4M 5M 6M -5
0 5 10 15 20 25
εapp(546)
1L 2L 3L 4L 6L 3M 4M 5M 6M -20
-10 0 10 20 30
εapp(456)
15N 546 456
0 2 4 6 8 10 12
RMS Differences L+C - Obs.
JK - Obs. HP - Obs.
Fig. 7.Differences between model-derived stratospheric
fractiona-tion constantsεapp (assuming a Rayleigh distillation process) and
observations (model-observation) in ‰. The bottom right panel shows the RMS (root mean square) differences over all data sources. Number on x-axis indicate the source of the observations as given in Table 5 (L = lower stratosphere, M = middle stratosphere). (L+C = Lund + Copenhagen data, this work; JK = parameterisation from Kaiser et al. (2002b, 2003c); HP = Hermite Propagator photolysis model (Johnson et al., 2001) updated with recent O(1D) fractiona-tion data.)
Morgan et al., 2004) also appear to be in good agreement with these model results. The good agreement between the L+C (and JK) modelled apparent fractionation factors (RMS differences of 3–7‰) with the observed values strongly sug-gests there are no unconventional processes involved in frac-tionating stratospheric N2O.
The expanded wavelength coverage of these measure-ments spans the entire range important for atmospheric pho-tolysis and confirms there are no anomalous spectral enrich-ment features and that the fractionation constant becomes more negative with increasing wavelength, as predicted by theory.
Using the global, annual chemical loss from the model budgets, the annual mean stratospheric loss fractionation constants can be calculated: −26.1/−11.1‰ (456/546) for the model using the L+C photolysis data and−22.9/−9.1‰ for the JK model and−19.0/−4.2 for the HP model.
Table 5.Source of data and relevant parameters for model-observation comparisons of stratospheric fractionation constants. Original data has been re-analysed by Kaiser (2002) using Eq. (5) and calculating separate lower stratosphere (LS) and middle stratosphere (MS) apparent fractionation constants with−ln f=0.6 (about 175 nmol/mol) as the border.
# Source Minimum N2O (nmol/mol) Regions Analysed Latitude Time of Year Original Reference
1 WB-57 Aircraft 180 LS 33–68◦N January–March Rahn and Wahlen (1997)a
2 Balloon Sample 160 LS 40◦N September Yoshida and Toyoda (2000)c
3 Balloon Sample 10 LS, MS 39◦N May Toyoda et al. (2001b)
4 Balloon Sample 6 LS, MS 18–69◦N R¨ockmann et al. (2001)
5 Balloon Occ. 5 MS 34–68◦N April–September Griffith et al. (2000)b
6 ER-2 Aircraft 6 LS, MSc 18–69◦N January–September Park et al. (2004)
a 15N measured only
bUpdated data from Griffith, personal communication (2002)(see McLinden et al., 2003) cUses 200 nmol/mol (−ln f≈0.45) as the diving line between lower and middle stratosphere
data set the estimated trend is−0.035‰/a and the estimate using the L+C data set gives a trend of−0.012‰/a – all of these values with large uncertainties. These may be com-pared to the recent analysis of Antarctic firn air showing a trend of−0.041‰/a (R¨ockmann et al., 2003). The trends have a significant uncertainty. In addition, the budget of McLinden et al. does not employ the most recent results regarding isotope distributions in the various source terms. Nonetheless, we report these results in order to show the ef-fect of the new laboratory data.
5 Discussion
Nitrous oxide is an important test system for developing the-ories of the effect of isotopic substitution on the photolysis cross section of small molecules. It has been known for a long time that electronic excitation spectra change with iso-topic substitution, since this will change the position of the rovibrational levels in the ground and excited states. The change in the excited state rovibrational levels is especially important for predissociative spectra and/or systems in which the excited state has a long enough lifetime to result in a structured absorption (Herzberg, 1950). In their 1997 paper, Yung and Miller described a method for estimating the effect of isotopic substitution on the position (energy) of the elec-tronic absorption band in a system with a repulsive excited state. They observed that, due to the Born-Oppenheimer approximation, the excited state potential will be the same for the various isotopically distinct systems, but that slightly different vertical excitation energies will arise from the sys-tem’s different zero point vibrational energies (ZPE). Thus the absorption spectra of for example a heavy isotopologue would be blue shifted by an amount of energy corresponding to the shift in the ZPE of the heavy isotopologue relative to the isotopically unsubstituted species. This model predicted that heavy isotopic species of nitrous oxide would be pho-tolysed more slowly in the stratospheric UV window than the light parent species14N14NO, potentially balancing the
isotopic budget and confirming the observation of Kim and Craig (1993).
Subsequent experiments showed isotopic fractionation constants twice as large as predicted by the ZPE theory. Therefore, a study was undertaken using the Hermite Prop-agator (HP) method to examine factors not included in the ZPE theory, for example the degree of bending excitation in the ground state molecule, and the role of dynamics on the upper state potential energy surface (Johnson et al., 2001). The nitrous oxide molecule has a linear equilibrium geome-try. All but about 3% of the transition intensity in the first UV system of NNO results from a transition11←16+, that
is forbidden since it involves a change in angular momentum quantum number of two, while a photon only carries a sin-gle unit of angular momentum. However, the symmetry of the transition changes to 21A′←X11A′ when the molecule bends, resulting in a weakly allowed transition. Even in the lowest bending vibrational state nitrous oxide bends, due to half a quantum of bending vibrational ‘zero point’ excita-tion. But, the transition intensity increases with bending vibrational excitation; the ground, first and second excited bending states have an intensity ratio of ca. 1 : 3 : 6 (John-son et al., 2001). Thus the population in the excited bend-ing states makes a significant contribution to the absorption cross-section. The hot bands are especially important to the low energy side of the transition maximum, and result in a relatively large temperature dependence of the absorption cross section in the region of the stratospheric UV window (ca. 200 to 210 nm; Minschwaner et al., 1993). The relative population of the excited bending states is given by the fa-miliar Boltzmann expression:
nνi
P
i
nνi
= e
−giβεi
P
j
e−gjβεj, (7)
whereβ=1/kT,εi is the energy (ε=h cν)¯ andgkis the
While nitrous oxide is not the only molecule that has a ‘forbidden’ transition that becomes allowed due to vibronic interaction (examples include the isoelectronic CO2 and OCS), it is not uncommon to assume that the transition dipole moment does not change very much with the nuclear coordi-nates of a molecule. This approximation is used for exam-ple when Franck-Condon factors are calculated. Brown et al. (1999) have calculated the transition dipole surface for N2O and find that it slopes upward from a minimum for a linear geometry. Since isotopically lighter systems will have a slightly larger bending vibrational amplitude than heavy systems (they sit higher in energy in the potential well), they will also have a larger cross section. So, while the ZPE the-ory predicts a shift along the energy scale, a consideration of the transition dipole surface demands, in addition, a shift in the absorption intensity scale. The ZPE theory predicts that a plot of the fractionation constant versus wavelength will pass through zero at the position of the absorption maximum, about 182 nm for N2O. However the plots of the fractionation constants for 14N15NO and15N15NO always remain nega-tive, at 283 K (Figs. 3a and c) and 233 K (Figs. 4a and c). In contrast,ε(15N14NO) becomes positive forλshorter than ca. 186 nm (Fig. 3b) and 188 nm (Fig. 4b). This dynamical effect, predicted by the HP theory is discussed below.
As discussed, the amplitude of bending vibration is smaller for heavier systems, resulting in a smaller cross sec-tion. This effect will increase as the number of bending vi-brational quanta increases. In addition, there is an interest-ing, simultaneous interaction with the Boltzmann population of the excited levels (Eq. 7). On the low energy side of the absorption maximum (i.e. most of the spectral region cov-ered by this work), heavy isotopic species have a lower ab-sorption cross section and thus a negative fractionation con-stant. Heavy systems also have slower vibrational frequen-cies, and thus a greater fraction of the heavy systems are in vibrationally excited states at a given temperature. As tem-perature decreases, there is a larger relative decrease in the population in excited vibrational states (which have a higher intrinsic cross section) for heavy systems than for light. The direction of the Boltzmann/statistical mechanics effect on the cross section is thus opposite to the trend of heavy isotopic species having a smaller cross section than light species for a given number of quanta of bending excitation. Overall, more negative (and larger in magnitude) fractionation con-stants are observed for heavy isotopic systems as temperature decreases in the hot band region. This may be seen by com-paring Figs. 3a and 4a for14N15NO, 3b and 4b for15N14NO 546 and 3c and 4c for15N15NO.
The absorption cross section of a given molecule may be calculated using Heller’s equation
σ (ω)=Cω
∞
Z
−∞
dt exp(i E t /h)¯ hφ0|exp(− i
¯
hH t )|φ0i, (8) (Heller, 1978). This states that the cross section depends on
the (Fourier transform with respect to energy of the) correla-tion funccorrela-tion between the original system wavefunccorrela-tion and the time-propagated wavefunction on the excited state poten-tial energy surface (hφ0|exp(−i
¯
hH t )|φ0i). A system which
falls apart quickly after photoexcitation will have a smaller absorption cross section than one which has a higher corre-lation to the original vibrational wavefunction. One of the unique features of the photolysis of nitrous oxide is that the N2fragment is produced with virtually no vibrational exci-tation (Hanisco and Kummel, 1993; Neyer et al., 1999a, b). Thus all of the transition energy is ultimately partitioned be-tween electronic energy of the O(1D) fragment, rotation of the N2 fragment and translational motion. The amount of rotational excitation is extreme; the rotational distribution of the N2fragment peaks at over 80 quanta, corresponding to about 1.4 eV of energy. If there were a dynamical effect on the cross section, one would expect it to produce a simul-taneous change in the cross section and the partitioning of energy between rotation and translation. The change in zero point energy of14N15N16O is 39 cm−1, and for15N14N16O, 22 cm−1(frequencies may be found in Johnson et al., 2001). Thus the ZPE theory predicts that the fractionation constant for15N14NO should be about 22/39=56% that of14N15NO. Inspection of Figs. 3b and 4b and analysis of the data in Ta-bles 2 and 3 shows that instead of being greater than half, the fractionation constant of 15N14NO is less than half of that of 14N15NO (less than 46%, to be precise) for wave-lengths shorter than 210 nm, at 233 and 283 K. This means that the absorption cross-section of15N14NO is anomalously high (or that of 14N15NO is anomalously low), relative to 14N
6 Conclusions
Wavelength dependent fractionation constants for14N15NO, 15N14NO and 15N15NO were obtained for the wavelength range 181–218 nm at 233 and 283 K on basis of UV spec-troscopy. The first comprehensive low temperature labora-tory dataset on photodissociative isotopic fractionation of ni-trous oxide is now available. The new data were used as input to a three dimensional general chemistry-transport model and the modelled stratospheric enrichment in isotopically heavy nitrous oxide was compared to stratospheric measurements showing a very good agreement. The standard model for atmospheric chemistry thus seems to be completely in line with experimental data; no unconventional sources of strato-spheric nitrous oxide are needed to explain the observed stratospheric isotope distribution of15N in N2O.
The distribution of15N in atmospheric nitrous oxide is not statistical, but a function of the vagaries of this trace gas’ bio-logical sources and the linked photochemical/transport sink. Much work remains in the area of understanding these pro-cesses, especially in the area of emission sources.
Acknowledgements. Thanks to:
– C. Brenninkmeijer and J. Crowley at the Max Planck Insti-tute for Chemistry, Mainz, Germany for providing gas samples of14N15NO,15N14NO and15N2O and the temperature con-trolled gas cell
– the staff at MAX-lab for extensive on-site support
– G. Somesfalean from the Physics Department of Lund Univer-sity for providing us with a lock-in amplifier
– For financial support: The Danish Natural Science Research Council, The Nordic Academy for Advanced Study (NorFA) and the Access to Research Infrastructure Programme of the EU
– S. Betak for transportation of equipment
– F. Nicolaisen and K. Feilberg for providing us with pressure gauges and help with analysing FTIR spectra
– I. Trabjerg for the PMT housing and base
– A. von Hessberg for valuable discussions regarding the double beam design
Edited by: D. Lowe
References
Blake, G. A., Liang, M.-C., Morgan, C. G., and Yung, Y. L.: A Born-Oppenheimer photolysis model of N2O fractionation, Geophys. Res. Lett., 30(12), 1656, doi:10.1029/2003GL016932, 2003.
Brown, A., Jimeno, P., and Balint-Kurti, G. G.: Photodissociation of N2O, Ab initio potential energy surfaces for the low lying elec-tronic states X1A′, 21A′, and 11A′′, J. Phys. Chem. A, 103, 11 089–11 095, 1999.
Crutzen, P. J.: The influence of nitrogen oxides on the atmospheric ozone content, Q. J. R. Meteorol. Soc., 96, 320–325, 1970.
DeMore, W. B., Sander, S. P., Golden, D. M., Hampson, R. F., Kurylo, M. J., Howard, C. J., Ravishankara, A. R., Kolb, C. E., and Molina, M. J.: Chemical kinetics and photochemical data for use in stratospheric modelling, JPL Publication, 97-4, 163–164, 1997.
Feilberg, K. L., Sellev˚ag, S. R., Nielsen, C. J., Griffith, D. W. T., and Johnson, M. S.: CO+OH−>CO2+H: The relative reaction rate of five CO isotopologues, Phys. Chem. Chem. Phys., 4(19), 4687–4693, 2002.
Griffith, D. W. T., Toon, G. C., Sen, B., Balvier, J.-F., and Toth, R. A.: Vertical profiles of nitrous oxide isotopomer fractiona-tion measured in the stratosphere, Geophys. Res. Lett., 27, 2485– 2488, 2000.
Hanisco, T. F. and Kummel, A. C.: State-resolved photodissociation of N2O, J. Phys. Chem., 97(28), 7242–7246, 1993.
Heller, E. J.: Quantum corrections to classical photo-dissociation models, J. Chem. Phys., 68(5), 2066–2075, 1978.
Herzberg, G.: Spectra of Diatomic Molecules, D. van Nostrand Company Inc., 1950.
Houghton, J. T., Ding, Y., Griggs, D. J., Noguer, M., van der Linden, P. J., Dai, X., Maskell, K., and Johnson, C. A.: Climate Change 2001: The Scientfic Basis, Cambridge University Press, 2001. Johnson, M. S., Billing, G. D., Gruodis, A., and Janssen, M. H.
M.: Photolysis of nitrous oxide isotopomers studied by time-dependent Hermite propagation, J. Phys. Chem. A, 105, 8672– 8680, 2001.
Johnson, M. S., Feilberg, K. L., von Hessberg, P., and Nielsen, O. J.: Isotopic processes in atmospheric chemistry, Chem. Soc. Rev., 31(6), 313–323, 2002.
Johnston, J. C., Cliff, S. S., and Thiemens, M. H.: Measurement of multioxygen isotopic (delta18O and delta17O) fractionation factors in the stratospheric sink reactions of nitrous oxide, J. Geo-phys. Res., 100(D8), 16 801–16 804, 1995.
Kaiser, J.: Stable isotope investigations of atmospheric nitrous ox-ide, Ph.D. Thesis, Johannes Gutenberg Universit¨at, Mainz, 2002. Kaiser, J., R¨ockmann, T., Br¨uhl, C., and Brenninkmeijer, C. A. M.: Isotopic enrichment in stratospheric N2O: 2-D model re-sults linked to laboratory measurements of N2O photochemistry, Geophys. Res. Abs., 3, 5784, 2001.
Kaiser, J., Brenninkmeijer, C. A. M., and R¨ockmann, T.: In-tramolecular15N and18O fractionation in the reaction of N2O with O(1D) and its implications for the stratospheric N2O iso-tope signature, J. Geophys. Res., 107(D14), 4214, 2002a. Kaiser, J., R¨ockmann, T., and Brenninkmeijer, C. A. M.:
Tem-perature dependence of isotope fractionation in N2O photolysis, Phys. Chem. Chem. Phys., 4(18), 4420–4430, 2002b.
Kaiser, J., R¨ockmann, T., and Brenninkmeijer, C. A. M.: Assessment of 15N15N16O as a tracer of stratospheric processes, Geophys. Res. Lett., 30(2), Art. no. 1046, doi:10.1029/2002GL016253, 2003a.
Kaiser, J., R¨ockmann, T., and Brenninkmeijer, C. A. M.: Complete and accurate mass spectrometric isotope analysis of tropospheric nitrous oxide, J. Geophys. Res., 108(D15), 4476, 2003b. Kaiser, J., R¨ockmann, T., Brenninkmeijer, C. A. M., and Crutzen,
P. J.: Wavelength dependence of isotope fractionation in N2O photolysis, Atmos. Chem. Phys., 3, 303–313, 2003c.
distri-bution in nitrous oxide, Anal. Bioanal. Chem., 378(2), 256–269, 2003d.
Kim, K.-R. and Craig, H.: Nitrogen-15 and oxygen-18 characteris-tics of nitrous oxide: A global perspective, Science, 262, 1855– 1857, 1993.
McElroy, M. B. and Jones, D. B. A.: Evidence for an additional source of atmospheric N2O, Global Biogeochemical Cycles, 10(1), 651–659, 1996.
McLinden, C. A., Olsen, S., Hannegan, B., Wild, O., Prather, M. J., and Sundet, J.: Stratospheric ozone in 3-D models: A simple chemistry and the cross-tropopause flux, J. Geophys. Res., 105, 14 653–14 665, 2000.
McLinden, C. A., Prather, M. J., and Johnson, M. S.: Global mod-eling of the isotopic analogues of N2O: Stratospheric distribu-tions, budgets, and the17O-18O mass-independent anomaly, J. Geophys. Res., 108(D8), 4233, 2003.
Merienne, M. F., Coquart, B., and Jenouvrier, A.: Temperature ef-fect on the ultraviolet absorption of CFCl3, CFCl2 and N2O, Planet. Space Sci., 38(5), 617–625, 1990.
Miller, C. E. and Yung, Y. L.: Photo-induced isotopic fractionation of stratospheric N2O, Chemosphere, 2, 255–266, 2000. Minschwaner, K., Salawitch, R. J., and McElroy, M. B.: Absorption
of solar radiation by O2– implications for O3and lifetimes of N2O, CFCl3, and CF2Cl2, J. Geophys. Res. A, 98(D6), 10 543– 10 561, 1993.
Morgan, G. C., Allen, M., Liang, M. C., Shia, R. L., Blake, G. A., and Yung, Y. L.: Isotopic fractionation of nitrous oxide in the stratosphere: Comparison between model and observations, J. Geophys. Res., 109(D4), D04305, doi:10.1029/2003JD003402, 2004.
Nanbu, S. and Johnson, M. S.: Analysis of the ultraviolet absorp-tion cross secabsorp-tions of six nitrous oxide isotopomers using 3D wavepacket propagation, J. Phys. Chem. A, in press, 2004. Neyer, D. W., Heck, A. J. R., and Chandler, D. W.:
Photodissoci-ation of N2O: J-dependent anisotropy revealed in N2 photofrag-ment images, J. Chem. Phys., 110(2), 3411–3417, 1999a. Neyer, D. W., Heck, A. J. R., and Chandler, D. W.:
Speed-dependent alignment and angular distributions of O(1D2) from the ultraviolet photodissociation of N2O, J. Phys. Chem. A, 103(49), 10 388–10 397, 1999b.
Olsen, S., McLinden, C. A., and Prather, M. J.: Stratospheric N2 O-NOysystem: Testing uncertainties in a 3-D framework, J. Geo-phys. Res., 106(28), 28 771–28 784, 2001.
Park, S., Atlas, E. L., and Boering, K. A.: Measurements of N2O isotopologues in the stratosphere: Influence of transport on the apparent enrichment factors and the isotopologue fluxes to the troposphere, J. Geophys. Res., 109, D01305, 2004.
Prasad, S. S.: Potential atmospheric sources and sinks of nitrous oxide 2. Possibilities from excited O2, “embryonic” O3, and op-tically pumped excited O3, J. Geophys. Res., 102(D17), 21 527– 21 536, 1997.
Rahn, T. and Wahlen, M.: Stable isotope enrichment in strato-spheric nitrous oxide, Science, 278, 1776–1778, 1997.
Rahn, T., Zhang, H., Wahlen, M., and Blake, G. A.: Stable iso-tope fractionation during ultraviolet photolysis of N2O, Geo-phys. Res. Lett., 25(24), 4489–4492, 1998.
Rind, D., Suozzo, R., Balachandran, N. K., Lacis, A., and Russell, G.: The GISS global climate/middle atmosphere model, I. Model structure and climatology, J. Atmos. Sci., 45, 329–370, 1988.
Rothman, L. S., Barbe, A., Benner, D. C., et al.: The HITRAN molecular spectroscopic database: edition of 2000 including up-dates through 2001, J. Quant. Spectrosc. Radiat. Transfer, 82(1-4), 5–44, 2003.
R¨ockmann, T., Brenninkmeijer, C. A. M., Wollenhaupt, M., Crow-ley, J. N., and Crutzen, P. J.: Measurement of the isotopic frac-tionation of15N14N16O,14N15N16O and14N14N18O in the UV photolysis of nitrous oxide, Geophys. Res. Lett., 27(9), 1399– 1402, 2000.
R¨ockmann, T., Kaiser, J., Brenninkmeijer, C. A. M., Crowley, J. N., Borchers, R., Brand, W. A., and Crutzen, P. J.: Isotopic enrich-ment of nitrous oxide (15N14NO,14N15NO,14N14N18O) in the stratosphere and in the laboratory, J. Geophys. Res., 106(D10), 10 403–10 410, 2001.
R¨ockmann, T., Kaiser, J., Brenninkmeijer, and C. A. M.: The iso-topic fingerprint of the pre-industrial and the anthropogenic N2O source, Atmos. Chem. Phys., 3, 315–323, 2003.
Sander, S. P., Friedl, R. R., DeMore, W. B., Golden, D. M., Kurylo, M. J., Hampson, R. F., Huie, R. E., Moortgat, G. K., Ravis-hankara, A. R., Kolb, C. E. and Molina, M. J.: Chemical ki-netics and photochemical data for use in stratospheric modeling, in Evaluation 13, JPL Publication, Pasadena, California, 00–003, 2000.
Selwyn, G. S. and Johnston, H. S.: Ultraviolet absorption spectrum of nitrous oxide as function of temperature and isotopic substitu-tion, J. Chem. Phys., 74(2), 3791–3803, 1981.
Selwyn, G., Podolske, J., and Johnston, H. S.: Nitrous oxide ultravi-olet absorption spectrum at stratospheric temperatures, Geophys. Res. Lett., 4(10), 427–430, 1977.
Sorensen, S. L., Olsson, B. J., Huldt, S., Johansson, S.-E., K¨allne, E., Nilsson, A. E., Hutton, R., Litz´en, U., and Svensson, A.: A normal-incidence beam line at the MAX storage ring, Nuclear Instruments and Methods in Physics Research, A297, 296–300, 1990.
Toyoda, S., Yoshida, N., Suzuki, T., Tsuji, K., and Shibuya, K.: Iso-topomer fractionation during photolysis of nitrous oxide by ul-traviolet light of 206 nm to 210 nm, International Conference on the Study of Environmental Change using Isotope Techniques, edited by IAEA, International Atomic Energy Agency, Vienna, Austria, 2001a.
Toyoda, S., Yoshida, N., Urabe, T., Aoki, S., Nakazawa, T., Sug-awara, S., and Honda, H.: Fractionation of N2O isotopomers in the stratosphere, J. Geophys. Res., 106(D7), 7515–7522, 2001b. Turatti, F., Griffith, D. W. T., Wilson, S. R., Esler, M. B., Rahn, T., Zhang, H., and Blake, G. A.: Positionally dependent 15N fractionation factors in the UV photolysis of N2O determined by high resolution FTIR spectroscopy, Geophys. Res. Lett., 27(16), 2489–2492, 2000.
Umemoto, H.:14N/15N isotope effect in the UV photodissociation of N2O, Chem. Phys. Lett., 314(3-4), 267–272, 1999.
Yoshida, N. and Matsuo, S.: Nitrogen isotope ratio of atmospheric N2O as a key to global cycle of N2O, Geochemical Journal, 17, 231–239, 1983.
Yoshida, N. and Toyoda, S.: Constraining the atmospheric N2O budget from intramolecular site preference in N2O isotopomers, Nature, 405, 330–334, 2000.
71(28), 933–934, 1990.
Yoshino, K., Freeman, D. E., and Parkinson, W. H.: High-resolution absorption cross-section measurements of N2O at 295 K–299 K in the wavelength region 170–222 nm, Planet. Space Sci., 32(10), 1219–1222, 1984.
Yoshino, K., Esmond, J. R., and Parkinson, W. H.: High-resolution absorption cross section measurements of NO2 in the UV and visible region, Chem. Phys., 221, 169–174, 1997.
Yung, Y. L. and Miller, C. E.: Isotopic fractionation of stratospheric nitrous oxide, Science, 278, 1778–1780, 1997.
Yung, Y. L., Wang, W. C., and Lacis, A. A.: Greenhouse effects due to atmospheric nitrous oxide, Geophys. Res. Lett., 3, 619–621, 1976.
Zhang, H., Wennberg, P. O., Wu, V. H., and Blake, G. A.: Frac-tionation of14N15N16O and 15N14N16O during photolysis at 213 nm, Geophys. Res. Lett., 27(16), 2481–2484, 2000. Zipf, E. C. and Prasad, S. S.: Experimental evidence that excited