151
Radiol Bras. 2011 Mai/Jun;44(3):151–155
Transfusional iron overload in patients with sickle cell
anemia: comparison between magnetic resonance imaging
and serum ferritin
*
Sobrecarga de ferro transfusional em portadores de anemia falciforme: comparação entre ressonância magnética e ferritina sérica
Lécio dos Anjos Bourbon Filho1, Thiago de Oliveira Ferrão2, Alex Vianey Callado França3, Ricardo Dantas Rocha1, Lorena Dias Dantas1, Luciana Franco do Prado Carvalho1, Marcella Dornelas de Abreu Batalha Moreira1, Rosana Cipolotti4
Objective: To identify predictive variables of iron overload in patients with sickle cell anemia, correlating biochemical and imaging markers. Materials and Methods: The authors developed a cross-sectional study involving 32 patients with sickle cell anemia who were evaluated for ferritin and iron serum levels and submitted to liver magnetic resonance imaging with one spin-echo and five gradient-echo sequences. The signal intensity was obtained at each sequence, corresponding to the arithmetical mean of the measurements on regions of interest in the liver and paraspinal muscles to obtain the liver/muscle signal intensity ratio (SIR). Based on such SIR, the liver iron concentration (LIC) was estimated by means of the following formula: e[5.808 – (0.877 × T2*) – (1.518 × IW)], where T2* is the SIR on the sequence with echo time
= 13 ms and IW is the SIR on the intermediate-weighted sequence. Patients were grouped according to their blood transfusion regimen (regular monthly versus sporadic transfusions). Results: The comparison between the transfusion groups was based on clinical-laboratory variables, with significant differences in SIR, LIC and serum ferritin levels: the group with regular transfusions demonstrated greater hepatic iron overload. Conclusion: Magnetic resonance imaging is an efficient tool for evaluating liver iron overload in patients with sickle cell anemia.
Keywords: Sickle cell anemia; Magnetic resonance imaging; Ferritin.
Objetivo: Identificar variáveis preditoras de sobrecarga de ferro em portadores de anemia falciforme e correlacionar indicadores bioquímicos e imaginológicos. Materiais e Métodos: Foi realizado estudo transversal envolvendo 32 portadores de anemia falciforme, que foram submetidos a dosagem sérica de ferro, ferritina e a ressonância magné-tica do fígado. Foram realizadas cinco sequências gradiente-eco e uma spin-eco. A intensidade de sinal foi obtida em cada sequência pelas médias das regiões de interesse no fígado e musculatura paravertebral para obter a razão da intensidade de sinal (RIS) fígado/músculo. A partir da RIS foi obtida a concentração hepática estimada de ferro (CHEF) pela fórmula: e[5,808 – (0,877 × T2*) – (1,518 × PI)], onde T2* é a RIS na sequência com TE de 13 ms e PI é a RIS da sequência
com ponderação intermediária. Os pacientes foram agrupados segundo o regime de transfusão de hemácias (regula-res mensais versus esporádicas). Resultados: Os grupos transfusionais foram comparados pelas variáveis clínico-laboratoriais, sendo significativas as diferenças entre RIS, CHEF e ferritina sérica: o grupo que recebeu transfusões regulares apresentou sobrecarga de ferro hepático mais intensa. Conclusão: A ressonância magnética foi ferramenta eficiente para avaliação de sobrecarga hepática de ferro em portadores de anemia falciforme.
Unitermos: Anemia falciforme; Imagem por ressonância magnética; Ferritina.
Abstract
Resumo
* Study developed at Universidade Federal de Sergipe (UFS), Aracaju, SE, Brazil.
1. MDs, Universidade Federal de Sergipe (UFS), Aracaju, SE, Brazil.
2. Master in Health Sciences, MD, Radiologist, Assistant Pro-fessor at Department of Medicine, Universidade Federal de Ser-gipe (UFS), Aracaju, SE, Brazil.
3. PhD, Titular Professor, Head of Department of Medicine, Universidade Federal de Sergipe (UFS), Aracaju, SE, Brazil.
4. PhD, Associate Professor, Department of Medicine, Univer-sidade Federal de Sergipe (UFS), Aracaju, SE, Brazil.
Mailing Address: Dra. Rosana Cipolotti. Avenida Beira Mar,
Bourbon Filho LA, Ferrão TO, França AVC, Rocha RD, Dantas LD, Carvalho LFP, Moreira MDAB, Cipolotti R. Transfusional iron overload in patients with sickle cell anemia: comparison between magnetic resonance imaging and serum ferritin. Radiol Bras. 2011 Mai/Jun; 44(3):151–155.
INTRODUCTION
In the setting of acute complications of sickle cell anemia (SCA), the decrease in hemoglobin levels may precipitate a
cardio-pulmonary function decompensa-tion, so erythrocytes transfusion become a therapeutic resource of great importance(1).
With the frequent long term utilization of such resource, some complications such as iron overload may occur(2), as there is no
active excretory mechanism for this micro-nutrient. Main manifestations of advanced iron overload include dysfunction of
or-2016, ap. 402, Jardins. Aracaju, SE, Brazil, 49025-040.E-mail: [email protected]
gans such as the liver, heart and endocrine organs.
There are direct and indirect methods to estimate body iron levels(3). Serum ferritin
test is the most available method and is easily reproducible, in spite of not provid-ing a good specificity(3). Hepatic biopsy, in
spite of being validated as a reference stan-dard, is an invasive method and, therefore, involves risks inherent to the procedure(4).
For these reasons, the possibility of replac-ing such a procedure by a noninvasive im-aging method, in this case magnetic reso-nance imaging (MRI), is discussed(5).
Several studies have described the uti-lization of MRI in the quantification of hepatic iron content, with variable results among them(5–9). Iron overload causes a
decrease in the signal intensity of the he-patic parenchyma and the measurement of such an overload is possible since there is a correlation between the magnitude of sig-nal reduction and the degree of iron ex-cess(8).
The present study is aimed at estimat-ing the liver iron concentration by means of MRI in patients with SCA, and correlat-ing iron overload biochemical and imagcorrelat-ing markers in two different transfusion regi-mens.
MATERIALS AND METHODS
A cross-sectional study was developed with SCA patients regularly followed-up at a reference outpatient clinic in the state of Sergipe, Northeastern region of Brazil. In this region, there is a high prevalence of the hemoglobin S gene because of the ethnic composition of the population(10). For the
purposes of the present study, eligible pa-tients were those with SCA confirmed by means of hemoglobin electrophoresis and had already undergone blood transfusion. Patients with chronic hepatic disease not related to SCA were excluded.
Thirty-two patients were sequentially selected and divided into two groups: the first group comprised patients undergoing sporadic blood transfusions due to compli-cations (SG), and the second group, com-prising patients undergoing regular blood transfusions (RG): 10 to 20 ml/kg admin-istered monthly because their history of cerebrovascular accident.
All the patients underwent clinical ex-amination, laboratory tests (serum ferritin, serum iron, aminotransferase test and blood count) and MRI. Upper abdomen MRI scans were performed in a 1.5T Magnetom Avanto (Siemens; Munich, Germany) apparatus, without the use of contrast medium or sedation.
The parameters utilized for the se-quences acquisition were based on the pro-tocol proposed by Alústiza et al.(8). The
technique comprised five breath-hold GRE sequences (20 sections each), and one TSE trigger sequence (with respiratory synchro-nization and 35 sections), whose details are described on Table 1.
All the images were analyzed by a single experienced and duly trained radi-ologist. The regions of interest (ROIs), measuring at least 1 cm2, were positioned on three areas of the right hepatic lobe for measurement of the signal intensity and on two areas of the paravertebral musculature, one at right and the other at left, distant from the lung bases, hepatic vessels and from heterogeneous areas, in order to avoid artifacts. The arithmetic means of the three hepatic measurements and two muscular measurements were obtained, and the ratio between means was calculated, corre-sponding to the signal intensity ratio (SIR). The SIR was utilized, instead of the signal intensity in the liver alone, as the SIR con-siders the usual decrease in signal intensity that normally occurs as the echo time elapses, and because of the need for a ref-erence tissue, the paravertebral muscula-ture, that usually does not undergo iron deposition. Based on the SIR, the estimated hepatic iron concentration (EHIC) was obtained by means of the formula:
e[5.808 – (0.877 × T2*) – (1.518 × PI)]
where T2* is the SIR obtained on the se-quence with TE = 14 ms, and PI is the SIR of the intermediate-weighted sequence.
A previous study indicates that such formula shows excellent correlation be-tween SIR and hepatic iron concentration measured in hepatic tissue obtained by means of biopsy (r = 0.937)(8).
Means and standard deviations for quantitative variables and frequency distri-bution for proportional variables were uti-lized for data analysis. The patients were grouped according to two EHIC cut-off points and according to transfusional group (either SG or RG); the results were cross checked and compared with each other and between the groups. The groups compari-son was made by means of the chi-square or Fisher’s tests (proportional variables and discrete quantitative variables) and by means of the t test for independent samples or the Kruskal-Wallis test (continuous quantitative variables), considering 5% (p < 0.05) as significance level. The correla-tions between SIR and serum iron and se-rum ferritin levels were evaluated by means of the Pearson correlation coefficient (r).
The project of the present study was duly submitted and approved by the Com-mittee for Ethics in Research of the respon-sible institution (CAE 0013.0.107.000-09), and the consent of the patients or parents/ caregivers were expressed by means of the signature of a term of free and informed consent.
RESULTS
Thirty-two patients were submitted to MRI and had their serum ferritin levels measured. Among these patients, 23 (71.87%) were sporadically submitted to blood transfusion (SG).
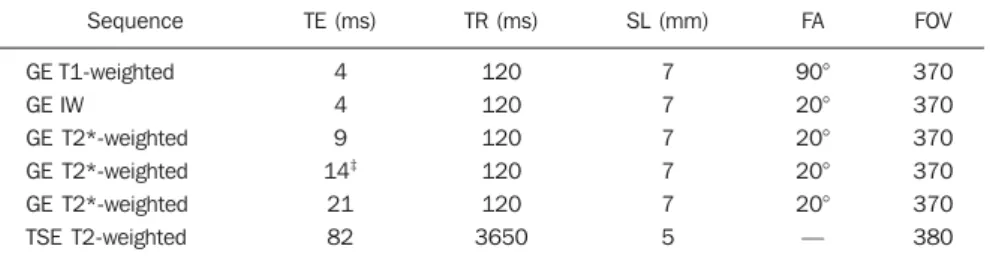
Table 1 MRI sequences parameters†. Sequence
GET1-weighted GE IW
GE T2*-weighted GE T2*-weighted GE T2*-weighted TSE T2-weighted
TE (ms) 4 4 9 14‡
21 82
TR (ms) 120 120 120 120 120 3650
SL (mm) 7 7 7 7 7 5
FA 90° 20° 20° 20° 20° —
FOV 370 370 370 370 370 380
†According to Alústiza et al.(8). ‡TE was modified from 14 ms to 13 ms, considering results obtained in a
There was a subtle predominance of the male gender, with 19/32 patients (59.37%). The mean patients’ age was 14.21 ± 5.46 years. The mean serum ferritin value was 1,124.34 ± 644.26 µg/l, and serum iron value was 123.94 ± 45.12 µg/dl. The mean values for alanine transaminase and aspar-tate transaminase were 35.62 ± 27.82 U/l and 46.65 ± 23.12 U/l, respectively. The mean annual hemoglobin level was 8.20 ± 1.24 g/dl, and the total leukocyte count had a mean value of 12,009 ± 3,764/mm3 and platelets, 370,853 ± 134,101/mm3.
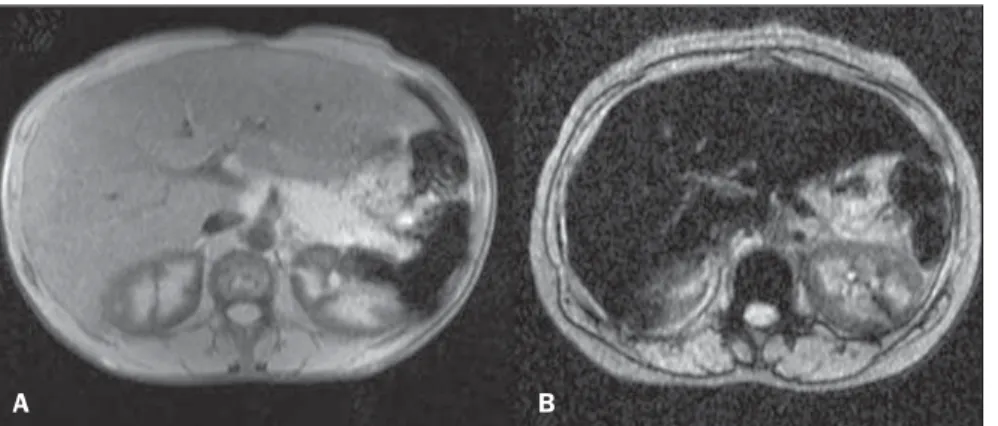
The patients were stratified according to iron overload (according to EHIC calcu-lated from the MRI results) at two cut-off points – 40 µmol/g and 80 µmol/g – and the clinical and laboratory predictors of iron overload were evaluated. Figure 1 shows liver MR images of a patient with EHIC of 20.7 µmol/g (A) and 262.2 µmol/g (B).
Serum ferritin levels presented a mean value 58% higher in the group with iron overload, as 40 µmol/g was utilized as cut-off point, and 50% higher as the cut-cut-off was 80 µmol/g, with statistically significant differences in both cases (p = 0.0001 and
Table 2 General patients’ characteristics according to estimated hepatic iron concentration, demon-strated with two cut-off points.
EHIC (µmol/g)
Age Male AST (U/l) ALT (U/l) Hb (g/dl) Leuko (/mm3)
Plat (/mm3)
Iron (µg/dl) Ferritin (µg/dl) SG
RG
> 40 14.42 63 (12/19)
45.94 39.31 8.41 12,257 400,015
121.20 1,477.49 52 (10/19)
48 (9/19)
< 40 13.9 38.4 (5/13)
47.21 29.50 7.90 11,932 329,678
127.73 608.20 100 (13/13)
0 (0/134) p
0.8229 0.1766 0.8734 0.4515 0.2280 0.3721 0.1451 0.6959 0.0001 0.0032
> 80 15.2 57 (8/14)
46.5 41.21
8.31 12,014 378,378 128.44 1,560.07 50 (7.14) 50 (7/14)
< 80 13.3 50 (9/18)
46.7 31.27
8.12 12,005 365,000 120.24 785.44 88.8 (16/18)
11.2 (2/18) p
0.3047 0.4681 0.9928 0.7812 0.5857 0.7947 0.7619 0.6203 0.0002 0.0234
EHIC, estimated hepatic iron concentration; AST, aspartate transaminase; ALT, alanine transaminase; Hb, annual mean hemoglobin; Leuko, annual mean leukogram; Plat, annual mean platelets; SG, sporadic transfusional group; RG, regular transfusional group.
Table 3 MRI sequences weighting and their relationship with two groups (serum ferritin and serum iron).
Signal intensity T1†
IW‡
T2* 9 ms§
T2* 13 ms§
T2* 21 ms§
Ferritin (µg/dl) Iron (µg/dl)
> 1.000 0.7233 0.6433 0.3795 0.2971 0.2024
< 1.000 1.2145 1.0818 0.9509 0.9009 0.7309
p
0.0017 0.0005 0.0002 0.0001 0.0002
> 500 0.7952 0.7036 0.4472 0.3556 0.2332
< 500 1.2386 1.1171 1.0357 1.0371 0.9229
p
0.0062 0.0014 0.0008 0.0001 0.0001
> 150 0.8729 0.7486 0.5729 0.4714 0.3386
< 150 0.9188 0.8025 0.5929 0.5304 0.4075
p
0.8082 0.7618 0.9111 0.7448 0.6752
†T1-weighted sequence; ‡intermediate weighted sequence; §gradient-echo sequences T2-weighted sequences with echo times of 9 ms, 13 ms and 21ms, respectively.
p = 0.0002, respectively). The “transfu-sional group” variable demonstrated to be predictive for overload, such an overload being greater in the group receiving regu-lar transfusions (p = 0.0032 and p = 0.0234, respectively, for the EHIC cut-off points at 40 µmol/g and 80 µmol/g). The other
vari-ables did not present statistical significance (Table 2).
The correlation between the means of signal intensity ratios obtained from MRI and serum ferritin levels results, utilizing two reference groups as parameter (1,000 mg/dl and 500 mg/dl), was calculated and
is shown on Table 3. It is observed that all the MRI sequences present lower signal intensity in the group with higher ferritin levels, for both cut-off points, a statistically significant result. Such a fact was not ob-served in cases where serum iron level was utilized as a reference.
The comparison of transfusional groups was based on the clinical and laboratory variables. The values that presented statis-tical difference were SIR of the MRIs, EHIC and serum ferritin level. The remain-ing clinical and laboratory variables did not present any statistically significant differ-ence (Table 4).
Figure 1. Abdominal MRI T2-weighted sequence* (TE = 13 ms). A: Patient with EHIC of 20.7 µmol/g. B: Patient with EHIC of 262.2 µmol/g. The noticeable difference in signal intensity between both livers is observed.
which are currently utilized for such pur-pose: serum ferritin test and MRI. The cut-off point for serum ferritin levels from which one can consider that tissue damage has already occurred is still to be deter-mined: certainly, in cases where the values are > 1.000 mg/dl, the damages to organs and tissues have already occurred and some authors defend that the utilization of chelat-ing agents be started at levels < 500 mg/ dl(3). In individuals with no risk factors for
iron overload, it is expected the EHIC are below 20 µmol/g. For those with chronic hemolytic anemia, tissue damage seems to occur between 40 µmol/g and 80 µmol/g(4,5).
According to a previous study, serum ferritin levels do not present good correla-tion with the hepatic iron concentracorrela-tion(11).
However, other sources indicate a linear correlation between serum ferritin levels and total estimated body iron by means of the evaluation of tissue iron concentration in liver biopsy specimen(3,9,12). However, it
is known that the quantification of serum ferritin may be influenced by a number of factors, such as gender, infections, hepato-pathies and cancer(3,13,14). For that reason,
its serial measurement is more accurate than the isolated measurement(13,14).
Angulo et al.(13) have not demonstrated
linear relationship between mean serum ferritin levels in four years and the EHIC obtained by MRI, a finding that is in agree-ment with the present study.
Based on the present results, it is pos-sible to observe that the only clinical and laboratory predictive variables for transfu-sion iron overload are serum ferritin levels and transfusional group, which is in agree-ment with reports in the literature(3,12).
Hepatic enzymes did not demonstrate to be a good iron overload indicator, which has already been previously observed(12). In the
present study, no other variable could be utilized as an iron overload predictor, in-dependently from the utilized cut-off point. It is important to highlight that the liver is the main iron storage organ, and the first to be injured, however the lesion of other organs, such as kidneys, pancreas, lungs, endocrine glands and heart, may decisively contribute to the death of patients with SCA(3,12,13,15,16).
The long term effects of chronic iron overload have been more extensively de-Figure 2. Correlation between EHIC and serum ferritin and iron levels. A: Correlation between serum
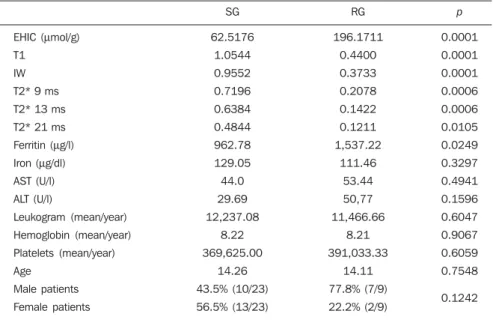
ferritin levels and EHIC (r = 0.44). B: Correlation between serum iron levels and EHIC (r = 0.01). Table 4 Comparison among individuals in the group undergoing sporadic transfusions and individuals in the group with regular transfusions, according to all the studied variables.
EHIC (µmol/g) T1
IW T2* 9 ms T2* 13 ms T2* 21 ms Ferritin (µg/l) Iron (µg/dl) AST (U/l) ALT (U/l)
Leukogram (mean/year) Hemoglobin (mean/year) Platelets (mean/year) Age
Male patients Female patients
SG 62.5176
1.0544 0.9552 0.7196 0.6384 0.4844 962.78 129.05 44.0 29.69 12,237.08
8.22 369,625.00
14.26 43.5% (10/23) 56.5% (13/23)
RG 196.1711
0.4400 0.3733 0.2078 0.1422 0.1211 1,537.22
111.46 53.44 50,77 11,466.66
8.21 391,033.33
14.11 77.8% (7/9) 22.2% (2/9)
p
0.0001 0.0001 0.0001 0.0006 0.0006 0.0105 0.0249 0.3297 0.4941 0.1596 0.6047 0.9067 0.6059 0.7548 0.1242
SG, sporadic transfusional group; RG, regular transfusional group; EHIC, estimated hepatic iron concentration; T1, signal intensity ratio (SIR) of T1-weighted sequence; IW, SIR of the intermediate weighted sequence; T2*, SIR of the gradient-echo sequences T2*-weighted with echo times of 9 ms, 13 ms and 21 ms, respectively; AST, aspartate transaminase; ALT, alanine transaminase.
Figure 2 represents the correlations be-tween EHIC and serum ferritin (A) and iron (B) levels. Serum ferritin levels did not present good linear correlation with EHIC, with a Pearson correlation coefficient equal to 0.44. The correlation with serum iron level was even worse than that of serum ferritin level (r = 0.01).
DISCUSSION
An accurate and reproducible method for detection, evaluation and stratification of transfusion iron overload is a very use-ful tool in the clinical follow-up of patients with hemolytic anemia. The present study compared, in SCA patients, two strategies
scribed in patients with thalassemia, and SCA particularities may not allow the simple transfer of findings, among them the persistent activation of the inflammatory response cascade, as it modifies the serum ferritin concentration. Thus, in SCA pa-tients, such variable is not a good indica-tor of iron overload in the organs. On the other hand, the serial imaging evaluation of a sentinel organ – the liver – may yield more reproducible data.
By comparing the iron-overload inten-sity between the patient groups submitted to two different transfusion regimens, it is possible to conclude that the group under-going regular transfusions is more subject to the overload complications as, on aver-age, such group presents three times the EHIC as compared with the group under-going sporadic transfusions. Such result is in agreement with data in the literature, as the number of transfusions is already a well established predictive factor for iron over-load(3,12). The other variables that are
pre-dictive of overload (signal intensity and serum ferritin levels) were also altered in that group. Therefore, the RG patients must be closely followed-up particularly for the diagnosis and treatment of transfusional iron overload.
The categorization of patients according to the transfusional profile and the confir-mation that the group under regular trans-fusions presents more consistent signs of hepatic iron overload is justified because indicates a group of patients as priority candidates for MRI evaluation as soon as they receive the indication and start receiv-ing regular transfusions. The periodicity of
such evaluation could not be determined in the present study, because of its cross-sec-tional characteristic. This is a limitation of the study, which for the same reason did not sequentially evaluate the serum ferritin concentration. In spite of such fact, the present study results indicate that the as-sessment of hepatic iron overload by means of MRI in SCA patients submitted to regu-lar erythrocyte transfusion may be useful to determining preemptive therapeutic inter-ventions based on the utilization of iron chelating agents, with a view on the pres-ervation of the functions of several organs and systems.
CONCLUSION
The EHIC obtained by means of MRI was efficient in the estimation of hepatic iron overload in SCA patients undergoing regular red blood cell transfusion regimen.
Acknowledgements
The authors wish to express their grati-tude to Centro de Medicina Integrada de Sergipe Ltda. (Cemise) for the collabora-tion in the performance of MRI studies.
REFERENCES
1. Naufel CCS, Braga JAP, Cançado RD, et al. Rea-ção transfusional hiper-hemolítica em pacientes portadores de anemia falciforme: relato de dois casos. Rev Bras Hematol Hemoter. 2002;24:292– 9.
2. Wayne AS, Schoenike SE, Pegelow CH. Finan-cial analysis of chronic transfusion for stroke pre-vention in sickle cell disease. Blood. 2000;96: 2369–72.
3. Kohgo Y, Ikuta K, Ohtake T, et al. Body iron me-tabolism and pathophysiology of iron overload. Int J Hematol. 2008;88:7–15.
4. Gürkan E, Ergun Y, Zorludemir S, et al. Liver in-volvement in sickle cell disease. Turk J Gastroen-terol. 2005;16:194–8.
5. Angelucci E, Brittenham GM, McLaren CE, et al. Hepatic iron concentration and total body iron stores in thalassemia major. N Engl J Med. 2000;343:327–31.
6. St Pierre TG, Clark PR, Chua-anusorn W, et al. Noninvasive measurement and imaging of liver iron concentrations using proton magnetic reso-nance. Blood. 2005;105:855–61.
7. Wood JC, Henriquez C, Ghugre N, et al. MRI R2 and R2* mapping accurately estimates hepatic iron concentration in transfusion-dependent thalassemia and sickle cell disease patients. Blood. 2005;106:1460–5.
8. Alústiza JM, Artetxe J, Castiella A, et al. MR quantification of hepatic iron concentration. Ra-diology. 2004;230:479–84.
9. Gandon Y, Olivié D, Guyader D, et al. Non-in-vasive assessment of hepatic iron stores by MRI. Lancet. 2004;363:357–62.
10. Vivas WLP, Rebouças DS, Fabbro ALD, et al. Heterozigose para hemoglobinopatias em doado-res de sangue do Centro de Hemoterapia de Ser-gipe. Rev Bras Hematol Hemoter. 2006;28:284– 7.
11. Harmatz P, Butensky E, Quirolo K, et al. Sever-ity of iron overload in patients with sickle cell dis-ease receiving chronic red blood cell transfusion therapy. Blood. 2000;96:76–9.
12. Cançado RD. Sobrecarga e quelação de ferro na anemia falciforme. Rev Bras Hematol Hemoter. 2007;29:316–26.
13. Angulo IL, Covas DT, Carneiro AA, et al . Deter-mination of iron-overload in thalassemia by he-patic MRI and ferritin. Rev Bras Hematol Hemo-ter. 2008;30:449–52.
14. Vermylen C. What is new in iron overload? Eur J Pedriatr. 2008;167:377–81.
15. Olivieri NF, Brittenham GM. Iron-chelating therapy and the treatment of thalassemia. Blood. 1997;89:739–61.