1 1 1 1 1 1 1
1 Universidade do Estado de Santa Catarina. Cen-tro de Ciências da Saúde e do Esporte. Florianópo-lis, SC. Brasil.
Received: 07 July 2010 Accepted: 03 November 2010
Graziela Aveline Silveira Luciana Gassenferth Araujo Elinai dos Santos Freitas Gustavo Ricardo Schütz Thiago Gonsaga de Souza Suzana Matheus Pereira Helio Roesler
Proposal for standardization of the distance for
analysis of freestyle flip-turn performance
Proposta de padronização para a distância de análise do
desempenho da virada no nado
crawl
Abstract – The ongoing research on freestyle lip turns requires the standardization of assessment methods and protocols. The objective of this study was to propose a standardi-zation of the distance used for the analysis of lip-turn performance. Eleven swimmers of both genders (16±3 years) participated in the study. Peak force (PF) and contact time (CT) were measured using a force platform. Five camcorders were installed to determine the lip-turn time at a distance of 15 (TT15) and 10 m (TT10), distance before the lip-turn, distance to regain stroke, and time without stroke. Each swimmer performed eight lip turns. The level of signiicance was set at p<0.01. Mean PF was 1075 N and mean CT was 0.32 s. Mean TT10 and TT15 were 5.52 and 8.81 s, respectively. PF and CT were associated with lip-turn performance at distances of 10 and 15 m. However, this association was stronger when analyzing time without stroke, which is part of the lip-turn phases. In conclusion, PF and CT were associated with lip-turn performance at distances of 10 and 15 m. A distance of 10 m was found to be suficient to evaluate athletes with technical characteristics similar to those of this study. The use of the 15-m distance is recommended for swimmers with different technical characteristics, such as a longer underwater phase.
Key words: Biomechanics; Crawl; Flip turn; Swimming.
Resumo – Com as contínuas pesquisas sobre virada na natação são veriicadas necessidades de padronizar métodos e protocolos utilizados para a avaliação. Este estudo objetivou propor uma padronização para a distância de análise do desempenho da virada na natação. Participaram 11 nadadores (16±3 anos) velocistas de ambos os sexos. Com uma plataforma de força foram obtidas as variáveis: Pico de Força (PF) e Tempo de Contato (TC). Com cinco ilmadoras obteve-se tempo de virada em 15 m (TV15m), tempo de virada em 10 m (TV10m), distância antes da virada (DAV), distância de retomada de nado (DRN) e tempo sem nado (TSN). Foi utilizada estatística com p<0,01. O valor médio para o PF foi de 1075 N e para o TC de 0,32 s. As variáveis TV10m e TV15m registraram média de 5,52 e 8,81 s, respectivamente. As variáveis PF e TC tiveram relação com o desempenho da virada nas distâncias de 10 e 15 m. Entretanto esta relação apresenta-se mais forte ao analisar o tempo sem nado, que contempla as fases da virada. Conirmou-se que as variáveis PF e TC têm relação com o desempenho da virada para as distâncias de 10 e 15 m. Foi observado que a 10 m é suiciente avaliar atletas com características técnicas semelhantes aos deste estudo. Outros nadadores com diferentes características técnicas, tal como um maior aproveitamento da fase submersa sugere-se ao pesquisador utilizar a medida de 15 metros (5 m antes e 10 m após a virada).
Distance for analysis of freestyle flip-turn performance Silveira et al.
INTRODUCTION
Swimming is a constantly improving sport due to the resources applied to training and to the evaluation of the technical development of its fundamentals1. Freestyle lip turn is a topic widely
discussed in the scientiic literature and its impor-tance in competitions has been emphasized2-4. The
ongoing research on swimming lip turns requires the standardization of assessment methods and protocols. Hubert et al.5 emphasized the importance
of standard criteria and protocols for the analysis of swimming fundamentals in order to improve procedures and to prevent the collection of time-consuming and unproductive data.
No standardization or deined protocols of the distance at which to start and to inish the analysis of lip turns are available. Divergences exist between studies, with lip turns being evaluated at 10 m (5 m before and 5 m after the turn)3,6,7, 7.5
m (2.5 x 5.0 m)8,9, 15 m (7.5 x 7.5 m)2,10,11, and 15
m (5.0 x 10.0 m)7,12. Flip-turn time can inluence
total race time in 25-m pools, accounting for 20 to 38% of total race time in 50- to 1500-m freestyle competitions, respectively13. The analysis of factors
related to lip-turn performance, i.e., variables that inluence turn time such as peak force5,14 and
con-tact time3,5,12,15, as well as segment angle12, speed3,16
and distance3, is therefore important. However, to
measure turn time it is necessary to deine a com-mon start point and end point for comparisons.
Within this context, the objective of the present study was to propose a standardization of the distance for the analysis of freestyle lip-turn performance using biomechanical indicators that can be correlated with performance.
METHODOLOGICAL PROCEDURES
Eleven intentionally chosen sprint swimmers (6 men and 5 women) with a training duration of at least 3 years and experienced in the technique of front crawl lip turn participated in the study. The participants had a mean age of 16 ± 3 years, body weight of 63.4 ± 8.9 kg, and height of 172.6 ± 8.0 cm. The mean 50-m freestyle time in a 25-m pool was 26.93 ± 2.76 s for men and 28.90 ± 1.72 s for women. The study was approved by the Ethics Committee of Universidade do Estado de Santa Catarina (protocol 48/2008).
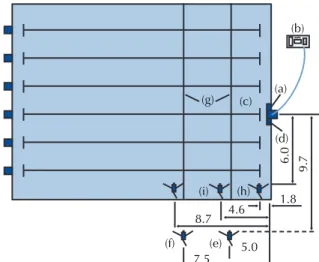
Dynamometric data were obtained using an extensometric underwater force platform (Figure
1a) and a system consisting of a signal condition-ing card, A/D converter and computer (Figure 1b) developed based on the study of Roesler14. The
SAD 32 Bits software was used for acquisition of the data. The acquisition frequency was 600 Hz.
The force platform was attached to a support inside the pool and was completely submerged against the turn wall of lane three. The aim of the support, which was L-shaped and measured 0.70 x 0.54 m, was to sustain the platform. The height of the platform with the support was 0.20 m and the lid of the platform was 0.20 m distant from the wall of the pool. For the black line on the bottom of the pool to be at the oficial distance from the pool wall (force platform), an adaptation was made, moving the line back 0.20 m(Figure 1c).
A frame measuring 2.24 x 1.22 x 0.20 m (width x height x thickness) and surrounding the force platform was attached to the pool wall. The aim of this frame was to “mask” the platform, providing safety to the swimmers and the sensation that they were touching the pool wall normally (Figure 1d).
The following dynamometric variables were chosen as biomechanical indicators of lip-turn performance: peak force (PF), the greatest force applied by the swimmer to the wall/force platform during lip turn, reported in absolute values as Newton [N] and normalized to body weight [PFn]; contact time (CT), the duration the swimmer maintained contact with the wall/force platform, calculated by subtracting initial time of contact (ti) from inal time of contact (tf) [s] of the feet. The dynamometric data were obtained with the SAD 32 Bits data acquisition system as follows: 1) a calibration coeficient was applied and the data were iltered using a low-pass FFT type Butterworth ilter (cut-off frequency: 30 Hz); 2) determination of PF; 3) normalization to body weight; 4) determina-tion of PFn; 5) determinadetermina-tion of CT.
f
of frames from (ti) to (tf), multiplied by 1/30 (30-Hz image acquisition frequency) [s].
Second, in order to minimize the possible effect of swimming time on turn performance, three underwater video cameras were positioned as follows to obtain the variables distance before the turn (DBT) and distance to regain stroke (DRS): Camera 3 at a distance of 1.8 m from the pool wall (Figure 1h, ield of view of 0 to 3.9 m), Camera 4 at a distance of 4.6 m (Figure 1i, ield of view of 2.5 to 6.7 m), and Camera 5 at a distance of 8.7 m (Figure 1j, ield of view of 6.6 to 10.8 m). DBT was determined by the inal instant of the approach phase and the beginning of the rotation phase, and DRS was determined by the instant when the swimmer performed the irst noticeable hand movement during the arm sup-port phase. A 3.0-m calibrator with longitudinal marks at intervals of 0.50 m and the DgeeMe 0.98b program were used for the determination of the variables. In addition, the time without stroke (TWS) was determined, which is deined as the time elapsed between DBT (xi) and DRS (xf) (xi - xf) using the same procedures as described for TT15 and TT10. All cameras were synchronized with a light-emitting diode, which permitted the visualization of the instant when the lamps were simultaneously lit by the ive digital cameras. This light signal synchronized all cameras and was interconnected to the dynamometric data acquisition system, with all lamps being lit at the same time by the same device.
The data were collected in the swimming pool of CEFID/UDESC. The training session was sched-uled by the technician of the team. The swimmers were familiarized with the situation of data col-lection and the devices: a) information about the procedures of data collection and signing a free informed consent form for the collection of photo-graphs, videos and recordings; b) measurement of anthropometric variables (body weight and height); c) warm-up as establishment by the technician and execution of some turns on the force platform for adaptation to the device; d) each swimmer then performed eight sequential turns at intervals of 5 min. Each swimmer left the pool wall below the starting block, crawling until reaching the maxi-mum speed at 12.5-m mark, performed the turn, and maintained the speed until the 12.5-m mark, reducing speed until reaching the starting point.
Descriptive statistics was used for charac-terization of the data, with the calculation of the mean (
X
), standard deviation, and coeficient of variation (CV). Since the data showed no normal distribution (Shapiro-Wilk test, p>0.05), Spear-man’s correlation coeficient (ρ =0.05*; ρ =0.01**) was used to evaluate the association between bio-mechanical indicators of performance and TT15, TT10, and TWS. Statistical analysis was performed using the SPSS for Windows 11.0® software.RESULTS
Table 1 shows the biomechanical indicators of turn performance, TT10, and TT15.
Table 1. Peak force (PF), peak force normalized to body weight (PFn), contact time (CT), turn time at 10 m (TT10), and turn time at 15 m (TT15) (n = 88).
PF [N] PFn [N/N] CT [s] TT10 [s] TT15 [s]
X 1075 1.72 0.32 5.52 8.82
SD 302 0.35 0.08 0.57 0.79
CV 28% 20.3% 25.0% 10.3% 9.0%
X = mean; SD = standard deviation; CV = coefficient of variation.
Distance for analysis of freestyle flip-turn performance Silveira et al.
consisted only of the events that represent the phases of the lip turns.
The mean percentages of swimming time and turn time under this perspective, as well as for 10 and 15 m, are shown in Figure 2.
The percentage of swimming time for the 10-m distance was 49.5%, which represents more the lip-turn action, whereas the percentage at 15 m, which was 68.4%, represents more the swimming action. Since other variables have been reported to be important for the evaluation of freestyle turns3,5-7,16, PF
and CT were correlated with TT15, TT10 and TWS using Spearman’s correlation coeficient (Table 2).
Table 2. Spearman’s correlation coefficient (ρ) between turn time at 15 m (TT15), turn time at 10 m (TT10) and time without stroke (TWS) and peak force (PF), peak force normalized to body weight (PFn) and contact time (CT).
PF PFn CT
TT15 -0.775 ** -0.632 ** 0.507 **
TT10 -0.808 ** -0.676 ** 0.553 **
TWS -0.836 ** -0.802 ** 0.656 **
As can be seen in Figure 3, there was a nega-tive correlation between PF and TWS, with R2
explaining 63% of TWS as a result of the force applied to the platform.
Figure 2. Mean percentages of swimming time and turn time according to the distance analyzed.
Figure 3. Dispersion graph showing the tendency line and R2.
DISCUSSION
In swimming, the performance of the athlete is measured by the time spent to swim a certain distance10-13. The variables that can inluence turn
performance include the maximum force applied by the swimmer to the pool wall5,6,15, duration of this
force5,15, segment angle12, speed, and distance7,15.
The objective of the present study was to evaluate the behavior of PF, PFn and CT and to propose a standardization of the distance for analysis of freestyle turn performance.
Force data are reported in the literature as normalized to body weight of the subject. In the present study, non-normalized and normalized PF data were used to permit comparisons with other studies. The PFn values observed were similar to those reported by Pereira4 and Araujo et al.10
who obtained mean values of 1.38 and 1.78 N/N, respectively. The mean CT was 0.32 s. A similar value has been reported by Lyttle and Mason2. It
should be noted that the cited studies compared swimmers with similar performance characteristics. The mean TT10 was similar to that reported by Lyttle et al.2 who found a mean time of 5.07 s. The
mean TT15 was 8.81 s, an intermediate value be-tween the studies of Lyttle and Mason2 and Hubert
et al.5, who obtained mean values of 7.97 and 8.11
s, respectively, and the study of Araújo et al.10 who
reported a mean time of 9.06 s.
The description and analysis of turns according to Haljand12 represent a movement system
consist-ing of phases that are delimited by clear and deined actions, which include movement of the whole body. According to the literature, the freestyle turn starts with the approach phase during which the swimmer approaches the pool wall and evaluates the distance that separates him from the wall to perform the last stroke before the rotation phase. The following phases include the push off phase, glide phase and, inally, the stroke preparation phase (the swimmers is underwater during these phases), which is initiated when the speed of the gliding action decreases to its normal swimming speed, a time when the swimmer should restart his normal cycle of strokes and leg movements13.
A strong association was observed between PF, PFn and CT, parameters that have been suggested to be important for turn performance5,12,15. This
inding agrees with the view that these variables indeed inluence turn performance.
According to Hubert et al.5 and Araujo et al.7,
acceleration, i.e., the higher the force, the greater the acceleration at the time when the swimmer leaves the pool wall, thus contributing to turn performance. Lyttle et al.15 and Cronin et al.16 also
reported that faster turns are the result of higher PF and shorter CT. The time of contact with the wall should be minimal, but a suficient force should be applied for an effective push off phase.
Analysis of the correlation between PF and PFn and turn performance at both TT10 and TT15 showed a negative and significant correlation, indicating that higher maximum PF values cor-respond to shorter turn times, in agreement with the literature. Similarly, the negative correlation with CT indicates that the shorter CT, the shorter the turn time at the two distances.
However, when analyzing a large number of swimmers and/or events, a standard distance per-mits the comparison between swimmers. Some studies have shown this concern, analyzing differ-ent distances before and after the turn. Kjendlie et al.7 and Haljand12 evaluated elite-level competitive swimmers using a distance of 15 m (5 m before and 10 m after the turn), since athletes with these char-acteristics take better advantage of the underwater phase, with oficial rules permitting the swimmer to remain under water for 15 m.
An analysis of swimmers prior to the event to be evaluated would permit the determination of DBT and DRS, quantifying the ideal distances for the analysis of freestyle turns. The mean DBT of 1.61 m is markedly lower than the 5 m reported in previous studies, and DRS depends on the uti-lization of the underwater phase by the swimmer.
CONCLUSIONS
The present results showed that PF and CT are correlated with turn performance at distances of 10 and 15 m. In addition, the variable TWS was the same for the two distances studied, indicating that turn actions can be measured suficiently at a distance of 10 m. Analysis of the most adequate distance to obtain turn performance time showed that 10 m is suficient for the evaluation of athletes with characteristics similar to those of the present study since, when performance was analyzed at 15 m, it was observed that more than half the time the athlete was swimming, i.e., he does not per-form the turn action itself. Therefore, a distance
athletes with technical characteristics similar to those of the present study. In the case of swim-mers with different technical characteristics who take greater advantage of the underwater phase, a distance of 15 m (5 before and 10 m after the turn) should be adopted.
REFERENCES
1. Cossor J, Blanksby B, Elliott B. The inluence of plyo-metric training on the freestyle tumble turn. J Sci Med Sport 1999;2(2):106-16.
2. Lyttle A, Mason B. A kinematic and kinetic analysis of the freestyle and butterly turns. J Swimming Res 1997;12:7-11.
3. Prins JH, Patz A. The inluence of tuck index, depth of foot-plant, and wall contact time on the velocity of push-off in the freestyle lip turn. Rev Port Cien Desp 2006;6(Supl.2):82-5.
4. Pereira SM, Araujo LG, Freitas E, Gatti R, Silveira G. Biomechanical analysis of the turn in front crawl swimming. Rev Port Cien Desp 2006;6(Supl.2):77-9.
5. Hubert M, Roesler H, Araujo LG, Pereira SM, Santos LM, Schutz GR. Inluência de Variáveis Dinâmicas no Tempo de Execução da Virada no Nado Crawl. In: Anais do X Congresso Brasileiro de Biomecânica. Ouro Preto, Minas Gerais: Universidade Federal de Minas Gerais; 2003. p. 207-210.
6. Blanksby B, Gathercole DG, Marshall RN. Force plate and video analysis of tumble turn by age-group. J Swim-ming Res 1996;11:40-45.
7. Kjendlie PL, Haljand R, Fjortoft O, Stallman RK. The temporal distribution of race elements in elite swim-mers. Rev Port Cien Desp 2006;6(Supl.2):54-6.
8. Blanksby B, Skender S, Elliott B, McElroy K, Landers G. An analysis of the rollover backstroke turn by age-group swimmers. Sports Biomech 2004;3(1):1-14.
9. Blanksby B, Simpsom JR, Elliot B, McElroy K. Bio-mechanical factors inluencing breaststroke turns by age-group swimmers. J Appl Biomech 1998;14(2):181-9.
10. Araujo LG, Pereira SM, Gatti r, Freitas ES, Jacomel GF, Roesler H. Analysis of the lateral push-off in the Freestyle lip turn. J Sport Sci 2010;28(11):1175-1181.
11. Arellano R, Brown P, Cappaert J, Nelson R. Analysis of 50, 100 and 200 m freestyle swimmers at the 1992 Olympic Games. J Appl Biomech 1994;10:189-9.
12. Haljand, R. Technical preparation of swimming starts turns and stroke. Estonia: Talliwn University of Educa-tion Sciences; 1998.
13. Maglischo EW. Swimming even faster. Mountain View: Mayield Publishing Company; 1993.
Distance for analysis of freestyle flip-turn performance Silveira et al.
15. Lyttle A, Blanksby B, Elliott C, Lloyd D. Investigat-ing kinetics in the freestyle lip turn push-off. J Appl Biomech 1999;15:242-52.
16. Cronin J, Jones J, Frost D. The relationship between dry-land power measures and tumble turn velocity in elite swimmers. J Swimming Res 2007;17:17-23.
Address for Correspondence