Numerical simulation of bolted connections
Abstract
This article presents the modeling of a complete bolted connection based on a model with one bolt connecting two or three plates. Initially, the behavior of this model with one bolt is analyzed by comparing it with existing bibli-ography for 3 different types of applied load: tension, shear and a combina-tion of these two. This model includes all necessary consideracombina-tions: contacts between the plates and the nut, head and shank of the bolt; contact between the plates, as well as friction between them; and pre-load on the bolt. The model also responds properly to loads parallel and perpendicular to the con-tact surface between the plates, including prying action effects. These cali-brated models are then introduced as super-elements in empty spaces left on the full connection, through a relatively simple process using the finite element software ANSYS®. Upon filling these spaces, two complete connec-tion models are evaluated: one with a single plate and one between two T-stubs. The results obtained with these models are compared with standard forecasts. These two connection types have a practical application in the way they will be analyzed, and also as part of more complex connections: bolted girder splices (in the region of web beam), beam-to-column connections with splice plates or end plate connections, beam splices with end-plates, etc.
Keywords
Modeling of bolted connections, Simple shear connections, T-stub connec-tions, Super-elements.
1 INTRODUCTION
During the last years, in the discussions involving structural analysis and global performance of steel struc-tures, the semi-rigid behavior of the connections has become a topic of extreme importance, and was introduced in the calculation procedures of AISC (1980) and, later, in the design methodology proposed by Eurocode 3 (1993).
The semi-rigid behavior of the connections has been incorporated into the practice of structural analysis, not only because it better represents the actual behavior of the structure relative to its overall response, but also be-cause it contributes to the design of more economical structural elements (Maggi et al., 2005).
Among the connecting means employed in the practice, the bolted connections distinguish themselves for the simplicity and rapidity in the assembly process of steel structures. However, the large number of variables in this type of connection - the thickness of the plates involved in the connection, the diameter and positioning of the fas-teners, etc. - make it difficult to analyze their behavior (Queiroz et al., 2013).
There are numerous references in literature dealing with bolted connections through numerical analysis, and most of them used one-dimensional and two-dimensional elements in the numerical models development. With the advancements of finite element programs and with a greater processing capacity of the computers, a refinement in the models is noticed, and these bolted connections started to be simulated with the use of solid elements, making it possible to consider the nodal region stiffness more realistically.
Yilmaz and Bekiroglu (2014), for example, simulated bolts subjected to single and double shear loadings, through ANSYS® software, evaluating the initial pretension influence on the behavior of these connections. The models were developed with solid elements, the efforts between the parts were transmitted using contact elements, however the thread geometry of the bolts was not considered. Moreover, Fransplass et al. (2015) investigated the behavior of threaded steel fasteners subjected to combined tension and shear loading at elevated loading rates, also using three-dimensional finite element model, but in this case, the thread geometry was simulated with high levels of detail. This numerical simulation captured the overall physical behavior of the threaded assembly, yet the values
Paula Moura Leite Vilelaa*
Hermes Carvalhoa
Oswaldo Teixeira Baião Filhob
a Departamento de Engenharia de Estruturas, Universidade Federal de Minas Gerais – UFMG, Belo Horizonte, MG, Brasil. E-mail:
[email protected], [email protected] b Núcleo de Estruturas, Universidade FUMEC, Belo Horizonte, MG, Brasil. E-mail: [email protected]
*Corresponding author
http://dx.doi.org/10.1590/1679-78254338
of ultimate load and initial elastic stiffness for all the load cases investigated were higher than the experimental results obtained in Fransplass et al. (2015) research.
Since nodal region is composed of several elements with different behaviors, and the simulation of this region, as well as the interaction between its components, makes bolted connections modeling complex, a finite element model with one bolt connecting two or three square plates was developed in this work, in such a way that all the necessary considerations were included: contact between the plates and the nut, the head and the shank of the bolt; contact and friction between the plates; pretension in the bolt. This unitary model, that adequately responded to forces acting parallel and perpendicular to the contact surface between the plates, capturing the effects of prying action, was finally inserted in some complete connections, with different amount and position of the bolts, which shows the versatility of this form of numerical modelling.
2 METHODOLOGY
The methodology adopted for this study consists in:
• validating a finite element model with only one bolt through comparisons with experimental results available in the literature, considering bolts subjected to tension, shear and a combination of tension and shear;
• inserting this model with one bolt in a complete connection, modeled with finite elements too, comparing the numerical results of these connections with actual standards.
Two types of connections were chosen: with the bolt group loaded eccentrically and subjected, essentially, to shear; and a T-stub type connection, where the bolts are subjected to tension. All models were developed using the APDL language of software ANSYS®.
3 UNITARY NUMERICAL MODEL
3.1 Numerical model description
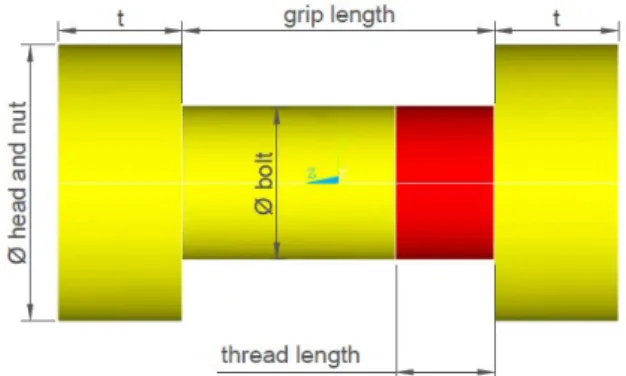
The element type used on the modelling of the components is SOLID186. The plates of the unitary model are square and present a central hole with diameter that corresponds to the diameter of the standard hole indicated by the AISC (2010) standard, bigger than the nominal diameter of the bolt. The geometry of the bolt – Figure 1 – pre-sents some simplifications: the nut and the head of the bolt have the same diameter, D, and the same thickness, t, with values based on American specifications for high-strength bolts, ASTM A325 (ASTM, 1985); the thread region, whose effective area is equivalent to, approximately, 75% of the shank area, was modelled with the nominal diam-eter of the bolt, however with a less resistant material.
Figure 1: Geometry of the bolt.
Equations 1-4 show how to obtain the mentioned diameter, D, and thickness, t: 1
2 cos 30
nut
W
d W (1)
1
2 cos 30
head
F
d F (2)
2
nut head
d d
1 2 2
H H
t (4)
where dnut is the considered diameter of the nut, calculated using the average of the diameters inscribed and
circumscribed to the hexagon, represented, respectively, by W and W/cos 30° - see Figure 2;
dhead is the considered diameter of the bolt head, calculated using the average of the diameters inscribed and
circumscribed to the hexagon, represented, respectively, by F and F/cos 30° - see Figure 2, H1, H2 is the height of the bolt head and of the nut, respectively.
Figure 2: Heavy-hex structural bolt and heavy-hex nut (ASTM, 1985).
The trilinear stress-strain relationship used to define the material property of the plates and of the thread and shank portions of the bolt is shown in Figure 3. The first line segment represents the elastic range of the material, with slope equivalent to the Young’s modulus, E, equal to 200 GPa (ABNT, 2008), and yield stress equal to fy. The
second and third line segments represent the plastic range, where it is assumed that the tensile strength, fu, is
reached when the deformation values exceed 2%. The ultimate deformation, εu, corresponds to the deformation
attained at the rupture of the material. Yield stress and tensile strength for the thread material are equal to these values for the shank material of the bolt multiplied by 0.75 (Vilela, 2016).
Figure 3: Stress versus strain relationship of the unitary model materials.
For an adequate simulation of the contact between the parts, surface-to-surface contact elements TARGE170 and CONTA174 were used. In the determination of the contact pairs, the ANSYS® default values were adopted for most of the parameters, except the FKN value for the contact pair established between the hole and the bolt, ad-justed to 0.01 – recommended value for regions with bending deformations (ANSYS – 17.0, 2016). The tangent stiffness factor, FKT, is calculated automatically by the software and is proportional to the normal stiffness and to the friction coefficient, μ, assumed to be 0.3 – based on AISC (2010).
In the definition of the contact elements CONTA174, the KEYOPT(4) and KEYOPT(10) parameters were con-sidered with a value of 2, which mean, respectively, that the contact detection occurs at the nodes of the contact elements (and not at the Gauss points), and that the contact stiffness is updated at each iteration (not at each load step).
must have “closed” contact status, which does not occur only for the region between the bolt and the plates hole, that has “open” contact status due to the gap between these elements.
The bolt preload was applied through the PRETS179 element, like in Wang et al. (2013).
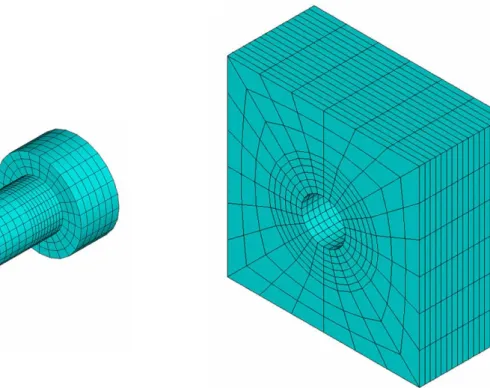
According to Salamet and Garlock (2010), for regions with high stress concentrations, such as on bolts and plate holes, mesh convergence studies suggest 20 to 24 elements around the circumference of a typical bolt diam-eter (22.225 mm to 31.75 mm). Figure 4 presents the mesh of the unitary model components, with 24 elements around the circumference that define the diameter of the plate holes and bolt shank. The mesh configuration of the rest of the model is based on this value, which resulted in a unitary model with 3240 elements for the plates dis-cretization and 3888 elements for the disdis-cretization of the bolt.
Figure 4: Mesh of the unitary model.
Figure 5 shows an example of a full connection with empty spaces, where the unitary model is inserted. The mesh of the matching edges must be the same so that the parts can be joined together.
Figure 5: Full connection with empty spaces.
3.2 Results
Rumpf and Fisher (1963) studied the behavior and performance of individual A325 high-strength bolts under direct tension and torqued tension, Wallaert and Fisher (1964) determined the behavior of single high-strength bolts under static shear loadings. Chesson et al. (1964) aimed at defining the strength and behavior characteristics of single, high-strength bolts under static loadings of tension and shear. All these works were carried out as part of the Large Bolted Joints Project, under the technical guidance of the Research Council on Riveted and Bolted Struc-tural Joints, and the unitary model was validated according to the experimental results presented by these three works, considering bolts subjected to tension, shear and a combination of these efforts. The main aspects of the unitary model simulations (number of analysis, bolt diameters, plate thicknesses, etc.) are presented in Table 1.
Table 1: Main aspects of the unitary model simulations.
Heavy head bolts subjected to:
Direct tension Double shear Combination of tension and single shear Bolt diameter
(nominal) 22.225 mm 22.225 mm 19.05 mm
Grip length 104.8 mm 104.8 mm 40.6 mm
Thread length in grip 3.2 mm 3.2 mm 12.7 mm
Bolt grade A325 A325 A325
Bolt lot 8B 8B B and C
Bolt pretension no yes yes
Plate material - ASTM A440 ASTM A7
Plate thicknesses - 4 x 25.4 mm 2 x 20.3 mm
Number of tests 1 1 12
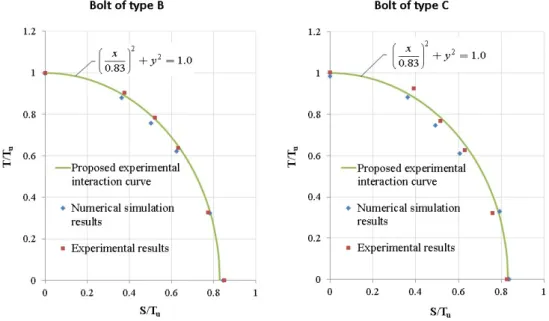
Figure 6 and Table 2 presents numerical and experimental results of two bolt series, B (ASTM A325) and C (ASTM A354), for each T-S ratio evaluated in Chesson et al. (1964). T and S are, respectively, the tension and the shear forces applied on the bolts while Tu is their ultimate strength in tension. The experimental interaction curve
proposed by the authors is also represented in Figure 6 (green curve).
In the last column of Table 2, it can be observed that the numerical results (blue points in Figure 6) showed good agreement with the experimental results (red points in Figure 6) and the maximum difference between them is of 5%. Further numerical results for the unitary model, which also showed good agreement with the experimental ones, are not presented in this work. More details can be found in Vilela (2016).
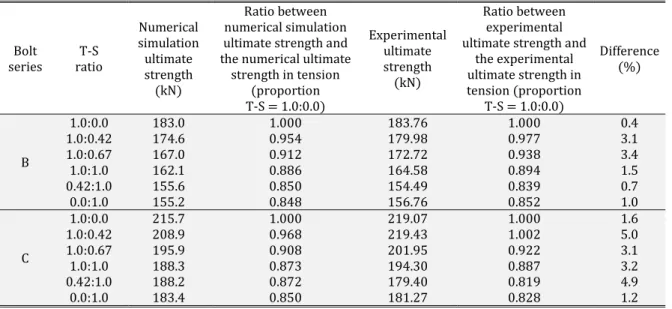
Table 2: Numerical and experimental ultimate strengths for each T-S ratio, B and C bolt series.
Bolt
series ratio T-S
Numerical simulation ultimate strength (kN) Ratio between numerical simulation ultimate strength and the numerical ultimate strength in tension
(proportion T-S = 1.0:0.0)
Experimental ultimate strength (kN) Ratio between experimental ultimate strength and
the experimental ultimate strength in tension (proportion
T-S = 1.0:0.0)
Difference (%)
B
1.0:0.0 183.0 1.000 183.76 1.000 0.4
1.0:0.42 174.6 0.954 179.98 0.977 3.1
1.0:0.67 167.0 0.912 172.72 0.938 3.4
1.0:1.0 162.1 0.886 164.58 0.894 1.5
0.42:1.0 155.6 0.850 154.49 0.839 0.7
0.0:1.0 155.2 0.848 156.76 0.852 1.0
C
1.0:0.0 215.7 1.000 219.07 1.000 1.6
1.0:0.42 208.9 0.968 219.43 1.002 5.0
1.0:0.67 195.9 0.908 201.95 0.922 3.1
1.0:1.0 188.3 0.873 194.30 0.887 3.2
0.42:1.0 188.2 0.872 179.40 0.819 4.9
0.0:1.0 183.4 0.850 181.27 0.828 1.2
4 COMPLETE BOLTED CONNECTIONS MODELS – ECCENTRICALLY LOADED CONNECTIONS
4.1 General
When the line of action of an applied load does not pass through the center of gravity of a bolt group, the moment resulting from this eccentricity must be considered in the connection design. The eccentricity produces both rotation about the centroid of the bolt group and translation of one connected element with respect to the other. The combined effect of this rotation and translation is equivalent to a rotation about a point, defined as in-stantaneous center of rotation, and its location depends on the geometry of the bolt group as well as the direction and point of the load application (AISC, 2005).
The AISC Steel Construction Manual presents some tables that employ the instantaneous center of rotation method for different bolt patterns and eccentric conditions. The available strength of the bolt group for any of the arrangement of the tables is defined by ϕRn, which is equivalent to the coefficient C multiplied by ϕrn, the available
strength of a single bolt.
4.2 Numerical model description
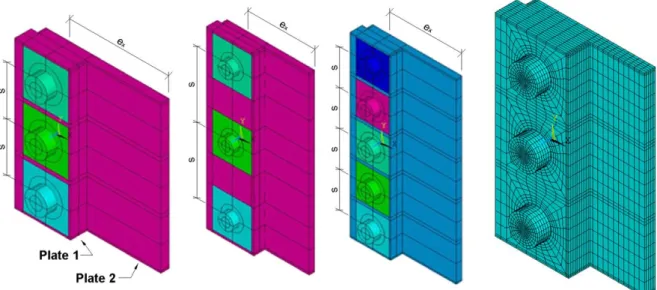
This work analyzes some configurations of eccentrically loaded bolt groups provided in the AISC manual, var-ying the values of the horizontal component of the load eccentricity, ex, number of bolts in one vertical row, n, and
Figure 7: Geometric configurations and a typical mesh of the evaluated connections.
On the evaluated numerical models, a thickness of 25.4 mm was adopted for plate 1 and a thickness of 12.7 mm was used for plate 2, which length varies according to the value of ex. The friction coefficient between the plates
was considered equal to 0.3. All bolts are of type ASTM A325, have a diameter of 19.05 mm, thread length of 3.18 mm to guarantee shear plane out of the thread region, and an initial preload equal to, approximately, 70% of the minimum specified tensile strength of the bolt. The material of the plates is ASTM A36. Table 3 describes the values adopted for the definition of the trilinear curves of these materials.
Table 3: Values of the trilinear curve stress-strain for the materials of the complete model with eccentrically loaded bolt group.
Stress (MPa) Strain (mm/mm)
Bolt shank (ASTM A325)
0 0
fy,b = 635 åy,b = 0.003175 fu,b = 825 åu,b = 0.02
1.01 fu,b = 833.25 0.3
Bolt thread (ASTM A325)
0 0
fy,bt = 476.25 åy,bt = 0.002381 fu,bt = 618.75 åu,bt = 0.02
1.01 fu,bt = 624.94 0.3
Plates (ASTM A36)
0 0
fy,pl = 250 åy,pl = 0.00125 fu,pl = 400 åu,pl = 0.02
1.01 fu,pl = 404 0.3
4.3 Results
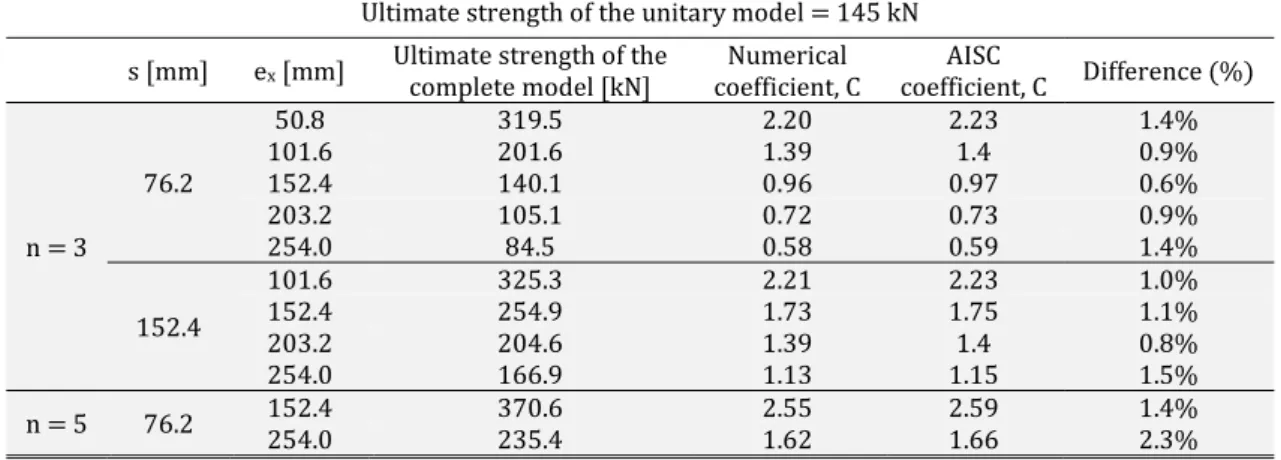
Table 4 presents a comparison between the values of the coefficients C recommended by the AISC manual and the coefficients obtained through the numerical simulations for the indicated values of n, ex and s. This coefficient
Table 4: Variables of eccentrically loaded connections and respective coefficient values, C.
Ultimate strength of the unitary model = 145 kN
s [mm] ex [mm] Ultimate strength of the complete model [kN] coefficient, C Numerical coefficient, C Difference (%) AISC
n = 3
76.2
50.8 319.5 2.20 2.23 1.4%
101.6 201.6 1.39 1.4 0.9%
152.4 140.1 0.96 0.97 0.6%
203.2 105.1 0.72 0.73 0.9%
254.0 84.5 0.58 0.59 1.4%
152.4
101.6 325.3 2.21 2.23 1.0%
152.4 254.9 1.73 1.75 1.1%
203.2 204.6 1.39 1.4 0.8%
254.0 166.9 1.13 1.15 1.5%
n = 5 76.2 152.4 254.0 370.6 235.4 2.55 1.62 2.59 1.66 1.4% 2.3%
A good agreement was observed between the numerical results and the AISC (2005) recommended values. Plates with different thicknesses were not evaluated, once numerically obtained coefficients C were calculated based on the ultimate bolt resistance, that is, considering the attendance of the other ultimate limit-states applicable to the plates. Figure 8 presents a distribution of von Mises stresses for the last converged step of the models with n equal to 3 and 5, s equal to 76.2 mm and ex equal to 152.4 mm. When a group of bolts is eccentrically loaded, the
bolts of the extremities are the most requested. Such behavior can be seen in Figure 8, where the external bolts failed, while the internal bolts did not develop all of their strength.
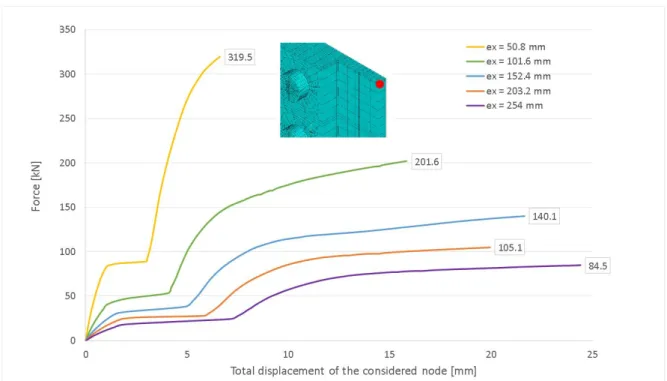
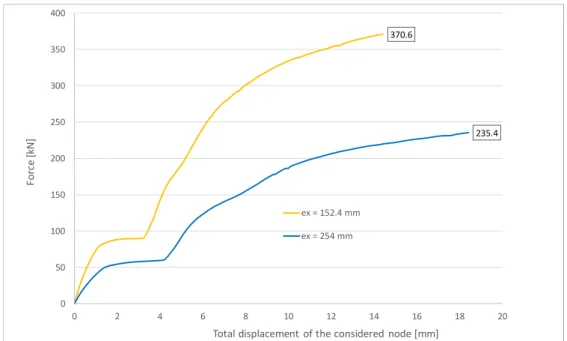
Figure 9, Figure 10 and Figure 11 present the load-displacement curves for all analyzed cases, on which the ultimate strengths of the numerical models is defined. The node selected to plot all the graphs is localized at the top right corner of the plate 2, and its total displacement value is the vector sum of the displacements along x-axis and y-axis (there is no displacement out of the plane, along z-axis).
Figure 9: Load-displacement curves for numerical models with 3 bolts (n=3), spaced by 76.2 mm.
325.3
254.9
204.6
166.8
0 50 100 150 200 250 300 350
0 5 10 15 20
Fo
rc
e
[k
N]
Total displacement of the considered node [mm]
ex = 101.6 mm ex = 152.4 mm ex = 203.2 mm ex = 254 mm
370.6
235.4
0 50 100 150 200 250 300 350 400
0 2 4 6 8 10 12 14 16 18 20
Fo
rc
e
[k
N]
Total displacement of the considered node [mm]
ex = 152.4 mm
ex = 254 mm
Figure 11: Load-displacement curves for numerical models with 5 bolts (n=5), spaced by 76.2 mm.
5 COMPLETE BOLTED CONNECTIONS MODELS – T-STUB CONNECTIONS
5.1 General
The T-stub connection is one of the simplest connections where the bolts are subjected to tension. Depending on the geometric characteristic and the material employed on the connection, additional forces near the flange ex-tremities can appear. This effect, known as prying action, increases the effort in the bolt, and should be taken into account in the analysis of the connection (Latour et al., 2014).
The American code provides a design procedure that includes the prying action, where bolt diameters and connected flange thicknesses are determined in such a way that bolt resistance, as well as flange stiffness and strength, are above the required.
Figure 12 presents the variables involved on consideration of prying action. The force per bolt can be deter-mined by T+q, where T represents the tension force per bolt due to the external acting force, 2T, and q is the addi-tional tension force per bolt due to prying action.
Figure 12: Prying forces in tee (AISC, 2005).
When the connection geometry is known, the available tensile strength including the effects of prying action,
Tavail, can be obtained multiplying the available tensile strength per bolt, B, by Q:
where Q is the factor that represents the presence or not of sufficient strength and stiffness of the flanges to develop all the available tensile strength of the bolts. The expressions used to calculate factor Q, showed in Table 5, depends on the value of á’, a parameter that either maximizes the bolt available tensile strength for a given thickness or minimizes the thickness required for a given bolt available tensile strength (AISC, 2005).
Table 5: Expressions used to calculate factor Q.
Q
if á' < 0 1 strength and stiffness to develop the full bolt which means that the fitting has sufficient available tensile strength
if 0 ≤ á' ≤ 1
2
1
'
ct
t
which means that the fitting has sufficient strength and stiffness to develop the full bolt available tensile strength, but insufficient
stiff-ness to prevent prying action
if á' > 1
2
1
ct
t
which means that the fitting has insufficient strength to develop the full bolt available tensile
strength
21
1
1
ct
t
ä, ñ and tc: geometric variables calculated ac-cording to AISC (2005); t: actual flange thickness5.2 Numerical model description
ASTM A325 bolts, with 19.05 mm diameter, and ASTM A572 Gr50 tee shapes were considered for evaluation of the behavior of T-stub connection subjected to tension. Since bolts of these connections are essentially subjected to tension, the thread material was used to define the shank and thread of these model bolts and the stress-strain values are presented in Table 6.
Table 6: Values of the trilinear curve stress-strain for the materials of T-stub connections.
Stress (MPa) Strain (mm/mm)
Bolt shank and thread (ASTM A325)
0 0
fy,bt = 476.25 åy,bt = 0.002381 fu,bt = 618.75 åu,bt = 0.02
1.01 fu,bt = 624.94 0.3
Plates (ASTM A572 Gr50)
0 0
fy,pl = 345 åy,pl = 0.001725 fu,pl = 450 åu,pl = 0.02
1.01 fu,pl = 454.5 0.3
Table 7: Geometric variables of evaluated T-stub connections.
Model 1 Model 2 Model 3 Model 4 Model 5 Flange thickness, tf (mm) 12.50 16.00 19.00 25.00 37.50
Web thickness, tw (mm) 12.50 16.00 16.00 16.00 25.00
b' (mm) 44.23 42.48 42.48 42.48 37.98
b (mm) 53.75 52.00 52.00 52.00 47.50
a' (mm) 49.53 49.53 49.53 49.53 49.53
Figure 13: Complete T-stub model and a typical mesh.
5.3 Results
Knowing the geometry of the connection, it is possible to calculate the required flange thickness, tc, to develop
the available tensile strength of the bolt, B, without the effect of prying action. Besides these values, Table 8 shows the available strength of the evaluated connections, Tavail, considering the effect of prying action, if it occurs.
Table 8: Parameter values related to the T-stub models.
tf = 12.5 mm tf = 16.0 mm tf = 19.0 mm tf = 25.0 mm tf = 37.5 mm
tc (mm) 26.33 25.80 25.80 25.80 24.40
á' 2.288 1.086 0.573 0.044 -0.411
B (kN) 176.4 176.4 176.4 176.4 176.4
Q 0.404 0.690 0.789 0.972 1
Tavail (kN) 285.2 486.5 556.3 685.5 705.4
Tnumerical (kN) 294.0 454.0 510.0 646.0 702.0
Tnumerical / Tavail 1.03 0.933 0.917 0.942 0.995
For flange thickness equal to 12.5 mm, the last step considered in the numerical model occurred for a load equal to 294 kN, when the stress level at the interface between the web and the flange reached the material strength of the plates, indicating connection failure. Figure 14a presents the von Mises stresses for the last step of the men-tioned tee, where it is possible to observe an accentuated bend of the plates and, also, the presence of extension regions with stress above steel yield stress at the centerline of the holes.
For flange thickness equal to 25.0 mm, the last step considered in the numerical model occurred for a load,
Tnumerical, equal to 646 kN, close to the value indicated by the formulation of AISC (2005). Figure 14b shows the von
in the previous analyzed model, the material strength of the plates is reached at the interface between the web and the flange.
For flange thickness equal to 37.5 mm, the last converged step occurred for a load, Tnumerical, equal to 702 kN,
which is equivalent to the available strength of the 4 bolts group. The high stiffness of flange tee shapes avoids the occurrence of prying action effects, what is in accordance with the AISC (2005) standard. Figure 15 exhibits the von Mises stresses diagram for the connection ultimate load, indicating the presence of few points with stress above the yield limit.
Figure 14: Von Mises stresses for complete T-stub model with flange thickness equal to: a) 12.5 mm; b) 25.0 mm
Figure 15: Von Mises stresses for complete T-stub model with flange thickness equal to 37.5 mm.
0 100 200 300 400 500 600 700 800
0 5 10 15 20 25 30 35
Fo
rc
e
[k
N]
Total displacement of the considered node [mm]
tf = 12.5 mm tf = 16.0 mm tf = 19.0 mm tf = 25.0 mm tf = 37.5 mm
Figure 16: Load-displacement curves for T-stub numerical models.
6 CONCLUSIONS
This work developed a numerical methodology to evaluate the behavior of one bolt subjected to tension, shear and a combination of these efforts, using software ANSYS®. This unitary model was inserted, subsequently, in two types of complete connections, and the results were compared with standard predictions.
In the connections with an eccentrically loaded bolt group, it was possible to determine the coefficients C for different geometric configurations and all of them presented good agreement with the values suggested by AISC (2005). The maximum difference between the results was of 2.3%.
In the numerical T-stub connections, distinguished failure modes were observed for different evaluated flange thicknesses. For flange thicknesses smaller than 19.0 mm, the failure was characterized by the rupture of the plates due to bending. For flange thickness equal to 25.0 mm, the failure occurred simultaneously at the flange (intercep-tion with the web) and at the bolts. When flange thickness is equal to 37.5 mm, there were no prying ac(intercep-tion effects, occurring bolt ruptures due to direct acting of the external load through the tee web. The available strength of all the evaluated models differ up to 9% in relation with that determined by AISC (2005).
Then, the proposed numerical methodology proves to be interesting, since it enables the evaluation of any bolted connection, including connections not provided by the reference standards.
References
American Institute of Steel Construction (AISC), Steel Construction Manual, 8th Edition, American Institute of Steel Construction, Chicago, IL, 1980.
American Institute of Steel Construction (AISC), ANSI/AISC 360-05, Specification for Structural Steel Buildings, American Institute of Steel Construction, Chicago, IL, 2005.
American Institute of Steel Construction (AISC), ANSI/AISC 360-10, Specification for Structural Steel Buildings, American Institute of Steel Construction, Chicago, IL, 2010.
American Society for Testing and Materials (ASTM), High-Strength Bolts for Structural and Steel Joints, ASTM Des-ignation A325M-84a, Philadelphia, 1985.
ANSYS – 17.0. Release 1.0 Documentation for Ansys. Canonsburg, United States, 2016.
Chesson, E., Faustino, N. L., Munse, W. H. (1964). Static Strength of High-Strength Bolts under Combined Shear and Tension, University of Illinois, March 1964.
Eurocode 3 (1993). Design steel of structures: Part 1.1 – General rules and rules for buildings – Revised Annex J: Joints in building frames.
Fransplass, H., Langseth, M., Hopperstad, O. S. (2015). Experimental and numerical study of threaded steel fasteners under combined tension and shear at elevated loading rates, International Journal of Impact Engineering 76: 118-125.
Latour, M., Rizzano, G., Santiago, A., da Silva, L. S. (2014). Experimental analysis and mechanical modeling of T-stubs with four bolts per row, Journal of Constructional Steel Research 101: 158-174.
Maggi, Y. I., Gonçalves, R. M., Leon, R. T., Ribeiro, L. F. L. (2005). Parametric analysis of steel bolted end plate con-nections using finite element modelling, Journal of Constructional Steel Research 61: 689-708.
Queiroz, G., Carvalho, H., Vilela, P. M. L., Garcia, L. B. L. (2013). Sobre as regiões nodais das estruturas de aço forma-das por barras, Revista da Estrutura de Aço, v.2, No. 3, p. 206-217.
Rumpf, J. L. and Fisher, J. W. (1963). Calibration of A325 bolts, Lehigh University, Fritz Engineering Laboratory, Report No. 288.5, December 1963.
Salamet, S. and Garlock, M. (2010). Guidelines for Modeling Three Dimensional Structural Connection Models using Finite Element Methods. International Symposium “Steel Structures: Culture & Sustainability”. Istanbul, Turkey, September 21-23.
Vilela, P. M. L. (2016). Modelagem de ligações parafusadas pelo método dos elementos finitos. Dissertation (in Por-tuguese), Federal University of Minas Gerais, Brazil.
Wallaert, J. J. and Fisher, J. W. (1964). Shear Strength of High-Strength Bolts, Lehigh University, Fritz Engineering Laboratory, Report No. 288.20, July 1964.
Wang, Y. Q., Zong, L., Shi, Y. J. (2013). Bending behavior and design model of bolted flange-plate connection, Journal of Constructional Steel Research 84: 1-16.