Open Access
Research article
Predictors of mortality in HIV-associated hospitalizations in
Portugal: a hierarchical survival model
Sara S Dias*
1,3, Valeska Andreozzi
†2, Maria O Martins
†1,4and Jorge Torgal
†3Address: 1Higher Institute of Statistics and Information Management, New University of Lisbon, Lisbon, Portugal, 2Center of Statistics and Applications of Lisbon University, Lisbon, Portugal, 3Public Health University Department, Medical Sciences Faculty, New University of Lisbon, Lisbon, Portugal and 4Institute of Hygiene and Tropical Medicine, New University of Lisbon, Lisbon, Portugal
Email: Sara S Dias* - [email protected]; Valeska Andreozzi - [email protected]; Maria O Martins - [email protected]; Jorge Torgal - [email protected]
* Corresponding author †Equal contributors
Abstract
Background: The beneficial effects of highly active antiretroviral therapy, increasing survival and the prevention of AIDS defining illness development are well established. However, the annual Portuguese hospital mortality is still higher than expected. It is crucial to understand the hospitalization behaviour to better allocate resources. This study investigates the predictors of mortality in HIV associated hospitalizations in Portugal through a hierarchical survival model.
Methods: The study population consists of 12,078 adult discharges from patients with HIV infection diagnosis attended at Portuguese hospitals from 2005–2007 that were registered on the diagnosis-related groups' database.
We used discharge and hospital level variables to develop a hierarchical model. The discharge level variables were: age, gender, type of admission, type of diagnoses-related group, related HIV complication, the region of the patient's residence, the number of diagnoses and procedures, the Euclidean distance from hospital to the centroid of the patient's ward, and if patient lived in the hospital's catchment area. The hospital characteristics include size and hospital classification according to the National Health System. Kaplan-Meier plots were used to examine differences in survival curves. Cox proportional hazard models with frailty were applied to identify independent predictors of hospital mortality and to calculate hazard ratios (HR).
Results: The Cox proportional model with frailty showed that male gender, older patient, great number of diagnoses and pneumonia increased the hazard of HIV related hospital mortality. On the other hand tuberculosis was associated with a reduced risk of death. Central hospital discharge also presents less risk of mortality.
The frailty variance was small but statistically significant, indicating hazard ratio heterogeneity among hospitals that varied between 0.67 and 1.34, and resulted in two hospitals with HR different from the average risk.
Conclusion: The frailty model suggests that there are unmeasured factors affecting mortality in HIV associated hospitalizations. Consequently, for healthcare policy purposes, hospitals should not all be treated in an equal manner.
Published: 23 July 2009
BMC Health Services Research 2009, 9:125 doi:10.1186/1472-6963-9-125
Received: 18 February 2009 Accepted: 23 July 2009
This article is available from: http://www.biomedcentral.com/1472-6963/9/125
© 2009 Dias et al; licensee BioMed Central Ltd.
Background
The introduction of highly active antiretroviral therapy (HAART) in late 1996 dramatically improved the progno-sis of Human Immunodeficiency Virus (HIV) infected patients in most developed countries [1,2]. Consequently, the estimated number of worldwide deaths due to HIV/ AIDS is declining, which is attributable to the scaling up of antiretroviral treatment services. Nevertheless, HIV/ AIDS remains a leading cause of mortality throughout the world. In Portugal, although the access to treatment has been free of charge since 1996 and available in all hospi-tals since 2005, there are still an elevated number of deaths due to HIV/AIDS, namely, in men between 25 and 34 years old [3]. Despite declining mortality over the last years, adult HIV prevalence in 2007 ranges from 0.1% to 0.6% in Europe. Portugal is one of the European countries with the highest prevalence (0.5%) [4], where 31,667 cases of HIV/AIDS were notified in 2007 [5].
HIV/AIDS is one of the major financial burdens on healthcare systems worldwide. In the United States the average annual HIV/AIDS charge per patient was esti-mated to be approximately $18,000 from 1996–2000 [6]. In Portugal, hospitalizations related to HIV infection are also some of the most expensive; the average daily cost is around €825 and it is the second major diagnosis
cate-gory (MDC) with greater average hospitalization time. The average length of stay (LOS) in Portuguese hospitals from the National Health Service (NHS) was 23 days in 2006 [7,8]. Although this value is very high compared to countries like the USA or Canada, where the average is around 5 days [6,9], it is similar to European countries such as Germany where the average LOS is 20 days [10].
In recent literature several approaches have been adopted to analyse LOS. Barbour et al. [6] used a multivariable lin-ear regression model to study charges among HIV/AIDS inpatients. On the other hand, Huang et al. [11] used a generalized linear mixed model to study LOS and costs, and Wang et al. [12] adopted a two-component Poisson mixture model to analyse maternity LOS. In the present study, LOS will be considered the main vehicle that allows the study of hospital mortality of HIV infected patients.
In the study of hospital mortality one has to be aware that the risk of death cannot be assumed to be homogeneous, but must be considered as a heterogeneous, i.e. a mixture of individuals with different hazards. In this particular case, the hospital mortality may vary according to individ-ual patient and hospital characteristics. The former can be taken into account by including covariates at the hospital-ization level in a classical Cox proportional survival model. Differences in the health services can be assessed using hierarchical models, including variables at hospital-ization and hospital levels, allowing the estimate of
differ-ences in outcome not fully explained by observed patient or other specific and known conditions. The aim of this paper is to investigate predictors of mortality in HIV asso-ciated hospitalizations in Portugal. We propose the use of a hierarchical time survival model to analyse data of HIV discharges in Portuguese hospitals from 2005 to 2007.
To our knowledge, this is the first study using this type of methodology for HIV discharges in Portugal. This analysis is particularly important given the considerable burden associated with HIV treatment/hospitalization.
Methods
Data source
The data were provided by the Central Administration of Health System (ACSS) and refer to the Portuguese national database of the diagnosis related groups (DRG – All Patients v21.0). The data are anonymous and available from the ACSS for scientific research. In the DRG database each record corresponds to a discharge episode (hospital-ization) and contains information about the patient and information collected while the patient was in hospital.
Hospital characteristics were obtained from data provided by ACSS and the Portuguese National Institute of Statis-tics.
Study Population
Between 1st January 2005 and 31st December 2007 there
were 14,165 discharges registered in Portuguese NHS hos-pitals. For this study we considered only those that met the following criteria: hospitalizations classified under the MDC 24 created for HIV infections patients, which incor-porates the DRG 700–716; inpatients aged 18 years or older; geo-referenced cases, i.e., hospitalization with patient residence ward known; hospitalizations from hos-pitals with more than 10 discharges; all hospitalizations were included except those for transfers to another hospi-tal (to avoid including the inpatient episode twice, given that often the cause of the transfer was lack of procedure facilities); and hospitalizations with LOS ≥ 1 day.
With these criteria, we selected 12,078 hospitalizations occurring in 43 public NHS hospitals (Figure 1).
Dependent variable
The dependent variable was the number of days between the hospital admission and discharge dates (LOS). Death was assumed to be the outcome of interest and censoring was considered when patients were alive at discharge.
Covariates
Discharge level variables
admission (urgent or planned), the type of DRG (medical or surgical), the HIV infection related complication (pneumonia, tuberculosis, pneumocystis pneumonia (PCP), hepatitis B and C), the patient's residential region (North, Centre, Lisbon and Tagus valley, and South). Spe-cific data on income, education, and other components of socioeconomic status (SES) were not available. Therefore, we utilized the type of admission variable as a proxy for SES as in Barbour et al. [6]. The Euclidean distance from hospital to the centroid of the patient's residential ward in kilometres was calculated. Whether the patient lived in the catchment area of the hospital was another distance covariate. In addition, the number of diagnoses and the number of procedures undertaken were also available for each hospitalization. In the exploratory analysis, age, number of diagnoses and procedures were divided into two categories according to their median value (age: ≤ 39, >39 years; number of diagnoses ≤ 5, >5; and number of procedures ≤ 8, >8). The distance was categorized accord-ing to its average value of 13 km.
Group-level variables (hospital characteristics)
The following information was available to characterize the NHS hospital: the hospital size represented by the number of beds (500 beds maximum and greater than 500 beds); classifications according to NHS administra-tive structure (hospitals offering more differentiated serv-ices denoted central).
Statistical analysis
Descriptive statistics were computed for all variables: means, medians, and standard deviations for continuous
variables, and frequencies and percentages for categorical variables.
Kaplan-Meier (KM) estimators were applied to estimate survival curves, and log rank tests and Peto tests were used for comparison between variables categories.
Cox proportional hazard models [13] were used to iden-tify independent predictors of hospital mortality and cal-culate hazard ratios (HR).
To take into account the left truncation of the survival dis-charge data we adopted the Cox model with a counting process approach and also included random effects to deal with covariates hierarchy denoted frailty models. This random effect can be thought of as a "frailty", increas-ing hospital's susceptibility to short survival time when it is large, and decreasing this susceptibility when it is small.
The equation λ (t|x)= zλ0(t)exp(xβ) describes the frailty
model where x are the covariates matrix, β are the fixed
effect vector, and Z is a random variable representing an unknown random effect, and related to hospitals, with unit mean and variance ξ. These random effects act multi-plicatively on the baseline hazard, and large values of ξ reflect a great degree of heterogeneity among hospitals. Groups with frailty >1 tend to experience the event at a faster rate than under the basic Cox model, indicating in our case a poor hospital performance. On the other hand, when frailty is <1, survival times tend to be longer. It should be noted that when the variance of Z approaches
zero, the model reduces to the basic Cox model. For model distribution purposes, we assumed that the frailties were distributed according to a gamma distribution [14]. One attractive feature of the gamma distribution is that it is mathematically tractable. Frailty models were treated as a penalized Cox model [15] and were estimated using the survival package from R software.
To build the model, we first included in a classic Cox sur-vival model only the hospitalization level and group level variables which were statistically significant at the 10% level in KM analysis; thereafter the random effects were added. To compare the Cox model and the Frailty model, we applied the likelihood ratio (LR) test. All the statistical analyses were performed using R statistical software [16].
Results
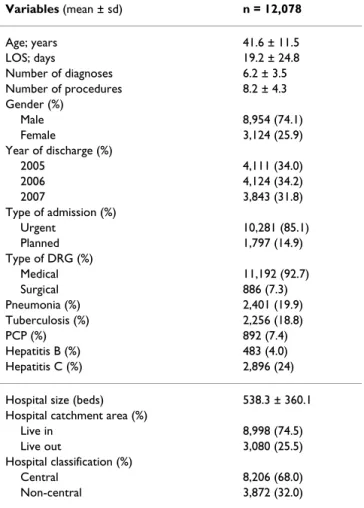
In this study the median LOS was equal to 12 days (inter-quartile range 6–24). Summary statistics of the hospitali-zation according to discharge episodes and hospital characteristics are in Table 1.
Out of 12,078 discharges, 8,954 (74.1%) were male and the median age was 42 years. The number of discharges
Selection profile of study population
Figure 1
decreased 7.8% in the last year of the study. There were 10,281 (85.1%) urgent admissions and the majority of the discharges (92.7%) had medical DRG. Over the three years of study, the most common HIV related complica-tions were pneumonia and tuberculosis, accounting for 19.9% and 18.7% of the discharges, respectively. The end-point death occurred in 15.2% (1,833) of the hospitaliza-tions.
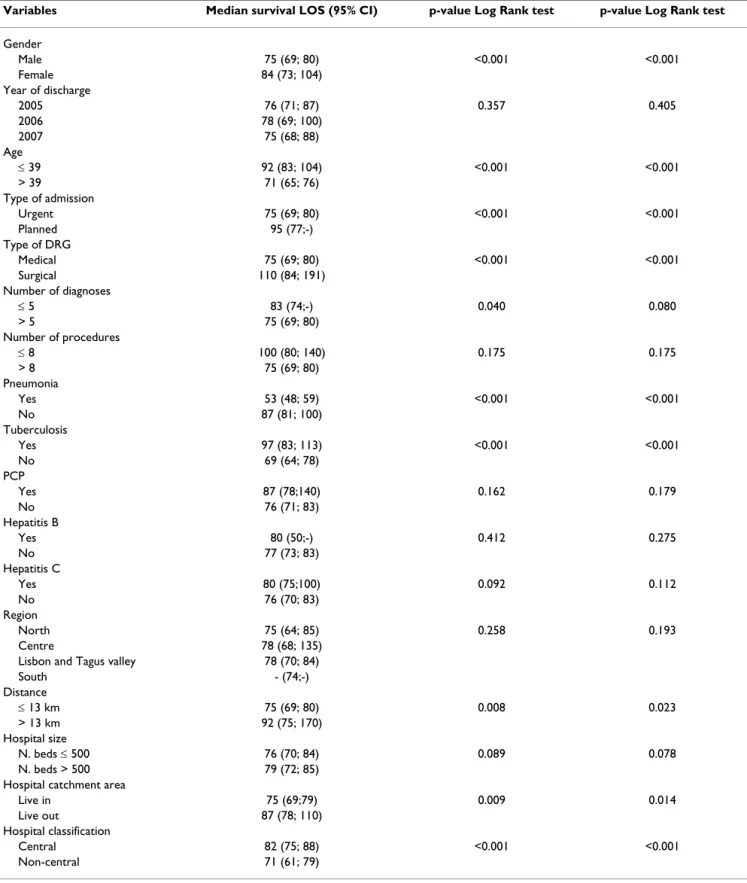
KM exploratory analysis suggests that hospitalization from older patients, men, urgently admitted, and those with medical DRG were associated with a faster progres-sion to death (Figure 2).
For these four variables log rank and Peto tests for KM sur-vival differences were all highly significant (p < 0.001). Hospitalization with a greater number of diagnoses and procedures also presented lower survival. The main HIV related infection complication risk factor for survival was pneumonia, which is also statistically significant, as can be seen from Table 2. Patients with tuberculosis showed a high median survival LOS and this was also statistically significant. There was no statistically significant difference between presences or absence of PCP and hepatitis B. Hepatitis C was statistically significant at the 10% level. The year of discharge and the patient's residential region did not yield significant survival differences. Both Eucli-dean distance and catchment area presented statistically significant differences in KM survival curves. However, because they are highly associated and the former did not represent the real distance between hospital and patient residence, living in the hospital catchment area was cho-sen to be included in the survival model as a proxy of res-idential distance to hospital.
The two hospital characteristics provided KM survival curves differences statistically significant at the 10% level.
The variables thus selected and included in the model were: gender, age, type of admission, type of DRG, number of diagnoses, number of procedures, pneumonia, tuberculosis, hepatitis C, living in hospital catchment area, hospital size, and hospital classification. Table 3 shows the HR for each covariate in the Cox survival mod-els with and without frailty. From the frailty model, men increase the risk, as expected, by 27.0% in comparison to women. Each additional year of age leads to an increase in risk of 1.3%. Urgent admission presents the highest risk, increasing it by 60% in comparison with programmed admission. Surgical DRG reduces the risk of death by 44%. Each additional diagnosis raises the hospital mortal-ity risk by only 2%. Pneumonia is the most serious HIV related infection complication, raising the risk by 43%, while tuberculosis presents a protective effect, reducing the risk by 22%. Hepatitis C and live in hospital
catch-ment area were not important predictors to hospital mor-tality. Parameter estimates of individual covariates are quite similar for both models.
Regarding hospital covariates, the hospital size presents statistical significance only in the Cox model without frailty. Nonetheless, large hospitals (>500 beds) present a hazard of 1.14 greater than smaller hospitals. The central hospital presents statistically significant difference from non-central hospital in both models and can be consid-ered to be a protective factor, decreasing the hazard by 20%.
The inclusion of a frailty effect expands the coefficient 95% confidence intervals of the hospital characteristics, and the hospital size loses statistical significance. The esti-mated frailty variance (0.032) is statistically significant (p = 0.002) and indicates the presence of a small variability among Portuguese NHS hospitals (Figure 3). The hospi-tals specific HRs, varying from 0.67 to 1.34, are presented in Figure 3 with their respective 95% confidence interval. Notably, there is only one hospital with frailty signifi-cantly greater than 1 and there is also one hospital with
Table 1: Characteristics of HIV discharges in Portuguese NHS hospitals
Variables (mean ± sd) n = 12,078
Age; years 41.6 ± 11.5
LOS; days 19.2 ± 24.8
Number of diagnoses 6.2 ± 3.5
Number of procedures 8.2 ± 4.3
Gender (%)
Male 8,954 (74.1)
Female 3,124 (25.9)
Year of discharge (%)
2005 4,111 (34.0)
2006 4,124 (34.2)
2007 3,843 (31.8)
Type of admission (%)
Urgent 10,281 (85.1)
Planned 1,797 (14.9)
Type of DRG (%)
Medical 11,192 (92.7)
Surgical 886 (7.3)
Pneumonia (%) 2,401 (19.9)
Tuberculosis (%) 2,256 (18.8)
PCP (%) 892 (7.4)
Hepatitis B (%) 483 (4.0)
Hepatitis C (%) 2,896 (24)
Hospital size (beds) 538.3 ± 360.1
Hospital catchment area (%)
Live in 8,998 (74.5)
Live out 3,080 (25.5)
Hospital classification (%)
Central 8,206 (68.0)
frailty significantly less than 1. Hospital number 1 (with frailty significantly less than 1) corresponds to a large teaching central hospital in a metropolitan area, while hospital number 43 (with frailty significantly greater than 1) is a non-central hospital in a smaller area.
Discussion
To our knowledge, this is the first paper that applies hier-archical modelling to account for hospital and individual characteristics among HIV/AIDS discharges in Portugal. Risk factors for mortality in the frailty model included male gender, older age, urgent admission, medical DRG, a higher number of diagnoses, pneumonia, and admis-sion to a non-central hospital.
The discharge variables included in the model behaved as expected. In Portuguese NHS hospitals, as well as in those of other countries [17,18], men are associated with a
higher risk of death due to HIV/AIDS than are women. Urgent admission presents the highest hazard ratio. Con-sidered as a proxy for SES, this finding confirms the results obtained in previous studies, where patients with urgent admission are of lower SES when compared to patients with programmed admission [19,20]. On the contrary, we find that surgical hospitalizations yield the lowest risk rates, reducing the risk of death by 44%. This result was somehow expected since the patients hospitalized to sur-gical procedures usually have a well established clinical situation, better than a patient with a non-surgical hospi-talization. In consonance with, the double percentage of planned admission in surgical hospitalization compared with the one in non-surgical hospitalization can be used to strengthen this hypothesis. We also have to consider the fact that DRG data is designed to be a financial system which determines how hospital will be reimbursed. The predetermined DRG reimbursement is based on principal
KM estimates of survival for selected variables: gender, age, type of admission and type of DRG
Figure 2
Table 2: Kaplan-Meier survival estimator of 12,078 HIV hospitalizations
Variables Median survival LOS (95% CI) p-value Log Rank test p-value Log Rank test
Gender
Male 75 (69; 80) <0.001 <0.001
Female 84 (73; 104)
Year of discharge
2005 76 (71; 87) 0.357 0.405
2006 78 (69; 100)
2007 75 (68; 88)
Age
≤ 39 92 (83; 104) <0.001 <0.001
> 39 71 (65; 76)
Type of admission
Urgent 75 (69; 80) <0.001 <0.001
Planned 95 (77;-)
Type of DRG
Medical 75 (69; 80) <0.001 <0.001
Surgical 110 (84; 191)
Number of diagnoses
≤ 5 83 (74;-) 0.040 0.080
> 5 75 (69; 80)
Number of procedures
≤ 8 100 (80; 140) 0.175 0.175
> 8 75 (69; 80)
Pneumonia
Yes 53 (48; 59) <0.001 <0.001
No 87 (81; 100)
Tuberculosis
Yes 97 (83; 113) <0.001 <0.001
No 69 (64; 78)
PCP
Yes 87 (78;140) 0.162 0.179
No 76 (71; 83)
Hepatitis B
Yes 80 (50;-) 0.412 0.275
No 77 (73; 83)
Hepatitis C
Yes 80 (75;100) 0.092 0.112
No 76 (70; 83)
Region
North 75 (64; 85) 0.258 0.193
Centre 78 (68; 135)
Lisbon and Tagus valley 78 (70; 84)
South - (74;-)
Distance
≤ 13 km 75 (69; 80) 0.008 0.023
> 13 km 92 (75; 170)
Hospital size
N. beds ≤ 500 76 (70; 84) 0.089 0.078
N. beds > 500 79 (72; 85)
Hospital catchment area
Live in 75 (69;79) 0.009 0.014
Live out 87 (78; 110)
Hospital classification
Central 82 (75; 88) <0.001 <0.001
diagnosis, procedures, patient age and sex, the presence of complications or comorbidities, surgical intervention and, discharge type. However, this homogeneous form of calculating the hospital reimbursement causes serious financial losses to hospital when the primary mode of therapy associated with the hospitalization is surgical. A surgical procedure will imply the use of an operating room which will have a great influence on the hospital means used by the patient and in the final costs [21]. Accordingly, the DRG type was introduced in Cox model to control the effect of DRG case mix.
Pneumonia was also a strong predictor of hospital mortal-ity in our study. Patients with pneumonia were 1.43 times more likely to die when compared to those without pneu-monia. This finding is in accordance with studies from Europe [22] and North America [23] showing that pneu-monia is an important predictor of mortality in patients with HIV/AIDS.
On the other hand, tuberculosis has been associated with improved survival [24-27]. In our study, tuberculosis was also associated with better hospital survival, reducing the risk of death by 22%. This protective effect relies on the fact that tuberculosis incidence rate (34.4/100,000 inhab-itants) in Portugal is one of the highest in Europe [28] and, it is the first disease diagnosed in HIV infection patients. Therefore, tuberculosis HIV patients are hospital-ized sooner than other patients and begin HAART treat-ment earlier.
The issue of whether hepatitis C effects progression of HIV-disease remains controversial [29]. In the Swiss Cohort, the presence of hepatitis C was independently associated with an increased risk of progression to AIDS and death [30]. However subsequent studies from other cohorts, did not find any differences in survival when
multivariate analysis was applied. For example, the EuroS-IDA cohort found no difference between hepatitis C posi-tive and hepatitis C negaposi-tive HIV-infected patients [31]. In our study, hepatitis C is not associated with hospital mor-tality after adjustment for other covariates.
The number of diagnoses and procedures for a particular patient express the complications and co-morbidities that the patient had during hospital stay. A great number of diagnoses or procedures usually indicates a more severe condition of the patient [32]. In this analysis only the number of diagnoses was statistically significant increas-ing the mortality risk by 2% for each increase in the number of diagnoses.
Hospital size was measured in terms of number of beds. Lee and collaborators [33] have shown that efficient hos-pitals had fewer beds than inefficient hoshos-pitals, everything else being constant. Based on this evidence, we expected that smaller hospital had a lower risk of death. However, in our study, hospital size only suggests a statistically sig-nificant increase in hospital mortality risk in the Cox Model without frailties.
The present study found that there are significant differ-ences in hospital mortality due to hospital classification. The risk of death is reduced by 20% in a central hospital when compared to a non-central hospital. This finding is somewhat expected since in Portugal the follow-up of patients with HIV/AIDS is more frequent in central hospi-tals, where anonymity is guaranteed; often, patients only attend non-central health services when they are in a seri-ous acute situation. Additionally, it is well known that dedicated AIDS units and management hospitals offer important benefits to AIDS patients [34] and in Portugal, central hospitals are the only ones that have communica-ble diseases department.
Table 3: Cox proportional hazards models for hospital mortality
No frailty Frailty
Variables HR (95% CI) p-value HR (95% CI) p-value
Gender (male) 1.268 (1.13; 1.42) <0.001 1.272 (1.14; 1.43) <0.001
Age (years) 1.013 (1.01; 1.02) <0.001 1.013 (1.01; 1.02) <0.001
Type of admission (urgent) 1.699 (1.43; 2.02) <0.001 1.592 (1.33; 1.91) <0.001
Type of DRG (surgical) 0.569 (0.47; 0.69) <0.001 0.560 (0.46; 0.68) <0.001
Number of diagnoses 1.018 (1.00; 1.03) 0.012 1.020 (1.01; 1.04) 0.012
Number of procedures 0.997 (0.98; 1.01) 0.580 0.994 (0.98;1.01) 0.360
Pneumonia 1.428 (1.29; 1.59) <0.001 1.431 (1.29; 1.59) <0.001
Tuberculosis 0.779 (0.69; 0.88) <0.001 0.783 (0.69; 0.88) <0.001
Hepatitis C 1.013 (0.90; 1.14) 0.820 1.011 (0.90; 1.14) 0.850
Hospital size (>500 beds) 1.118 (1.01; 1.24) 0.033 1.145 (0.93; 1.41) 0.210
Live in catchment area 1.032 (0.92; 1.15) 0.590 1.011 (0.90; 1.14) 0.850
Central hospital 0.798 (0.72; 0.89) <0.001 0.808 (0.68; 0.97) 0.002
Living in the catchment hospital area was used as a proxy of residential distance to hospital based on the evidence that increased distance was associated with increased risk of death [35-37]. However, in our study this variable was not statistically significant in both models.
The frailty model estimated a small variability among hos-pitals (range 0.67 to 1.34), although it is statistically sig-nificant. Standard single-level models, usually adopted in these studies, treat all hospitalizations as independent observations. Actually, patients are nested in hospitals on the basis of reasons that lead them to make some choices (place of residence, trust in a particular doctor, the hospi-tal's reputation, etc), thus violating one of the basic assumptions of traditional regression analysis. In hierar-chical models the random variability of data is divided into two parts: variation between different hospitaliza-tions and between different hospitals. The hospital frailty component should be interpreted as differences in hospi-tal quality/performance.
Consequently, hierarchical modelling is strongly advo-cated as a more appropriate statistical method for dealing with data clustered within hospitals [38-42]. This is the one of the strengths of our study, taking into account the hierarchical nature of the DRG data.
The frailty model revealed a variation in risk not resulting from any of the measured covariates. One possible expla-nation for this variability might be the differences in hos-pital accessibility and services availability. Due to the inexistence of a variable for measuring the accessibility, one way to incorporate this could be through the investi-gation of a geographical pattern in the frailty of hospitals [42,43]. In this study, we used the catchment area, but this variable was not statistically significant in the frailty model. Additional research is needed here.
Study limitations
This study, like most studies, has limitations. The DRG data cannot account for multiple admissions, reducing
Frailty model estimates of HR of hospitals showing the point estimate (circle) and their respective 95% CI band
Figure 3
our experimental unit to discharge episode instead of patient. It should be stressed that the information on hos-pital characteristics was gathered for other purposes than this study and some vital features of HIV/AIDS patients are missing, such as CD4 counts and viral load [9,44].
Conclusion
The use of DRG data is crucial in comparing different hos-pitals, patients, and places. Moreover, the frailty model used in this study proved to be useful for this purpose. Nonetheless, it is a strong candidate to be a very efficient tool for the state health authorities, due to software avail-ability. Accounting for clustering of observations, the frailty model provides truthful estimates of standard errors and assures less biased results. Our findings sug-gested that, for healthcare policy purposes, the hospitals should not be treated in an equal manner; namely the one identified as outlier.
For future developments we intend to construct a joint spatial survival model to investigate factors that affect HIV hospital mortality and taking into account geographical factors. This work can contribute to the debate on the eval-uation of a hospital's performance on HIV treatment. Also, our results might help hospital managers/practition-ers undmanagers/practition-erstand the major predictors of HIV related mortal-ity and to look at it in a different way.
Finally, local investigation of higher risk hospitals should be undertaken in order to disclose factors leading to dif-ferences in the HIV mortality risk detected in this study.
Competing interests
The authors declare that they have no competing interests.
Authors' contributions
SSD, VA and MOM performed the statistical analysis and helped to draft the manuscript. JT helped to draft the man-uscript. All authors read and approved the final manu-script.
Acknowledgements
The research of this paper was funded by the Portuguese agency Fundação para a Ciência e Tecnologia, providing PhD support to SSD.
The authors thank the Central Administration of Health System (ACSS), which provided the data.
References
1. Egger M, May M, Chene G, Phillips AN, Ledergerber B, Dabis F, Cos-tagliola D, d'Arminio MA, Reiss P, Lundgren JD, et al.: Prognosis of HIV-I-infected patients starting highly active antiretroviral therapy: a collaborative analysis of prospective sudies. Lancet 2002, 360:119-129.
2. Mocroft A, Vella S, Benfield TL, Chiesi A, Miller V, Gargalianos P, d'Arminio MA, Yust I, Bruun JN, Phillips AN, et al.: Changing pat-terns of mortality across Europe in patients infected with HIV-I. EuroSIDA Study Group. Lancet 1998, 352:1725-1730.
3. De que se morre mais em Portugal. As principais causas de morte em Portugal de 1990–1999 [http://www.onsa.pt/conteu/ est_proj_dqmorrem.html]
4. UNAIDS: AIDS epidemic update: December 2007. WHO. Geneva: UNAIDS; 2007.
5. Infecção VIH/SIDA. A situação em Portugal, 30 de Junho de 2007 [http://www.portaldasaude.pt/portal/conteudos/ a+saude+em+portugal/publicacoes/estudos/sida+junho+2007.htm] 6. Barbour KE, Fabio A, Pearlman DN: Inpatients charges among
HIV/AIDS patients in Rhode Island from 2000–2004. BMC Health Services Research 2009, 9(3):.
7. Sistema de Classificação de Doentes em Grupos de Diagnós-ticos Homogéneos (GDH) [http://www.acss.min-saude.pt] 8. Regulamento das tabelas de preços das instituições e dos
serviços integrados no serviço nacional de saúde [http:// www.dre.pt/]
9. Krentz HB, Dean S, Gill MJ: Longitudinal assessment (1995– 2003) of hospitalizations of HIV-infected patients within a geographical population in Canada. HIV Med 2006, 7(7):457-466.
10. Diagnostic data of the hospitals starting from 2000 (cases/ deaths, cases per 100,000 inhabitants, days of care, average length of stay). Classification: years, place of residence, age, sex, length of stay, ICD10 [http://www.gbe-bund.de/gbe10/ pkg_isgbe5.prc_isgbe?p_uid=gast&p_aid=&p_sprache=E]
11. Huang ZHJ, LaFleur BJ, Chamberlain JM, Guagliardo MF, Joseph JG: Inpatient childhood asthma treatment – Relationship of hos-pital characteristics to length of stay and cost: Analyses of New York State discharge data, 1995. Archives of Pediatrics & Adolescent Medicine 2002, 156(1):67-72.
12. Wang K, Yau KKW, Lee AH: A hierarchical Poisson mixture regression model to analyse maternity length of stay. Statis-tics in Medicine 2002, 21:3639-3654.
13. Cox DR: Regression models and life-tables. Journal of the Royal Statistical Society, Series B 1972, 34:187-201.
14. Clayton DG: A model for association in bivariate life tables and its application in epidemiological studies of familial ten-dency in chronic disease incidence. Biometrika 1978, 65:141-151.
15. Therneau T, Grambsche P: Modeling Survival Data New-York: Springer-Verlag; 2000.
16. Team RDC: R: A language and Environment for Statistical Computing. 2.8.0 edition. Vienna, Austria: The R foundation for statistical computer; 2008.
17. Torti C, Lapadula G, Maggiolo F, Casari S, Suter F, Minoli L, Pezzoli C, Di Pietro M, Migliorino G, Quiros-Roldan E, et al.: Predictors of AIDS-defining events among advanced naive patients after HAART. HIV Clin Trials 2007, 8(3):112-120.
18. Johannessen A, Naman E, Ngowi BJ, Sandvik L, Matee MI, Aglen HE, Gundersen SG, Bruun JN: Predictors of mortality in HIV-infected patients starting antiretroviral therapy in a rural hospital in Tanzania. BMC Infect Dis 2008, 8:52.
19. Pollock AM, Vickers N: Deprivation and emergency admissions for cancers of colorectum, lung, and breast in south east England: ecological study. British Medical Journal 1998, 317:245-252.
20. Majeed FA, Cook DG, Anderson HR, Hilton S, Bunn S, Stones C: Using Patient and General-Practice Characteristics to Explain Variations in Cervical Smear Uptakes Rates. British Medical Journal 1994, 308:1272-1276.
21. Holloway NM: Medical-surgical care planning Fourth edition. Orinda: Lippincott Williams &Wilkins; 2003.
22. Puro V, Serraino D, Piselli P, Boumis E, Petrosillo N, Angeletti C, Ippolito G: The epidemiology of recurrent bacterial pneumo-nia in people with AIDS in Europe. Epidemiology and Infection 2005, 133(2):237-243.
23. Rodriguez-Barradas MC, Goulet J, Brown S, Goetz MB, Rimland D, Simberkoff MS, Crothers K, Justice AC: Impact of pneumococcal vaccination on the incidence of pneumonia by HIV infection status among patients enrolled in the veterans aging cohort 5-Site Study. Clinical Infectious Diseases 2008, 46(7):1093-1100. 24. Jones JL, Hanson DL, Dworkin MS, Decock KM: HIV associated TB
in the era of HAART. August 29 – September 1 1999; National HIV Prevention Conference, Atlanta 1999.
Publish with BioMed Central and every scientist can read your work free of charge
"BioMed Central will be the most significant development for disseminating the results of biomedical researc h in our lifetime."
Sir Paul Nurse, Cancer Research UK
Your research papers will be:
available free of charge to the entire biomedical community
peer reviewed and published immediately upon acceptance
cited in PubMed and archived on PubMed Central
yours — you keep the copyright
Submit your manuscript here:
http://www.biomedcentral.com/info/publishing_adv.asp
BioMedcentral the risk of tuberculosis among persons with HIV infection.
AIDS 2000, 14(13):1985-1991.
26. Girardi E, Palmieri F, Cingolani A, Ammassari A, Petrosillo N, Gillini L, Zinzi D, De Luca A, Antinori A, Ippolito G: Changing clinical presentation and survival in HIV-associated tuberculosis after highly active antiretroviral therapy. Journal of Acquired Immune Deficiency Syndromes 2001, 26(4):326-331.
27. Girardi E, Antonucci G, Vanacore P, Palmieri F, Matteelli A, Iemoli E, Carradori S, Salassa B, Pasticci MB, Raviglione MC, et al.: Tuberculo-sis in HIV-infected persons in the context of wide availability of highly active antiretroviral therapy. Eur Resp J 2004, 24(1):11-17.
28. Programa Nacional de Luta Contra a Tuberculose. Ponto da Situação Epidemiológica e de Desempenho. Ano 2003 [http:/ /www.dgs.pt/]
29. Rockstroh JK: Influence of viral hepatitis on HIV infection. Jour-nal of Hepatology 2006, 44:S25-S27.
30. Law WP, Duncombe CJ, Mahanontharit A, Boyd MA, Ruxrungtham K, Lange JMA, Phanuphak P, Cooper DA, Dore GJ: Impact of viral hepatitis co-infection on response to antiretroviral therapy and HIV disease progression in the HIV-NAT cohort. Aids 2004, 18(8):1169-1177.
31. Rockstroh J, Konopnicki D, Soriano V, Kirk O, Antunes F, Knysz B, Tural C, Wit SD, Mocroft A, Lundgren J: Hepatitis B and Hepatitis C in the EuroSIDA Cohort: Prevalence and Effect on Mortal-ity, AIDS Progression and Response to HAART. 11th Confer-ence on retroviruses and opportunistic infections: Feb 8 – 11 2004; San Francisco, CA, USA 2004.
32. Xiao J, Lee AH, Vemurri SR: Mixture distribution analysis of length stay for efficient funding. Socio-Economic Planning Sciences 1999, 33:39-59.
33. Lee KS, Chun KH, Lee JS: Reforming the hospital service struc-ture to improve efficiency: Urban hospital specialization. Health Policy 2008, 87(1):41-49.
34. Aiken LH, Sloane DM, Lake ET, Sochalski J, Weber AL: Organiza-tion and outcomes of inpatient AIDS care. Medical Care 1999, 37(8):760-772.
35. Nicholl J, West J, Goodacre S, Turner J: The relationship between distance to hospital and patient mortality in emergencies: an observational study. Emergency Medicine Journal 2007, 24(9):665-668.
36. Reif S, Golin CE, Smith SR: Barriers to accessing HIV/AIDS care in North Carolina: Rural and urban differences. Aids Care-Psy-chological and Socio-Medical Aspects of Aids/Hiv 2005, 17(5):558-565. 37. Heckman TG, Somlai AM, Peters J, Walker J, Otto-Salaj L, Galdabini
CA, Kelly JA: Barriers to care among persons living with HIV/ AIDS in urban and rural areas. Aids Care-Psychological and Socio-Medical Aspects of Aids/Hiv 1998, 10(3):365-375.
38. Greenland S: Principles of multilevel modelling. International Journal of Epidemiology 2000, 29:158-167.
39. Diez-Roux AV: Multilevel analysis in public health research. Annual Review of Public Health 2000, 21:171-192.
40. Leyland A, Goldstein H: Multilevel modelling of health statistics New York: Wiley; 2001.
41. Bingenheimer JB, Raudenbush SW: Statistical and substantive inferences in Public Health: Issues in the Application of Mul-tilevel Models. Annual Review of Public Health 2004, 25:53-77. 42. Carvalho MS, Henderson R, Shimakura S, Sousa I: Survival of
hemo-dialysis patients: modeling differences in risk of hemo-dialysis cent-ers. Int J Qual Health Care 2003, 15(3):189-196.
43. Henderson R, Shimakura S, Gorst D: Modeling spatial variation in leukemia survival data. Journal of the American Statistical Association 2002, 97(460):965-972.
44. Cacala SR, Mafana E, Thomson SR, Smith A: Prevalence of HIV sta-tus and CD4 counts in a surgical cohort: their relationship to clinical outcome. Annals of the Royal College of Surgeons of England 2006, 88(1):46-51.
Pre-publication history
The pre-publication history for this paper can be accessed here: