Rev Saúde Pública 2013;47(4):1-13 Original Articles DOI: 10.1590/S0034-8910.2013047003657
Rosa Lívia Freitas de AlmeidaI José Gomes Bezerra FilhoI José Ueleres BragaII Francismeire Brasileiro MagalhãesIII
Marinila Calderaro Munguba MacedoIV
Kellyanne Abreu SilvaV
I Departamento de Saúde Comunitária.
Faculdade de Medicina. Universidade Federal do Ceará. Fortaleza, CE, Brasil
II Departamento de Medicina Interna.
Universidade do Estado do Rio de Janeiro. Rio de Janeiro, RJ, Brasil
III Programa de Pós-Graduação em
Associação Ampla: Universidade Estadual do Ceará. Universidade Federal do Ceará. Universidade de Fortaleza. Fortaleza, CE, Brasil
IV Faculdade de Medicina do Cariri.
Universidade Federal do Ceará. Fortaleza, CE, Brasil
V Programa de Pós-Graduação em Saúde
Pública. Faculdade de Medicina. Universidade Federal do Ceará. Fortaleza, CE, Brasilo
Correspondence:
Rosa Lívia Freitas de Almeida Departamento de Saúde Comunitária Faculdade de Medicina – UFC
Rua Prof. Costa Mendes, 1608 5° andar – Rodolfo Teófi lo
60430-140 Fortaleza, CE, Brasil E-mail: [email protected] Received: 8/18/2011 Approved: 2/21/2013
Article available from: www.scielo.br/rsp
Man, road and vehicle: risk
factors associated with the
severity of traffi c accidents
ABSTRACT
OBJECTIVE: To describe the main characteristics of victims, roads and vehicles involved in traffi c accidents and the risk factors involved in accidents resulting in death.
METHODS: A non-concurrent cohort study of traffi c accidents in Fortaleza, CE, Northeastern Brazil, in the period from January 2004 to December 2008. Data from the Fortaleza Traffi c Accidents Information System, the Mortality Information System, the Hospital Information System and the State Traffi c Department Driving Licenses and Vehicle database. Deterministic and probabilistic relationship techniques were used to integrate the databases. First, descriptive analysis of data relating to people, roads, vehicles and weather was carried out. In the investigation of risk factors for death by traffi c accident, generalized linear models were used. The fi t of the model was verifi ed by likelihood ratio and ROC analysis.
RESULTS: There were 118,830 accidents recorded in the period. The most common types of accidents were crashes/collisions (78.1%), running over pedestrians (11.9%), colliding with a fi xed obstacle (3.9%), and with motorcycles (18.1%). Deaths occurred in 1.4% of accidents. The factors that were independently associated with death by traffi c accident in the fi nal model were bicycles (OR = 21.2, 95%CI 16.1;27.8), running over pedestrians OR = 5.9 (95%CI 3.7;9.2), collision with a fi xed obstacle (OR = 5.7, 95%CI 3.1;10.5) and accidents involving motorcyclists (OR = 3.5, 95%CI 2.6;4.6). The main contributing factors were a single person being involved (OR = 6.6, 95%CI 4.1;10.73), presence of unskilled drivers (OR = 4.1, 95%CI 2.9;5.5) a single vehicle (OR = 3.9, 95%CI 2,3;6,4), male (OR = 2.5, 95%CI 1.9;3.3), traffi c on roads under federal jurisdiction (OR = 2.4, 95%CI 1.8;3.7), early morning hours (OR = 2.4, 95%CI 1.8;3.0), and Sundays (OR = 1.7, 95%CI 1.3;2.2), adjusted according to the log-binomial model.
CONCLUSIONS: Activities promoting the prevention of traffi c accidents should primarily focus on accidents involving two-wheeled vehicles that most often involves a single person, unskilled, male, at nighttime, on weekends and on roads where they travel at higher speeds.
2 Man, road and vehicles: accident risk Almeida RLF et al
Traffi c accidents remain a signifi cant public health problem in Brazil and preventative activities require different approaches. The dynamic of this multi-causal phenomenon affects victims to different degrees depending on the type of accident (run over pedes-trian, motorbike accident or another type of accident involving a vehicle or motorbike)1 and demographic
characteristics (sex, age, skin color, marital status and schooling).12,20 Monthly distribution is differentiated
by day of the week and time of day.5 Research using
analysis techniques to understand these characteristics are relevant to redirecting activities aiming to reduce the severity of the accidents.
The factors involved, implicitly or explicitly, which can contribute to a greater or lesser extent to casuistry are: man; vehicle; road and environment; and factors refer-ring to legislation and complying with it.4 Separating
these factors and studying their associations is neces-sary in order to better understand and intervene in the phenomenon of traffi c accidents. This is because these factors combined may increase the likelihood of acci-dents in different ways in specifi c areas.a,b
A signifi cant number of studies in Brazil have looked at fatalities due to traffi c accidents. However, there are few studies that deal with survivors of these accidents, which has led some authors to emphasize the impor-tance of research into non-fatal accidents.9,10,14,18,c In
addition to being scarce, these studies make use of different methodologies different sources of data. A large part of this output refers to problems with the coverage and quality of the offi cial information systems as limiting factors to understanding this phenomenon.20
For specialists, the lack of an integrated information system based on standardized police reports of traffi c accidents makes it impossible to really know the situation of traffi c accidents in the country and, there-fore, makes it impossible to put in place appropriate measures to mitigate it.7 As a way of overcoming this
diffi culty, techniques to relate databases were used in order to improve the quality of information on the number of variables investigated and the number of valid records, achieving more complete information. This study aimed to describe characteristics of the victims, the roads and the vehicles involved in traffi c accidents and risk factors for fatal accidents.
INTRODUCTION
METHODS
A non-concurrent cohort study of traffi c accidents that occurred within the geographical limits of Fortaleza, CE, Northeastern Brazil, between January 1st 2004
and December 31st 2008. The incidents covered those
registered in Police Incident Reports (PI) recorded in the Fortaleza Traffi c Accidents Information System (SIAT-FOR) and run by the Fortaleza Municipal Transit Authority (AMC). A traffi c accident was deemed to be any incident that occurred on a public road, including not only crashes between vehicles but also collisions with fi xed objects, collisions between pedestrians and cyclists, vehicles overturning, running over pedestrians and vehicles leaving the road.17 Criteria for inclusion
were the accident being recorded in a PI, with or without injuries or fatalities among the victims and accidents that were not recorded in a PI were excluded.
Fortaleza is a metropolitan agglomeration in the Northeast of Brazil and is classed as the fi fth largest city in the country. The urban area is crisscrossed by a 3,700 km network of roads. Of this total, around 35 km are under state jurisdiction and 25 km under federal jurisdiction.d The road layout follows a radio-centric
pattern and constituted the main connections between the urban area and neighboring municipalities. The roads are narrow as they originate in a layout defi ned when the city was founded and due to their use not being managed and a lack of control in occupation of the terrain, this makes it unviable to extend them and the system has become insuffi cient.e
Data were collected from the SIAT-FOR system, which includes ten bodies involved in dealing with traffi c accidents in the municipality.
Data from the Habilitação e Veículos do Departamento Estadual de Trânsito (DETRAN-CE – State Traffi c Department Driving Licenses and Vehicle) database were also used, as were data from the Informações de Mortalidade (SIM – Mortality Information System), which contains death certifi cates and data from the Sistema de Informações Hospitalares (SIH – Hospital Information System), with the aim of obtaining comple-menting the data. Databases on hospitalization and deaths (SIH and SIM) were accessed through the Ceará State Department of Health (SESA). The data from the SIM refer to all deaths that occurred in Ceará between
a Raia Jr AA, Santos L. Acidente zero: utopia ou realidade? 15º Congresso brasileiro de transporte e trânsito. 2005; Goiânia, BR, Goiânia:
Centro de Convenções de Goiânia; 2005. p.7.
b Raia Jr AA. Identifi cação de pontos críticos de acidentes de trânsito no Município de São Carlos, SP, Brasil: análise comparativa entre
um banco de dados relacional – BDR e a técnica de Agrupamentos pontuais. Anais do 2º Congresso Luso Brasileiro para o Planejamento, Urbano, Regional, Integrado, Sustentável, 2006; Braga, PT, Braga: Universidade do Minho; 2006.
c Soares DFPP. Acidentes de trânsito em Maringá-PR: Análise do perfi l epidemiológico e dos fatores de risco de internação e de óbito. 2003
[tese de doutorado]. Campinas: Universidade Estadual de Campinas; 2003.
d Departamento Nacional de Trânsito (BR). Anuário estatístico de acidentes de trânsito de Fortaleza - 2008. Ceará; 2009.
e Muniz MPC. O Plano Diretor Como Instrumento de Gestão da Cidade: o caso da cidade de Fortaleza/CE. Ceará: Universidade Federal do
3
Rev Saúde Pública 2013;47(4):1-13
January 2004 and March 2009, as accidents occurring in December may have led to death in 2009. Data on hospitalization in the Brazilian Unifi ed Health System (SUS) network in Fortaleza are for between January 2004 and July 2009, as requests for payment can be presented up to six months after being authorized. Data on vehicles and driving licenses were obtained from DETRAN-CE and refer to all vehicles and licenses in the state of Ceará up to December 31st,
2008.The variables investigated were categorized in four groups: characteristics of the victim, subdivided into socio-demographic characteristics, length of time driving and state of vehicle at the time of the accident; variables related to the time (year, time and week); jurisdiction of the road, location of the accident and illumination; type of accident, type and age of vehicle. The databases were linked using relationship techni-ques to create one single database containing infor-mation on the vehicle, the road, the driver and the individuals involved.
Two methods were used in this process: deterministic and probabilistic relationship techniques.6,13
Data on the accidents collected by the SIAT-FOR system were complemented according to the two types of relationship, involving two different stages. In the first, deterministic, stage the SIAT-FOR database, provided by the AMC, regarding vehicles which had been involved in traffi c accidents, was linked to the DETRAN-CE database using vehicle license plates to obtain information on the year and type of vehicle. Data on the driver: type and year of driving license, sex, marital status, level of schooling, date of birth and mother’s name were obtained from the database provided by DETRAN-CE based on the driving license number, registered in the SIAT-FOR system database of individuals involved in traffi c accidents.
Complementing the data concerning pedestrians and passengers involved in traffi c accidents was achieved by using probabilistic relationship technique, together with the SIM and SIH systems. The key variables were: name and age of victim and date of the accident when the individual died or was hospitalized in the SUS network. In order to analyze the traffi c accidents, a set of co-varia-bles was created based on the variaco-varia-bles described: type and number of vehicles involved, type and number of individuals, age of the vehicles, sex of the driver, status of the drivers’ licenses, length of time drivers had been driving and their age, marital status and schooling. Descriptive data were presented according to the varia-bles in question. Pearson’s Chi-squared test, Fisher’s exact test and the Student t-test were used in the compa-rative analysis. Estimated risk of a fatal accident was
verifi ed with bivariate analysis using the odds ratio, with a 95% confi dence interval. Variables which had an association with a fatal accident of p < 0.20 according to the Chi-squared test were selected to be included in the multinomial analysis.11
The multinomial analysis was carried out using the Generalized Linear Model (GLM) with binomial distribution and the logistic link function. The choice of this distribution was justifi ed as the measurement of the outcome was dichotomous.
The modelling followed the strategy recommended by Hosmer & Lemeshow11 and each variable was
withdrawn after comparison of the models’ likelihood ratio (-2logL) with and without the variable in question. Variables remained in the model according to theore-tical justifi cations and statistheore-tical signifi cance.
The fi nal model was assessed for sensitivity, specifi city accuracy and based on the percentage improvement of the model in relation to the initial deviance (likelihood ratio). The value of the area above the ROC curve was 0.86, indicating high discriminatory power.
The research was approved by the Ethics Committee of the Universidade Federal do Ceará (Process No. 90/2008).
RESULTS
There were 118,830 traffic accidents in Fortaleza between January 2004 and December 2008, 1.4% were fatal and 46.6% involved serious or minor injuries. Of the incidents, 78.1% were categorized as a cash/ collision and 11.9% were pedestrians run down, 3.9% were collisions with a fi xed obstacle, 0.5% involved the vehicle overturning and 5.6% involved the vehicle falling/leaving the road and other types of accidents on public roads (Table 1).
The annual mean number of accidents in the period was 23,767 accidents/year, and the highest number of incidents was recorded in 2008 (20.8%; p < 0.001). The monthly mean for the period was 1,981 accidents/month. The quarter from October to December stands out as having the highest number of accidents (mean of 6,382 accidents), while the January to March quarter had the lowest number of accidents (mean of 5,421 accidents; p < 0.001) (Table 1).
4
Man, road and v
ehicles: accident risk
Almeida RLF et al
Table 1. Absolute and relative frequency of traffi c accidents according to the variables studied and the year in which they occurred. Fortaleza, CE, Northeastern Brazil, 2004 to 2008.
Variable 2004 2005 2006 2007 2008 Accidents
n % n % n % n % n % n %
Type of accident
Crash/collision 17,381 76.1 18,074 74.8 18,093 77.2 18,912 79.8 20,387 82.7 92,847 78.1
Running over pedestrian 3,027 13.2 3,160 13.1 2,784 11.9 2,746 11.6 2,366 9.6 14,083 11.9
Fall/leaving road and other 1,441 6.3 1,784 7.4 1,494 6.4 981 4.1 925 3.8 6,625 5.6
Collision with a fi xed object 878 3.8 999 4.1 952 4.1 953 4.0 870 3.5 4,652 3.9
Vehicle overturned 126 0.6 155 0.6 120 0.5 108 0.5 114 0.5 623 0.5
Total 22,853 100.0 24,172 100.0 23,443 100.0 23,700 100.0 24,662 100.0 118,830 100.0
Vehicles involved
Only car/truck 9,622 42.1 10,761 44.5 10,267 43.8 10,430 44.0 10,857 44.0 51,937 43.7
Only motorcycles 1,941 8.5 2,238 9.3 2,161 9.2 1,966 8.3 1,852 7.5 10,158 8.5
With motorcycles 3,857 16.9 4,149 17.2 4,299 18.3 4,360 18.4 4,788 19.4 21,453 18.1
Heavy goods vehicles 3,568 15.6 3,396 14.0 3,534 15.1 3,888 16.4 4,678 19.0 19,064 16.0
With bicycles 2,226 9.7 2,328 9.6 2,051 8.7 1,599 6.7 1,552 6.3 9,756 8.2
Various vehicles 1,639 7.2 1,300 5.4 1,131 4.8 1,457 6.1 935 3.8 6,462 5.4
Total 100.0 100.0 100.0 100.0 100.0 100.0
Number of vehicles involved
One vehicle 5,383 23.6 6,013 24.9 5,289 22.6 4,713 19.9 4,177 16.9 25,575 21.5
Two vehicles 16,375 71.7 17,019 70.4 16,984 72.4 17,659 74.5 19,091 77.4 87,128 73.3
More than two vehicles 1,095 4.8 1,140 4.7 1,170 5.0 1,328 5.6 1,394 5.7 6,127 5.2
Total 100.0 100.0 100.0 100.0 100.0 100.0
Type of individual involved
Only driver 16,332 71.5 17,571 72.7 17,442 74.4 18,182 76.7 19,728 80.0 89,255 75.1
Passenger 1,352 5.9 1,211 5.0 1,246 5.3 1,251 5.3 1,113 4.5 6,173 5.2
Pedestrian and/or cyclist 5,169 22.6 5,390 22.3 4,755 20.3 4,267 18.0 3,821 15.5 23,402 19.7
Total 100.0 100.0 100.0 100.0 100.0 100.0
Number of individuals involved
One 2,130 9.3 2,615 10.8 2,269 9.7 1,781 7.5 1,701 6.9 10,496 8.8
Two 18,448 80.7 19,338 80.0 18,860 80.5 19,397 81.8 20,600 83.5 96,643 81.3
More than two 2,275 10.0 2,219 9.2 2,314 9.9 2,522 10.6 2,361 9.6 11,691 9.8
Total 100.0 100.0 100.0 100.0 100.0 100.0
5
Rev Saúde Pública 2013;47(4):1-13
Continuation
Type of intersection
Crossing 7,121 31.2 7,205 29.8 7,186 30.7 7,170 30.3 7,006 28.4 35,688 30.0
T and double T, Y, roundabout and other 829 3.6 1,002 4.1 1,179 5.0 1,219 5.1 1,233 5.0 5,462 4.6
Level crossing 60 0.3 54 0.2 59 0.3 61 0.3 30 0.1 264 0.2
Mid-block 14,843 64.9 15,911 65.8 15,019 64.1 15,250 64.3 16,393 66.5 77,416 65.1
Total 100.0 100.0 100.0 100.0 100.0 100.0
Jurisdiction
Municipal 21,331 93.3 22,627 93.6 21,907 93.4 21,811 92.0 22,385 90.8 110,065 92.6
State 1,048 4.6 994 4.1 991 4.2 1,122 4.7 1,199 4.9 5,354 4.5
Federal 474 2.1 551 2.3 545 2.3 767 3.2 1,078 4.4 3,415 2.9
Total 100.0 100.0 100.0 100.0 100.0 100.0
Type of road surface
Not asphalt 8,881 38.9 9,336 38.6 8,839 37.2 8,805 37.2 8,489 34.4 44,350 37.3
Asphalt 13,972 61.1 14,836 61.4 14,895 62.8 14,895 62.8 16,173 65.6 74,480 62.7
Total 100.0 100.0 100.0 100.0 100.0 100.0
Light
Daylight 12,481 67.5 13,145 67.0 12,785 66.8 13,246 67.6 14,357 68.9 66,014 67.6
Dawn 767 4.1 857 4.4 822 4.3 839 4.3 648 3.1 3,933 4.0
Dusk 2,213 12.0 2,359 12.0 2,293 12.0 2,218 11.3 2,245 10.8 11,328 11.6
Street lighting 2,224 12.0 2,481 12.7 2,531 13.2 2,629 13.4 2,933 14.1 12,798 13.1
Poor/no illumination 802 4.3 763 3.9 705 3.7 669 3.4 667 3.2 3,606 3.7
Total 100.0 100.0 100.0 100.0 100.0 100.0
Type of signs
Traffi c lights 3,491 17.3 4,166 18.6 4,297 19.5 4,291 19.3 4,557 19.4 20,802 18.9
Overhead 3,168 15.7 3,752 16.8 4,212 19.1 4,096 18.4 4,770 20.3 19,998 18.1
Lateral 13,540 67.0 14,452 64.6 13,487 61.3 13,895 62.4 14,170 60.3 69,544 63.0
Total 100.0 100.0 100.0 100.0 100.0 100.0
6
Man, road and v
ehicles: accident risk
Almeida RLF et al
Continuation
Time
Morning 6,084 27.2 6,466 27.3 6,223 27.2 6,519 28.0 7,375 30.4 32,667 28.1
Afternoon 7,755 34.6 8,202 34.7 8,100 35.4 8,192 35.2 8,646 35.7 40,895 35.1
Night 6,637 29.6 6,834 28.9 6,525 28.5 6,460 27.8 6,474 26.7 32,930 28.3
Early morning 1,912 8.5 2,143 9.1 2,053 9.0 2,098 9.0 1,741 7.2 9,947 8.5
Total 100.0 100.0 100.0 100.0 100.0 100.0
Week
Monday - Friday 15,334 67.1 15,898 65.8 15,684 66.9 16,314 68.8 17,820 72.3 81,054 68.2
Saturday and Sunday 7,519 32.9 8,274 34.2 7,759 33.1 7,386 31.2 6,842 27.7 37,780 31.8
Total 100.0 100.0 100.0 100.0 100.0 100.0
Day of the week
Wednesday 2,806 12.3 3,015 12.5 2,952 12.6 3,100 13.1 3,482 14.1 15,355 12.9
Thursday 3,110 13.6 3,076 12.7 3,177 13.6 3,141 13.3 3,397 13.8 15,901 13.4
Friday 3,780 16.5 3,711 15.4 3,572 15.2 3,778 15.9 3,996 16.2 18,837 15.9
Saturday 4,085 17.9 4,443 18.4 4,121 17.6 4,093 17.3 3,818 15.5 20,560 17.3
Sunday 3,434 15.0 3,831 15.8 3,638 15.5 3,293 13.9 3,024 12.3 17,220 14.5
Monday 2,912 12.7 3,122 12.9 3,097 13.2 3,270 13.8 3,495 14.2 15,896 13.4
Tuesday 2,726 11.9 2,974 12.3 2,886 12.3 3,025 12.8 3,450 14.0 15,061 12.7
Total 100.0 100.0 100.0 100.0 100.0 100.0
Quarter
January to March 5,042 22.1 5,377 22.2 5,573 23.8 5,351 22.6 5,761 23.4 27,104 22.8
April to June 5,915 25.9 5,982 24.7 5,940 25.3 5,857 24.7 6,305 25.6 29,999 25.2
July to September 5,686 24.9 6,330 26.2 5,844 24.9 5,963 25.2 5,993 24.3 29,816 25.1
October to December 6,210 27.2 6,483 26.8 6,086 26.0 6,529 27.5 6,603 26.8 31,911 26.9
7
Rev Saúde Pública 2013;47(4):1-13
any type of vehicle were in the minority throughout the period (5.2%). The mean number of individuals involved in accidents was 2.03 individuals/accident.
Almost two thirds (65.1%) of incidents occurred in moving traffi c, categorized as mid-block, followed by at intersections (30.0%); 67.6% occurred in daylight, 13.1% during the night on illuminated roads and 11.6% at dusk. Unlit or poorly lit streets accounted for 3.7% and 4.0% occurred at dawn; 63.2% of accidents occurred during the day. The afternoon, between 12.00 and 18.00, was the period in which the highest number of incidents were recorded (35.1%) (Table 1). Almost all incidents (92.6%) occurred under municipal jurisdiction, followed by state jurisdiction (4.5%), due to the distribution of jurisdiction in the city’s road network. Saturday was the day on which most accident occurred (17.3%), followed by Friday (15.9%) and Sunday (14.5%). Tuesdays and Wednesdays are the days on which fewest accidents occurred (12.7% and 12.9%, respectively) (Table 1).
In the bivariate analysis, accidents involving bicycles had the highest gross risk (OR = 3.95; 95%CI 3.44;5.17) of being fatal, based on accidents with automobiles or trucks. Accidents between motorcycles had the second highest gross risk of being fatal (OR = 2.88; 95%CI 2.48;3.34). Accidents involving one vehicle had a higher risk of fatalities (OR = 4.15; 95%CI 3.77;4.57) than accidents with two vehicles (Table 2).
Running over pedestrians (OR = 6.32; 95%CI 5.71;6.98) had a higher gross risk of being fatal, followed by accidents involving the vehicle overturning (OR = 4.90; 95%CI 3.32;7.24) and colliding with a
fi xed obstacle (OR = 3.57; 95%CI 2.98;4.28), compared with crashes or collisions (Table 2).
Individuals holding a license for fewer than fi ve years (OR = 1.78; 95%CI 1.52;2.08) had a higher gross risk of being involved in a fatal accident compared with drivers with more than fi ve years’ experience. Drivers without an appropriate license (OR = 1.95; 95%CI 1.74;2.18) had the highest risk of being involved in a fatal accident, compared with licensed drivers (Table 3). Accidents in moving traffi c or mid-block (OR = 2.02; 95%CI 1.79;2.19) had the highest gross risk of invol-ving fatalities and occurred with higher frequency, in contrast to accidents at level crossings (OR = 8.50; 95%CI 5.44;13.30), which carry a higher risk of fata-lity but occur with less frequency. Around 18.9% of incidents occurred at traffi c lights and do not carry a risk of fatalities compared with overhead road signs. Accidents involving lateral road signs (OR = 2.26; 95%CI 1.92;2.66) represented 63% of the total and had a gross risk of fatal accidents compared with overhead road signs (Table 1, Table 2).
The severity of the accidents proved to be more accen-tuated at a federal level federal (OR = 4.30; 95%CI 3.70;4.99), followed by a state level, compared with municipal. The gross risk of fatal accidents was higher at dusk (OR = 2.78; 95%CI 2.32;3.34) compared with daylight. Sunday (OR = 2.11; 95%CI 1.76;2.53) was the day with the highest gross risk of fatal accidents compared with Wednesday. The gross risk of a fatal accident was higher in the early hours of the morning (OR = 2.42; 95%CI 2.07;2.82), followed by during the night (OR = 1.48; 95%CI 1.30;1.68) compared with in the morning (Table 2).
Table 2. Bivariate analysis to investigate factors related to roads, vehicles and time associated with fatal traffi c accidents. Fortaleza, CE, Northeastern Brazil, 2004 to 2008.
Traffi c accident
Variable Total Fatal No fatality OR 95%CI 2 p
n % n % n %
Type of accident
Crash/collision 92,847 78.1 760 0.8 92,087 99.2
Running over pedestrian 14,083 11.9 728 5.2 13,355 94.8 6.32 5.71;6.98 1530.95 0.0000 Fall/leaving road and other 6,625 5.6 49 0.7 6,576 99.3 0.90 0.68;1.20 1.92 0.4895 Collision with a fi xed object 4,652 3.9 136 2.9 4,516 97.1 3.57 2.98;4.28 182.41 0.0000 Vehicle overturned 623 0.5 25 4.0 598 96.0 4.90 3.32;7.24 24.37 0.0000 Type of vehicles
Only car/truck 51,937 43.7 462 0.9 51,475 99.1
8 Man, road and vehicles: accident risk Almeida RLF et al
Continuation
Number of vehicles involved
One vehicle 87,128 73.3 745 0.9 86,383 99.1
Two vehicles 25,575 21.5 907 3.5 24,668 96.5 4.15 3.77;4.57 991.56 0.0000 More than two vehicles 6,127 5.2 46 0.8 6,081 99.2 0.88 0.65;1.18 0.74 0.0000 Age of vehicles
Over ten years 32,944 27.7 133 0.4 32,811 99.6
Between six and ten years 23,986 20.2 501 2.1 23,485 97.9 5.17 4.28;6.26 357.85 0.0000 Only vehicles under 5 years 25,810 21.7 452 1.8 25,358 98.2 4.34 3.58;5.26 266.58 0.0000
Location
Crossing 35,688 30.0 302 0.8 35,386 99.2
T, Duplo T, Y, roundabout and other 5,462 4.6 51 0.9 5,411 99.1 1.10 0.82;1.48 1.66 0.5137 Level crossing 264 0.2 19 7.2 245 92.8 8.50 5.44;13.30 7.60 0.0000 Mid-block 77,416 65.1 1.326 1.7 76,090 98.3 2.02 1.79;2.19 128.22 0.0000 Jurisdiction
Municipal 110,061 92.6 1.402 1.3 108,659 98.7
State 5,354 4.5 109 2.0 5,245 98.0 1.60 1.32;1.94 22.95 0.0000 Federal 3,415 2.9 187 5.5 3,228 94.5 4.30 3.70;4.99 423.58 0.0000 Road surface
Not asphalted 44,350 37.3 495 1.1 43,855 98.9
Asphalt 74,880 63.0 1.203 1.6 73,677 98.4 1.44 1.30;1.60 47.72 0.0000
Light
Daylight 65,337 55.0 725 1.1 64,612 98.9
Dawn 4,402 3.7 136 3.1 4,266 96.9 2.78 2.32;3.34 97.97 0.0000 Dusk 11,323 9.5 211 1.9 11,112 98.1 1.68 1.44;1.96 42.24 0.0000 Street lighting 12,759 10.7 217 1.7 12,542 98.3 1.53 1.32;1.78 28.22 0.0000 Poor/no illumination 22,898 19.3 406 1.8 22,492 98.2 1.60 1.42;1.80 36.15 0.0000 Type of signs
Traffi c lights 19,998 16.8 160 0.8 19,838 99.2
Overhead 20,802 17.5 185 0.9 20,617 99.1 1.11 0.90;1.37 0.97 0.3249 Lateral 69,544 58.5 1.256 1.8 68,288 98.2 2.26 1.92;2.66 100.99 0.0000 Time
Morning 32,667 27.5 372 1.1 32,295 98.9
Afternoon 40,895 34.4 498 1.2 40,397 98.8 1.07 0.94;1.22 0.97 0.3248 Night 32,930 27.7 554 1.7 32,376 98.3 1.48 1.30;1.68 34.82 0.0000 Early morning 9,951 8.4 274 2.8 9,677 97.2 2.42 2.07;2.82 127.57 0.0000 Week
Monday - Friday 81,054 68.2 956 1.2 80,098 98.8
Saturday and Sunday 37,780 31.8 742 2.0 37,038 98.0 1.67 1.51;1.83 112.59 0.0000 Day of the week
Wednesday 15,355 12.9 165 1.1 15,190 98.9
Thursday 15,901 13.4 186 1.2 15,715 98.8 1.15 0.93;1.41 1.69 0.1931 Friday 18,837 15.9 240 1.3 18,597 98.7 1.19 0.97;1.44 2.88 0.0899 Saturday 20,560 17.3 351 1.7 20,209 98.3 1.59 1.32;1.91 24.84 0.0001 Sunday 17,220 14.5 391 2.3 16,829 97.7 2.11 1.76;2.53 69.21 0.0000 Monday 15,896 13.4 198 1.2 15,698 98.8 1.16 0.94;1.42 1.99 0.1584 Tuesday 15,061 12.7 167 1.1 14,894 98.9 1.03 0.83;1.28 0.08 0.7738 Quarter
October to December 31,911 26.9 432 1.4 31,479 98.6
9
Rev Saúde Pública 2013;47(4):1-13
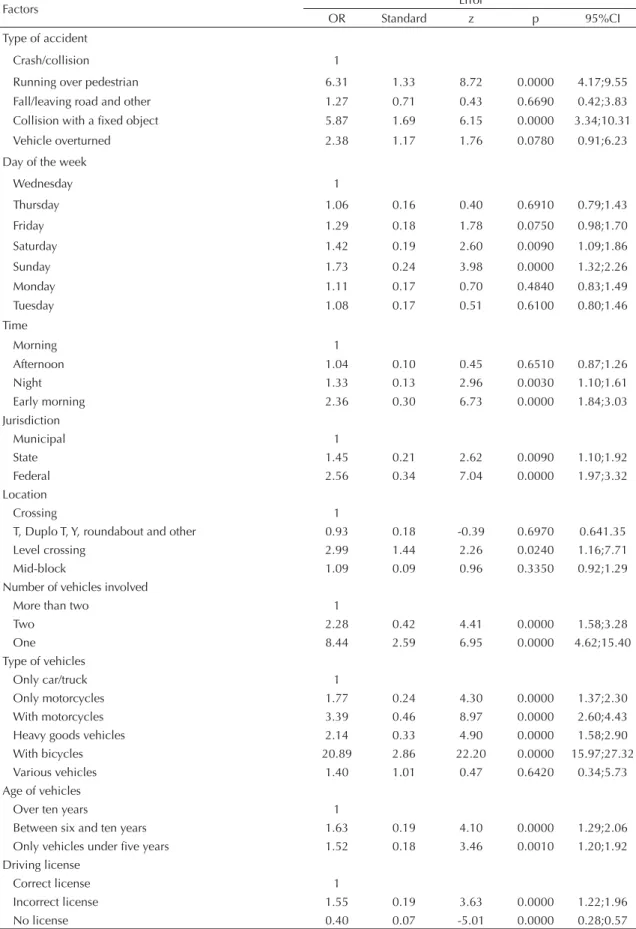
In the multinomial analysis, the presence of drivers who do not have a license (OR = 4.1; 95%CI 2.9;5.5) or do not have a license appropriate for the vehicle (OR = 1.6; 95%CI 1.2;1.9), using roads that are under federal jurisdiction (OR = 2.4; 95%CI 1.8;3.1), early hours of the morning (OR = 2.4; 95%CI 1.8;3.0) and Sundays (OR = 1.7; 95%CI 1.3;2.2) all stand out as contributing factors to fatal accidents (Table 3). Accidents involving motorcyclists (OR = 3.5; 95%CI 2.6;4.5) were potentially fatal. The traffi c accidents with the highest risk of fatality were those involving bicycles (OR = 21.2; 95%CI 16.1;27.8), running over pedestrians OR = 5.9 (95%CI 3.7;9.2) and collisions with fi xed obstacles OR = 5.7 (95%CI 3.1;10.4).
DISCUSSION
Brazil is moving onto the world stage due to its promising economic growth, however, morbidity and mortality due to traffi c accidents is recognized as a large-scale and highly complex phenomenon. It represents the relationship between investments in road safety, economic development policies centered around the automotive industry and traffi c education. Analyzing the factors which affect the occurrence of traffi c accidents is a complex procedure as they are numerous and they are not independent.8 The results of
this study provide a broader view of the phenomenon of traffi c accidents based on its analysis of characteristics of the road, the individuals and the vehicles involved.
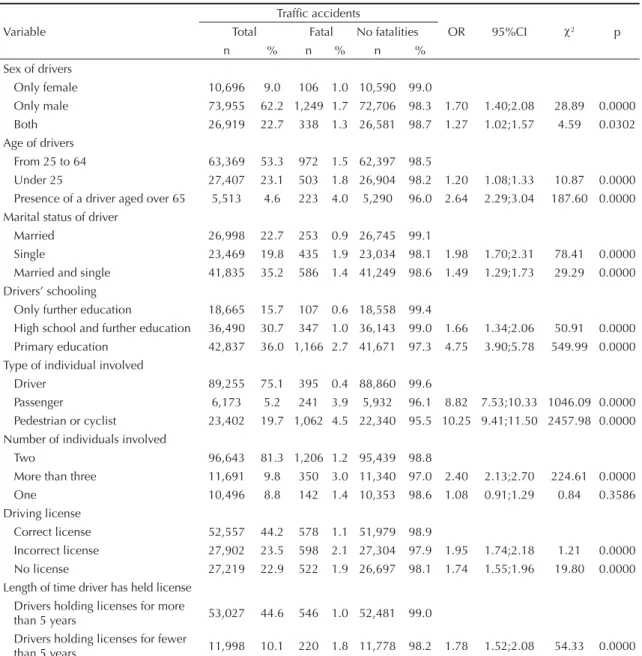
Table 3. Bivariate analysis to investigate factors related to the roads, the vehicles and the time linked to fatal traffi c accidents. Fortaleza, CE, Northeastern Brazil, 2004 to 2008.
Traffi c accidents
Variable Total Fatal No fatalities OR 95%CI 2 p
n % n % n %
Sex of drivers
Only female 10,696 9.0 106 1.0 10,590 99.0
Only male 73,955 62.2 1,249 1.7 72,706 98.3 1.70 1.40;2.08 28.89 0.0000 Both 26,919 22.7 338 1.3 26,581 98.7 1.27 1.02;1.57 4.59 0.0302 Age of drivers
From 25 to 64 63,369 53.3 972 1.5 62,397 98.5
Under 25 27,407 23.1 503 1.8 26,904 98.2 1.20 1.08;1.33 10.87 0.0000 Presence of a driver aged over 65 5,513 4.6 223 4.0 5,290 96.0 2.64 2.29;3.04 187.60 0.0000 Marital status of driver
Married 26,998 22.7 253 0.9 26,745 99.1
Single 23,469 19.8 435 1.9 23,034 98.1 1.98 1.70;2.31 78.41 0.0000 Married and single 41,835 35.2 586 1.4 41,249 98.6 1.49 1.29;1.73 29.29 0.0000 Drivers’ schooling
Only further education 18,665 15.7 107 0.6 18,558 99.4
High school and further education 36,490 30.7 347 1.0 36,143 99.0 1.66 1.34;2.06 50.91 0.0000 Primary education 42,837 36.0 1,166 2.7 41,671 97.3 4.75 3.90;5.78 549.99 0.0000 Type of individual involved
Driver 89,255 75.1 395 0.4 88,860 99.6
Passenger 6,173 5.2 241 3.9 5,932 96.1 8.82 7.53;10.33 1046.09 0.0000 Pedestrian or cyclist 23,402 19.7 1,062 4.5 22,340 95.5 10.25 9.41;11.50 2457.98 0.0000 Number of individuals involved
Two 96,643 81.3 1,206 1.2 95,439 98.8
More than three 11,691 9.8 350 3.0 11,340 97.0 2.40 2.13;2.70 224.61 0.0000 One 10,496 8.8 142 1.4 10,353 98.6 1.08 0.91;1.29 0.84 0.3586 Driving license
Correct license 52,557 44.2 578 1.1 51,979 98.9
Incorrect license 27,902 23.5 598 2.1 27,304 97.9 1.95 1.74;2.18 1.21 0.0000 No license 27,219 22.9 522 1.9 26,697 98.1 1.74 1.55;1.96 19.80 0.0000 Length of time driver has held license
Drivers holding licenses for more
than 5 years 53,027 44.6 546 1.0 52,481 99.0 Drivers holding licenses for fewer
10 Man, road and vehicles: accident risk Almeida RLF et al
This aspect highlights the importance of inter-sector practices to better deal with the problem, in view of its complexity and the multiplicity of factors related to diverse areas of human knowledge.
Road structure, signs and illumination, the day of the week and time of day of the occurrence are connected to the severity of traffi c accidents. Researchers have found similar results and attribute higher fatality rates to weekends and the early hours, to drinking and driving and speeding.2 On the other hand, it is important to bear
in mind the role of poor quality of lighting and adequate signage as a parameter of safety.16
Severity of the accident is related to the type of juris-diction of the road, with higher risks at a federal level, followed by state, compared to municipal. The speed limit on each type of road and the fl ow of traffi c differs and lead to congestion on municipal roads, leading to less serious accidents without injuries.
Drivers who have held a license for fewer than fi ve years have the highest risk of being involved in a fatal accident, in contrast with the fi ndings of other studies, which highlight older motorists as signifi cantly more likely to be involved in serious and fatal accidents, when fi gures are adjusted for differences in exposure.22
This information places the Brazilian process of issuing driving licenses under discussion. Lack of experience on the part of new drivers is an implicit criticism of the rigidity of the traffi c code which stipulates that a learner’s permit for up to a year is not suffi cient to make them fi t to drive vehicles.
Traffi c, the condition of the road and the greater fl ow of individuals commuting increase exposure to the problem. Added to this is the culture of punishment at the expense of education around this phenomenon. These obstacles impede an improvement in the indi-cators, despite the implementation of public policies which attempt to mitigate the phenomenon. The more vulnerable population groups (pedestrians, cyclists and motorcyclists) become victims of the conditions of the road, the vehicles and the road users.
There are differences in the seriousness of traffic accidents according to type. Running over pedestrians and accidents involving cyclists and motorcyclists are described as more serious.1 This fact is explained by the
kinematics of trauma, and will continue to be a problem until equality exists in traffi c.
The individual’s position in the traffi c is a determinant of the seriousness of the injury. The risk of death is higher among cyclists and pedestrians. This fact has also been presented in other studies, in which pedestrians and cyclists are the most vulnerable road users and make up the highest percentage of victims.19 Whereas cyclists lack
proper cycle lanes and need to struggle with the vehicles
for space amid the oppression and the fumes, pedestrians are faced with narrow poorly maintained sidewalks. This occurs despite Fortaleza being a fl at city where these methods of transport should, for diverse reasons, be prioritized: health, environment and economy.
Congestion in the large cities, ineffi cient public trans-port, tele-deliveries and mototaxis have led to the rapid spread of motorcycle use, representing an increase of 700% in fatalities between 1998 and 2008.3 Their low
cost and facilitated fi nancing are responsible for the signifi cant increase in motorcycles. The problem of the severity of this type of accident, as evidenced in this and other studies, raises the need to think about the safety of these road users.
Accidents in which only one vehicle was involved had a higher risk of fatality compared with accidents with two vehicles. Confl icts in traffi c with more susceptible vehicles such as motorbikes and bicycles can lead to the driver falling. According to the kinematics of trauma, the injury is more severe where there is a greater trans-ference of kinetic energy. This was proved in this study, in which the main type of accidents involving fatalities were those involving collisions with fi xed objects and running down pedestrians. Speed is the most signifi cant producer of this energy.
Both severity and incidence of accidents increase during the night and at the weekends, due to lack of congestion and drinking and driving, in view of the devastating effect of combining drink driving and speeding. A difference was observed in the distribution of occurrence according to month, day of the week and time.5 Socio-demographic factors such as sex, age
and schooling are related to the occurrence and the severity of accidents.12,20
Individuals who are single are at greater risk than married individuals of suffering a serious or fatal traffi c accident, even after adjusting for sex, age and alcohol,21 which may be due to the fact that singles
expose themselves more to risk factors, as confi rmed in this study. The times and roads on which fatal accidents occur suggest less congested driving conditions and travelling connected to leisure activities, characterized by imprudence. This indicates the need for investment in preventing accidents and promoting safe driving through educational strategies, creating a culture of peace in the traffi c.
11
Rev Saúde Pública 2013;47(4):1-13
Table 4. Final model of the multivariate analysis for factors associated with fatal traffi c accidents. Fortaleza, CE, Northeastern Brazil, 2004 to 2008.
Factors Error
OR Standard z p 95%CI Type of accident
Crash/collision 1
Running over pedestrian 6.31 1.33 8.72 0.0000 4.17;9.55 Fall/leaving road and other 1.27 0.71 0.43 0.6690 0.42;3.83 Collision with a fi xed object 5.87 1.69 6.15 0.0000 3.34;10.31 Vehicle overturned 2.38 1.17 1.76 0.0780 0.91;6.23
Day of the week
Wednesday 1
Thursday 1.06 0.16 0.40 0.6910 0.79;1.43
Friday 1.29 0.18 1.78 0.0750 0.98;1.70
Saturday 1.42 0.19 2.60 0.0090 1.09;1.86
Sunday 1.73 0.24 3.98 0.0000 1.32;2.26
Monday 1.11 0.17 0.70 0.4840 0.83;1.49
Tuesday 1.08 0.17 0.51 0.6100 0.80;1.46
Time
Morning 1
Afternoon 1.04 0.10 0.45 0.6510 0.87;1.26
Night 1.33 0.13 2.96 0.0030 1.10;1.61
Early morning 2.36 0.30 6.73 0.0000 1.84;3.03 Jurisdiction
Municipal 1
State 1.45 0.21 2.62 0.0090 1.10;1.92
Federal 2.56 0.34 7.04 0.0000 1.97;3.32
Location
Crossing 1
T, Duplo T, Y, roundabout and other 0.93 0.18 -0.39 0.6970 0.641.35 Level crossing 2.99 1.44 2.26 0.0240 1.16;7.71 Mid-block 1.09 0.09 0.96 0.3350 0.92;1.29 Number of vehicles involved
More than two 1
Two 2.28 0.42 4.41 0.0000 1.58;3.28
One 8.44 2.59 6.95 0.0000 4.62;15.40
Type of vehicles
Only car/truck 1
Only motorcycles 1.77 0.24 4.30 0.0000 1.37;2.30 With motorcycles 3.39 0.46 8.97 0.0000 2.60;4.43 Heavy goods vehicles 2.14 0.33 4.90 0.0000 1.58;2.90 With bicycles 20.89 2.86 22.20 0.0000 15.97;27.32 Various vehicles 1.40 1.01 0.47 0.6420 0.34;5.73 Age of vehicles
Over ten years 1
Between six and ten years 1.63 0.19 4.10 0.0000 1.29;2.06 Only vehicles under fi ve years 1.52 0.18 3.46 0.0010 1.20;1.92 Driving license
Correct license 1
12 Man, road and vehicles: accident risk Almeida RLF et al
It is possible to unify various sources of data from different sectors in order to improve understanding of traffic accidents so as to produce inter-sector public policies which aim to reduce deaths from this problem. This study’s analysis of the characteristics of risk in the accident, considering the individuals and the roads where the vehicles drive was an important contribution for increasing the number of factors related to this phenomenon.
A possible limitation of this study was using secondary data. However, we believe that the techniques used to link the databases are an innovation in dealing with factors which affect the severity of traffi c accidents. The effort in integrating the different databases used and the results achieved go some way to substituting the need for establishing a unifi ed information system which includes the variables necessary for analyzing the traffi c situation in Brazil.
Continuation
Length of time drivers have held license
More than fi ve years 1
Fewer than fi ve years 1.09 0.11 0.84 0.3980 0.89;1.33 No license 3.87 0.60 8.68 0.0000 2.85;5.25 Number of individuals involved
Two 1
More than three 2.45 0.58 3.79 0.0000 1.54;3.90
One 6.79 1.65 7.89 0.0000 4.22;10.92
Drivers’ schooling
Only further education 1
High school and further education 1.01 0.13 0.07 0.9420 0.79;1.29
Primary education 2.10 0.25 6.11 0.0000 1.65;2.66 Sex of drivers
Only female 1
Only male 1.48 0.30 1.94 0.0520 1.00;2.20
Both 0.62 0.15 -1.98 0.0480 0.39;1.00
Marital status of driver
Married 1
Single 1.07 0.10 0.76 0.4480 0.90;1.28
13
Rev Saúde Pública 2013;47(4):1-13
1. Alves EF. Características dos acidentes de trânsito com vítimas de atropelamento no município de Maringá-Pr, 2005-2008. Saud Pesq. 2010;3(1):25-32.
2. Soares DFPP, Barros MBA. Fatores associados ao risco de internação por acidentes de trânsito no Município de Maringá-PR.
Rev Bras Epidemiol. 2006;9(2):193-205. DOI:10.1590/S1415-790X2006000200006
3. Kmet L, Brasher P, Macarthur C. A small area study of motor vehicle crash fatalities in Alberta, Canada. Accid Anal Prev. 2003;35(2):177-82. DOI:10.1016/S0001-4575(01)00101-4
4. Bastos YGL, Andrade SM, Soares DA. Características dos acidentes de trânsito e das vítimas atendidas em serviço pré-hospitalar em cidade do Sul do Brasil, 1997/2000. Cad Saude Publica. 2005;21(3):815-22. DOI:10.1590/S0102-311X2005000300015
5. Barss P, Kahn JP, Mastroianni AC, Sugarman J. Injury prevention: an international perspective epidemiology, surveillance, and policy. New York: Oxford University Press; 1998.
6. Ott EA, Favaretto ALF, Neto AFPR, Zechin JG, Bordin R. Traffi c accidents: characterization accidents and lesions in an urban center of southern Brazil. Rev Saude Publica. 1993;27(5):350-6. DOI:10.1590/S0034-89101993000500005
7. Mello Jorge MHP, Gawryszewski VP, Latorre MI. Análise dos dados de mortalidade.
Rev Saude Publica. 1997;31(4Suppl):5-25. DOI:10.1590/S0034-89101997000500002
8. Deslandes SF, Silva C. Análise da morbidade hospitalar por acidentes de trânsito em hospitais públicos do Rio de Janeiro, RJ, Brasil. Rev Saude Publica. 2000;34(4):367-72. DOI:10.1590/S0034-89102000000400009
9. Gawryszewski VP, Koizumi MS, Mello-Jorge MHP. As causas externas no Brasil no ano 2000: comparando a mortalidade e a morbidade.
Cad Saude Publica. 2004;20(4):995-1003. DOI:10.1590/S0102-311X2004000400014
10. Branco AG. A falta de estatísticas confi áveis difi culta a formatação de políticas públicas para solucionar os problemas no trânsito. Rev ABRAMET. 2003;11(21):33-47.
11. Organização Mundial de Saúde. Classifi cação internacional de doenças e problemas relacionados
à saúde. 10. ed. rev. São Paulo: Editora Edusp; Universidade de São Paulo; 2007. v.1.
12. Blakely T, Salmond C. Probabilistic record linkage and a method to calculate the positive predictive value. Int J Epidemiol. 2002;31(6):1246-52.
13. Méray N, Reitsma JB, Ravelli ACJ, Bonsel GJ. Probabilistic record linkage is a valid and transparent tool to combine databases without a patient identifi cation number. J Clin Epidemiol.
2007;60(9):883. DOI:10.1016/j.jclinepi.2006.11.021
14. Machado CJ, Hill K. Probabilistic record linkage and an automated procedure to minimize the undecided-matched pair problem.
Cad Saude Publica 2004;20(4):915-25. DOI:10.1590/S0102-311X2004000400005
15. Hosmer DW, Lemeshow S. Applied logistic regression. 2 ed. New York: Wiley-Interscience; 2000.
16. Crundall D, Clarke D, Ward P, Bartle C. Road safety good practice guide. London: Defence Terrain Research Laboratory; 2001.
17. Abreu AMM, Lima JMB, Griep RH. Acidentes de trânsito e a frequência dos exames de alcoolemia com vítimas fatais na cidade do Rio de Janeiro.
Esc Anna Nery Rev Enferm. 2009;13(1):44-50. DOI:10.1590/S1414-81452009000100007
18. Montenegro MMS, Duarte E, Ruscitto RP, Nascimento AF. Mortalidade de motociclistas em acidentes de transporte no Distrito Federal, 1996 a 2007. Rev Saude Publica. 2011;45(3):529-38. DOI:10.1590/S0034-89102011000300011
19. Silva DW, Andrade SM, Soares DA, Paula Soares DFP, Mathias TAF. Perfi l do trabalho e acidentes de trânsito entre motociclistas de entregas em dois municípios de médio porte do Estado do Paraná, Brasil. Cad Saude Publica. 2008;24(11):2643-52. DOI:10.1590/S0102-311X2008001100019
20. Bacchieri G, Barros AJD. Acidentes de trânsito no Brasil de 1998 a 2010: muitas mudanças e poucos resultados. Rev Saude Publica. 2011;45(5):949-63. DOI:10.1590/S0034-89102011005000069
21. Whitlock G, Norton R, Clark T, Jackson R, MacMahon S. Motor vehicle driver injury and marital status: a cohort study with prospective and retrospective driver injuries. Inj Prev. 2004;10(1):33. DOI:10.1136/ip.2003.003020
REFERENCES
This study was supported by the Coordenação de Aperfeiçoamento do Pessoal de Nível Superior (CAPES) through a post-graduate doctorate grant to Almeida R.L.F.
The study was based on the doctoral thesis of Almeida R.L.F., entitled: “Epidemiologia dos Acidentes de Trânsito no Município de Fortaleza no período de 2004 a 2008”, presented to the Faculty of Medicine of the Universidade Federal do Ceará, in 2011.