The mitochondrial genome of the stingless bee
Melipona bicolor
(Hymenoptera, Apidae, Meliponini): Sequence, gene organization
and a unique tRNA translocation event conserved across the tribe Meliponini
Daniela Silvestre
1, Mark Dowton
2and Maria Cristina Arias
11
Departamento de Genética e Biologia Evolutiva, Instituto de Biociências, Universidade de São Paulo,
São Paulo, SP, Brazil.
2
Institute of Biomolecular Sciences and Conservation Biology, Department of Biology,
The University of Wollongong, New South Wales, Australia.
Abstract
At present a complete mtDNA sequence has been reported for only two hymenopterans, the Old World honey bee, Apis mellifera and the sawfly Perga condei. Among the bee group, the tribe Meliponini (stingless bees) has some dis-tinction due to its Pantropical distribution, great number of species and large importance as main pollinators in sev-eral ecosystems, including the Brazilian rain forest. However few molecular studies have been conducted on this group of bees and few sequence data from mitochondrial genomes have been described. In this project, we PCR amplified and sequenced 78% of the mitochondrial genome of the stingless bee Melipona bicolor (Apidae, Meliponini). The sequenced region contains all of the 13 mitochondrial protein-coding genes, 18 of 22 tRNA genes, and both rRNA genes (one of them was partially sequenced). We also report the genome organization (gene content and order), gene translation, genetic code, and other molecular features, such as base frequencies, codon usage, gene initiation and termination. We compare these characteristics ofM. bicolor to those of the mitochondrial genome ofA. mellifera and other insects. A highly biased A+T content is a typical characteristic of the A. mellifera mitochon-drial genome and it was even more extreme in that ofM. bicolor. Length and compositional differences between M. bicolor and A. mellifera genes were detected and the gene order was compared. Eleven tRNA gene translocations were observed between these two species. This latter finding was surprising, considering the taxonomic proximity of these two bee tribes. The tRNALys
gene translocation was investigated within Meliponini and showed high conserva-tion across the Pantropical range of the tribe.
Key words: Melipona bicolor, Meliponini, social insects, mitochondrial genome, gene rearrangements.
Received: September 27, 2007; Accepted: February 12, 2008.
Introduction
In recent years a number of mitochondrial genomes have been completely sequenced, contributing to the knowledge of molecular features related to function and evolution of this peculiar genome (Boore, 1999). Its gene content is typically rather conserved in Metazoa (Booreet al., 1995), with notable exceptions described in nematodes (Okimotoet al., 1992), molluscs (Hoffmannet al., 1992) and cnidarians (Beagleyet al., 1998). In general, mitochon-drial DNA (mtDNA) contains genes for two ribosomal sub-units (12S and 16S), 22 tRNA, and 13 proteins (three subunits of cytochrome c oxidase, cytochrome B, subunits
6 and 8 of ATP F0 synthase, and seven subunits of NADH dehydrogenase). There is also a non-coding A+T rich re-gion that contains signaling elements for regulation of rep-lication and transcription (Wolstenholme, 1992). Animal mitochondrial genome size is usually about 16 kb long, with few exceptions (Brown, 1985). Gene rearrangements within the mtDNA, formerly considered rare, have been de-scribed for a number of taxa, including bees (Mindellet al., 1998; Dowton and Campbell, 2001; Shao et al., 2003; Silvestreet al., 2002; Silvestre and Arias, 2006).
One hundred sixteen complete arthropod mtDNA se-quences, including 61 insect species, have been deposited in GenBank. In the described insect mtDNA genomes, A+T content is very high. Currently, complete mitochondrial genomes have been sequenced for just two hymenopteran species: the sawfly Perga condei (Castro and Dowton, 2005) and the honeybeeApis mellifera(Crozier and
Cro-www.sbg.org.br
Send correspondence to Maria Cristina Arias. Departamento de Genética e Biologia Evolutiva, Instituto de Biociências, Univer-sidade de São Paulo, Rua do Matão 277, 05508-900 São Paulo, SP, Brazil. E-mail: [email protected].
zier, 1993). The honeybee mtDNA presents the highest A+T bias (84.9%) known for insects. According to Crozier and Crozier (1993) the A+T bias is probably maintained due to a greater number of transversions over transitions.
Among bees, the tribe Meliponini, known as stingless bees, has gained some attention. The tribe has a wide geo-graphic distribution, inhabits all tropical areas of the World (Michener, 2000), and includes the main pollinators in sev-eral neotropical ecosystems (Kerret al., 1996). In addition to their ecological importance, some species produce honey, pollen, wax and propolis that are commercially ex-ploited (Nogueira-Neto, 1997). The species Melipona
bicolor presents a very unique behavioral characteristic,
polygyny, where several laying queens may cohabitate the nest for considerable time (Velthuiset al., 2006). This spe-cies is distributed in the southern and southeastern Brazil, in the Atlantic rain forest. Nonetheless as this ecosystem has been severely reduced in size by human activity and only 7% of the original area remains,M. bicolorand other bees are considered endangered.
In previous studies we have characterized the mito-chondrial genomes of several meliponine species through RFLP analysis (Franciscoet al., 2001; Weinlichet al., 2004; Brito and Arias, 2005). Evidences of size difference, in com-parison to those expected forApis mellifera, were obtained for some mitochondrial regions after PCR amplification.
Those data were interpreted as indirect evidence of gene or-der or content changes. Later these size differences, relative toA. mellifera, were confirmed by sequencing (Silvestreet al., 2002; Silvestre and Arias, 2006), and all involved tRNA gene rearrangements. Eleven tRNA translocations were mapped betweenA. melliferaand M. bicolor(Ariaset al., 2006), so far the highest translocation number verified be-tween species belonging to the same taxonomic subfamily.
Mitochondrial gene order has been considered a mo-lecular class very promising for phylogenetic studies, espe-cially among major taxonomic groups (Boore, 1999). tRNA rearrangements are highly reliable as evolutionary markers, neutral and less prone to homoplasy (Boore and Brown, 1998). We previously sequenced a portion of the mitochondrial genome of M. bicolor, and reported that there were 11 tRNA gene rearrangements when this ge-nome was compared with that ofApis mellifera(Silvestreet al., 2002; Silvestre and Arias, 2006). However, in that re-port we did not extensively characterize theM.bicolor mi-tochondrial genome, focusing our observations on genome organization. In the present study, we present a thorough characterization of theM. bicolormitochondrial genome, with respect to codon usage, base frequencies, gene initia-tion and terminainitia-tion, and tRNA structure. In addiinitia-tion, we examine the evolutionary origin of one of the tRNA gene rearrangements identified in the previous study, the trans-location of the tRNALysgene. We survey a broad range of Meliponini to more accurately determine the evolutionary origin of this translocation.
Material and Methods
mtDNA sequence analysis
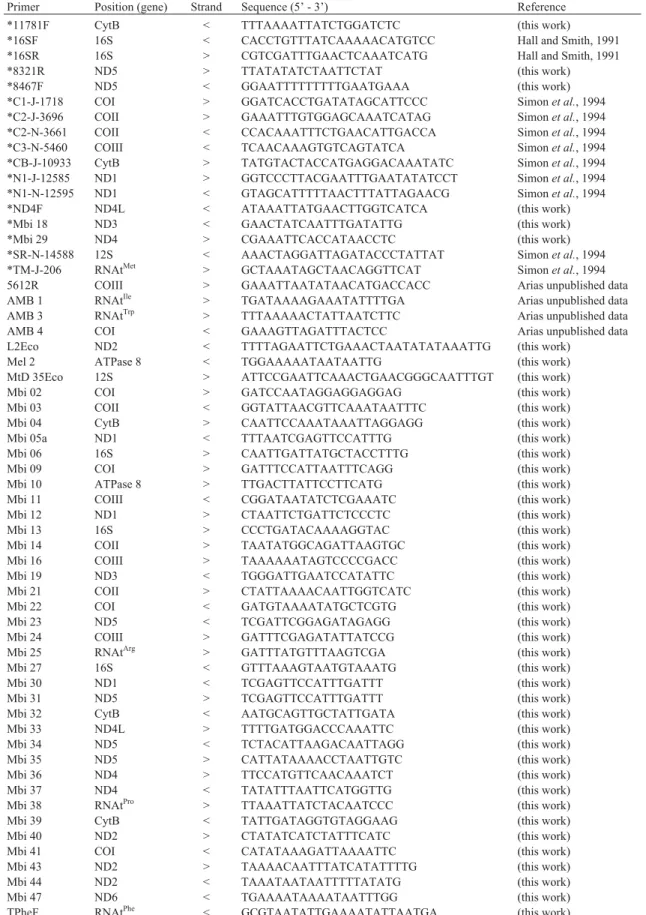
Individuals ofM. bicolorwere collected from a sin-gle monogynic colony maintained at the Laboratório de Abelhas, Departamento de Ecologia, IB-USP, São Paulo. Total genomic DNA was extracted using the TNE-protocol (Sheppard and McPheron, 1991). The experi-mental approach to obtain the whole mtDNA molecule consisted of the amplification of small and overlapped fragments. Thus aliquots of TNE extraction were used as template for PCR reactions, withTaq DNA polymerase (Invitrogen). We initially used the following conditions: denaturation at 94 °C/5 min, followed by 35 cycles of 94 °C/60 s, 42 °C/80 s and 64 °C/120 s. An additional final extension step of 64 °C for 10 min was performed. The an-nealing temperature was optimized when necessary. The primers were derived fromA.mellifera(Hall and Smith, 1991; Ariaset al., 2008),M. bicolor(designed in our labo-ratory), and other organisms (Simon et al., 1994) (Ta-ble 1).
The PCR products were cloned into pGEM T-Easy Vector (Promega). At least two clones of each region were sequenced on both directions using Thermo Sequenase Dye Terminator (Amersham Life Science) or Big Dye Termina-tor (Applied Biosystems). Samples were analyzed on ABI-PRISM 310 and 3100 automated sequencers (Applied Bio-systems).
Electropherograms were checked by eye on Trace-Viewer 2.0.1, and the sequences were assembled manually through GeneRunner 3.00 program (Hastings Software). Automated alignments were obtained using DAMBE (Xia, 2000), employing the CLUSTALW algorithm. Codon us-age was analyzed with the software CODONTREE. BLAST searches at National Center for Biotechnology In-formation (NCBI) were used to verify the similarity between our sequences and those from other insect mito-chondrial genomes. Transfer RNA genes were identified and the secondary structures were inferred by the software tRNA-Scan (Lowe and Eddy, 1997).
A single sequence of 14,422 bp was assembled and deposited at GenBank database under the accession number AF466146, which has also a Genome accession number, NC_004529.
KD tRNA cluster analysis
Fourteen Meliponini species (Table 2) were selected for the KD tRNA cluster sequencing. The species analyzed, collected in four continents, may be considered representa-tive of the Pantropical geographic distribution of the tribe. The KD region was amplified using the pair of primers Cox 2/ Atp8 and the PCR conditions described in Castroet al.
Table 1- Set of primers utilized on PCR amplification ofM. bicolormtDNA: positioning (relative to mitochondrial genes), strand, sequences and refer-ences.
Primer Position (gene) Strand Sequence (5’ - 3’) Reference
*11781F CytB < TTTAAAATTATCTGGATCTC (this work)
*16SF 16S < CACCTGTTTATCAAAAACATGTCC Hall and Smith, 1991
*16SR 16S > CGTCGATTTGAACTCAAATCATG Hall and Smith, 1991
*8321R ND5 > TTATATATCTAATTCTAT (this work)
*8467F ND5 < GGAATTTTTTTTTGAATGAAA (this work)
*C1-J-1718 COI > GGATCACCTGATATAGCATTCCC Simonet al., 1994
*C2-J-3696 COII > GAAATTTGTGGAGCAAATCATAG Simonet al., 1994
*C2-N-3661 COII < CCACAAATTTCTGAACATTGACCA Simonet al., 1994
*C3-N-5460 COIII < TCAACAAAGTGTCAGTATCA Simonet al., 1994
*CB-J-10933 CytB > TATGTACTACCATGAGGACAAATATC Simonet al., 1994
*N1-J-12585 ND1 > GGTCCCTTACGAATTTGAATATATCCT Simonet al., 1994
*N1-N-12595 ND1 < GTAGCATTTTTAACTTTATTAGAACG Simonet al., 1994
*ND4F ND4L < ATAAATTATGAACTTGGTCATCA (this work)
*Mbi 18 ND3 < GAACTATCAATTTGATATTG (this work)
*Mbi 29 ND4 > CGAAATTCACCATAACCTC (this work)
*SR-N-14588 12S < AAACTAGGATTAGATACCCTATTAT Simonet al., 1994
*TM-J-206 RNAtMet > GCTAAATAGCTAACAGGTTCAT Simonet al., 1994
5612R COIII > GAAATTAATATAACATGACCACC Arias unpublished data
AMB 1 RNAtIle > TGATAAAAGAAATATTTTGA Arias unpublished data
AMB 3 RNAtTrp > TTTAAAAACTATTAATCTTC Arias unpublished data
AMB 4 COI < GAAAGTTAGATTTACTCC Arias unpublished data
L2Eco ND2 < TTTTAGAATTCTGAAACTAATATATAAATTG (this work)
Mel 2 ATPase 8 < TGGAAAAATAATAATTG (this work)
MtD 35Eco 12S > ATTCCGAATTCAAACTGAACGGGCAATTTGT (this work)
Mbi 02 COI > GATCCAATAGGAGGAGGAG (this work)
Mbi 03 COII < GGTATTAACGTTCAAATAATTTC (this work)
Mbi 04 CytB > CAATTCCAAATAAATTAGGAGG (this work)
Mbi 05a ND1 < TTTAATCGAGTTCCATTTG (this work)
Mbi 06 16S > CAATTGATTATGCTACCTTTG (this work)
Mbi 09 COI > GATTTCCATTAATTTCAGG (this work)
Mbi 10 ATPase 8 > TTGACTTATTCCTTCATG (this work)
Mbi 11 COIII < CGGATAATATCTCGAAATC (this work)
Mbi 12 ND1 > CTAATTCTGATTCTCCCTC (this work)
Mbi 13 16S > CCCTGATACAAAAGGTAC (this work)
Mbi 14 COII > TAATATGGCAGATTAAGTGC (this work)
Mbi 16 COIII > TAAAAAATAGTCCCCGACC (this work)
Mbi 19 ND3 < TGGGATTGAATCCATATTC (this work)
Mbi 21 COII > CTATTAAAACAATTGGTCATC (this work)
Mbi 22 COI < GATGTAAAATATGCTCGTG (this work)
Mbi 23 ND5 < TCGATTCGGAGATAGAGG (this work)
Mbi 24 COIII > GATTTCGAGATATTATCCG (this work)
Mbi 25 RNAtArg > GATTTATGTTTAAGTCGA (this work)
Mbi 27 16S < GTTTAAAGTAATGTAAATG (this work)
Mbi 30 ND1 < TCGAGTTCCATTTGATTT (this work)
Mbi 31 ND5 > TCGAGTTCCATTTGATTT (this work)
Mbi 32 CytB < AATGCAGTTGCTATTGATA (this work)
Mbi 33 ND4L > TTTTGATGGACCCAAATTC (this work)
Mbi 34 ND5 < TCTACATTAAGACAATTAGG (this work)
Mbi 35 ND5 > CATTATAAAACCTAATTGTC (this work)
Mbi 36 ND4 > TTCCATGTTCAACAAATCT (this work)
Mbi 37 ND4 < TATATTTAATTCATGGTTG (this work)
Mbi 38 RNAtPro > TTAAATTATCTACAATCCC (this work)
Mbi 39 CytB < TATTGATAGGTGTAGGAAG (this work)
Mbi 40 ND2 > CTATATCATCTATTTCATC (this work)
Mbi 41 COI < CATATAAAGATTAAAATTC (this work)
Mbi 43 ND2 > TAAAACAATTTATCATATTTTG (this work)
Mbi 44 ND2 < TAAATAATAATTTTTATATG (this work)
Mbi 47 ND6 < TGAAAATAAAATAATTTGG (this work)
TPheF RNAtPhe < GCGTAATATTGAAAATATTAATGA (this work)
Results and Discussion
General features of the genome and gene content
The size of theM. bicolormtDNA had been previ-ously estimated to be 18,500 bp by RFLP analyses (Weinlichet al., 2004). However, this total size could not be fully confirmed by sequencing, we were unable to clone the 4,100 bp fragment containing the control region and its adjacent region. We analyzed a continuous fragment of 14,422 bp, or about 78% of the estimated size. This frag-ment contains the 13 protein-coding genes, 18 of 22 tRNA genes and the two rRNA genes (complete sequence was ob-tained for the large subunit - 16S, and partial sequence for the small subunit - 12S) (Figure 1). We detected five over-lapping regions between genes, three of them including genes that were on the same strand (Table 3). In total, 30 bp were involved.
Seventeen non-coding regions were detected, with sizes ranging from one to 173 bp, totaling 486 bp (Table 4). Considering the same portion ofA. melliferamtDNA, ex-cluding the hypervariable COI-COII intergenic region and the control region, the number of non-coding nucleotides is
greater, 618 bp (Crozier and Crozier, 1993). Thus, comparing the sequenced portion of M. bicolor genome with the respective genome portion ofA. mellifera, we veri-fied thatM. bicolorpresents a more compact arrangement.
The COI-COII intergenic region known to occur inA.
melliferawas absent inM. bicolor. Moreover, indirect PCR
evidence indicated that the COI-COII region is absent in at least 16 other Meliponini species (Ariaset al., 2006). This intergenic region has been extensively studied in A.
Table 2- Meliponini species and countries of origin.
Species Country
Austroplebeia australis Australia
Austroplebeia symei Australia
Trigona carbonaria Australia
Trigona hockingsi Australia
Lestrimellita limao Brazil
Plebeia remota Brazil
Scaptotrigona xanthotricha Brazil
Schwarziana quadripunctata Brazil
Tetragonisca angustula Brazil
Dactylurinasp Ghana
Liotrigonasp Ghana
Heterotrigona iridipennis India
Trigona doipaensis Thailand
Trigona flavibasis Thailand
Figure 1- Linearized mitochondrial genomic map ofM. bicolor(not in scale). Dots indicate a region not sequenced. Dark boxes indicate tRNA that un-derwent translocation in comparison toApis melliferamitochondrial gene order. Numbers above the map indicate the tRNA clusters. I - tRNAIle; A
-tRNAAla; K - tRNALys; M - tRNAMet; nd2 - NADH dehidrogenase subunit 2; W - tRNATrp; Y - tRNATyr; coI cytochrome c oxidase subunit I; L2 -tRNALeu(UUR); coII - cytochrome c oxidase subunit II; D - tRNAAsp; atp8 – ATP synthase subunit 8; atp6 – ATP synthase subunit 6; coIII - cytochrome c
oxidase subunit III; G - tRNAGly; nd3 - NADH dehydrogenase subunit 3; R - tRNAArg; N - tRNAAsn; E - tRNAGlu; F - tRNAPhe; nd5 - NADH dehydrogenase subunit 5; H – tRNAHis; nd4 - NADH dehydrogenase subunit 4; nd4L - NADH dehydrogenase subunit 4 (light chain); T - tRNAThr; P -tRNAPro; nd6 - NADH dehydrogenase subunit 6; cytB - cytochrome B; S2 - tRNASer(UCN); nd1 - NADH dehydrogenase subunit 1; L1 - tRNALeu(CUN);
16S – rRNA 16S; V - tRNAVal; 12S – rRNA 12S.
Table 3 - Overlapping regions between mitochondrial genes of M. bicolor: involved genes, overlap size (bp) and coding strand.
Genes Size (bp) Strand
ATP8/ATP6 10 +/+
tRNAGlu/tRNAPhe 6
+/-tRNAHis/ND4 6
-/-ND1/tRNALeu(L1) 6
-/-tRNASer(S2)/ND1 2
+/-Total 30
Table 4- Non-coding regions between mitochondrial genes ofM. bicolor: flanking genes and size (bp).
Genes Size (bp)
tRNAMet/ND2 173
ND6/CytB 94
tRNAAsn/tRNAGlu 58
tRNATyr/COI 58
tRNAPro/ND6 23
ATP6/COIII 15
COII/tRNAAsp 12
ND4/ND4L 10
COIII/tRNAGly 9
CytB/tRNASer(S2) 9
tRNALys/tRNAMet 6
ND2/tRNATrp 5
tRNAArg/tRNAAsn 5
ND4L/tRNAThr 4
ND3/tRNAArg 3
tRNAPhe/ND5 1
tRNATrp/tRNATyr 1
mellifera, and size polymorphism has been reported (from 200 to 650 bp) among subspecies (Garneryet al., 1992, 1995; Francket al., 1998). It has also been cited as a possi-ble second origin of mtDNA replication and transcription (Cornuetet al., 1991). Our data clearly suggest that this re-gion and possible function is not a shared feature between
A. melliferaand Meliponini, in a broader sense.
The longest intergenic region found inM. bicolor con-sisted of 173 bp and was located between the tRNAMet and ND2 genes. Concerning the sequence similarities betweenM. bicolorandA. mellifera, we observed a 46 bp segment within this region that was highly similar (84%) to the non-coding re-gion between COIII and tRNAGlyofA. mellifera.
The second longest non-coding region ofM. bicolor
mtDNA was located between the ND6 and CytB genes and was 94 bp in length. InA. melliferathis non-coding region is 60 bp long. The sequence similarity between these was 61%. The other intergenic regions found inM. bicolorwere also analyzed, but were too small and showed no significant similarities with any region of the mtDNA ofA. mellifera
or other organisms.
Base composition - A+T bias
The adenine+thymine bias was very high inM. bicolor
mtDNA (86.7%), as has been described in A. mellifera
(84.9% Crozier and Crozier, 1993). This latter species, as a member of Hymenoptera, has been cited to be the most AT biased insect mitochondrial genome sequenced (Simon et al., 1994). One hypothesis that attempts to explain this bias is that the DNA polymerase could use those bases in a more ef-ficient way during mtDNA replication (Clary and Wolstenholme, 1985). The lower energetic cost to break the A-T links during mtDNA replication and transcription would generate AT bias on organisms that rely on mitochon-drial efficiency to keep a high metabolic rate (Xia, 1996). Studies of additional Apidae genomes may indicate whether (and when) this character was fixed by selection for high me-tabolism in the evolutionary history of this group.
Protein-coding genes
The mitochondrial protein-coding genes were ana-lyzed and nucleotide composition, codon usage and size were compared withA. mellifera. The initiation codons in
M. bicolorprotein-coding genes were seven ATT (for
iso-leucine), four ATA, and two ATG (both for methionine). Although the insect mitochondrial genetic code predicts isoleucine for the first codon, it is generally assumed that a special feature on translation changes all mitochondrial ini-tiation codons to methionine on the final amino acid se-quence (Wolstenholme, 1992). As in A. mellifera, there was no anomalous initiation codon (likeD. yakubaATAA; Clary and Wolstenholme, 1985). All M. bicolor stop codons are TAA, the standard for the mitochondrial genetic code (Wolstenholme, 1992). There were no incomplete
codons (T or TA), as found in two genes ofA. melliferaand four ofD. yakuba(Crozier and Crozier, 1993).
The standard insect mitochondrial genetic code was used to analyze M. bicolor mtDNA successfully, since it yielded no stop codons within the gene sequences. The total number of codons (excepting start and stop codons) was 3,643, while theA. melliferagenome has 3,686. The codon usage of allM. bicolorprotein-coding genes was compared withA. mellifera(Table 5). It is possible to observe that there is a preferred codon for each amino acid, generally ending with A or T. Interestingly, these codons are not always the complement to their anticodons, particularly when these lat-ter begin with C or G, a feature that is common in insects (Fosteret al., 1997). InA. mellifera, there are seven codons that are not used at all, and inM. bicolorthere are even more, 12 non-used codons, all ending with C or G.
The AT bias in codon usage can be expressed in terms of the ratio of “G+C” (Pro, Ala, Arg and Gly) to “A+T” rich codons (Phe, Ile, Met, Tyr, Asn and Lys) (Crozier and Cro-zier, 1993). That ratio is 0.43 forD. yakuba, 0.18 forA.
melliferaand 0.14 forM. bicolor,confirming the extreme
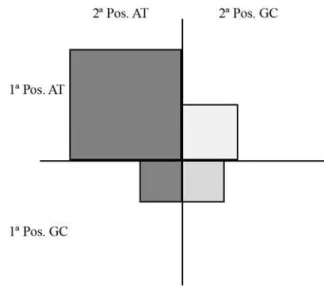
AT bias of bee mtDNA. Fosteret al.(1997) developed a graphical and statistical representation for the nucleotide usage on first and second codon positions, calledsquare
plots, to analyze AT bias on mitochondrial protein-coding
genes. Those graphics do not use the third position because it is too variable and generally does not reflect the amino acid composition. Figure 2 represents the square plot ofM.
bicolor. The AT bias is evident, as most codons are in the
first quadrant (two positions occupied by A or T).
Table 6 summarizes the results obtained for all the protein-coding genes ofM. bicolor, and the comparisons
withA. mellifera. One of the most intriguing features
no-ticed is the size difference for some genes between the two bees. The cytB gene presents the most extreme example, being 102 bp shorter inM. bicolor, such difference is con-centrated at the amino terminal portion of the cytB protein, therefore the reading frame starts 34 codons downstream in reference to A. mellifera. Moreover the former species presents a non-coding region of 94 bp preceding the cytB gene, with 13 possible initiation codons (nine ATT and four ATA). However none of these give rise to a continuous reading frame. Base substitution or even deletion may ex-plain the absence and presence of the initiation codon at dif-ferent positions than expected. This difference becomes more striking if one considers that cytB is one of the most conserved mitochondrial gene (Simonet al., 1994).
Ribosomal RNA genes
mellifera16S gene (Crozier and Crozier, 1993), and their nucleotide similarity was 81%. The 16S G+C content inM.
bicolor is 13.2%, while A. mellifera is 15.4% and
Drosophila yakuba, 17%.
The sequence for the small rRNA subunit (srRNA or 12S) was not obtained completely because it flanks the con-trol region of the mtDNA, which was not amplified. As-suming that this gene has the same length asA. mellifera, we sequenced 55% of it (437 bp). The sequence similarity between A. mellifera and M. bicolor for this sequenced fragment is 79%. As found for 16S, the 12S sequenced stretch presented a higher A+T content (83%) comparing to
A. mellifera(81%) andD. yakuba(79%).
Figure 2- Square plot ofM. bicolormtDNA. Each quadrant is proportion-ally dimensioned to the number of codons that are composed by AT or GC on first position (vertical axis) and on second position (horizontal axis).
Table 6- Comparisons of protein-coding genes betweenM. bicolor(Mbi) andA. mellifera(Ame). Lengths are expressed in basepairs (bp). Start: Start codon; Stop: Stop codon; and Nuc Sim: raw nucleotide similarity be-tween the two bee species. Different start or stop codons are indicated in italic. Gene Length Mbi Length Ame Start Mbi Start Ame Stop Mbi Stop Ame Nuc Sim
ATP6 684 681 ATG ATG TAA TAA 79%
ATP8 168 159 ATT ATT TAA TAA 72%
COI 1560 1566 ATT ATA TAA TAA 86%
COII 678 676 ATT ATT TAA T 82%
COIII 780 777 ATG ATG TAA TAA 77%
CytB 1050 1152 ATT ATG TAA TAA 80%
ND1 930 918 ATA ATT TAA TAA 75%
ND2 939 1002 ATA ATC TAA TAA 69%
ND3 354 354 ATA ATA TAA TAA 73%
ND4 1323 1344 ATT ATA TAA TAA 76%
ND4L 279 264 ATA ATT TAA TAA 72%
ND5 1647 1665 ATT ATT TAA TAA 77%
ND6 540 504 ATT ATT TAA TAA 69%
Table 5- Mitochondrial codons and the absolute number of occurrences on the set of protein-coding genes ofM. bicolor(Mbi) andA. mellifera
(Ame). The anticodon of the corresponding tRNA are presented in paren-thesis and ? indicates the anticodons not determined forM. bicolor.
Amino acid
Codon Mbi Ame Amino
acid
Codon Mbi Ame
Ser (?)
AGA 72 81 Gly
(ucc)
GGA 82 85
AGC 0 2 GGC 0 0
AGG 6 2 GGG 1 3
AGT 22 18 GGT 29 47
Ser (uga)
TCA 143 166 Thr
(ugu)
ACA 45 72
TCC 2 11 ACC 0 5
TCG 0 1 ACG 0 1
TCT 67 53 ACT 37 53
Leu (uag)
CTA 12 36 Asp
(guc)
GAC 1 5
CTC 1 1 GAT 47 52
CTG 0 0
CTT 13 35 Cys
(?)
TGC 2 0
TGT 34 25
Leu (uaa)
TTA 488 472
TTG 15 24 Met
(cau)
ATA 386 312
ATG 14 22
Pro (ugg)
CCA 61 64
CCC 2 3 Tyr
(gua)
TAC 5 10
CCG 0 0 TAT 233 209
CCT 33 36
Phe (gaa)
TTC 17 26
Ala (ugc)
GCA 28 36 TTT 423 354
GCC 1 1
GCG 0 0 Gln
(?)
CAA 38 39
GCT 12 20 CAG 1 2
Arg (ucg)
CGA 28 29 Glu
(uuc)
GAA 65 74
CGC 0 0 GAG 3 5
CGG 1 1
CGT 8 9 His
(gug)
CAC 0 3
CAT 56 57
Val (uac)
GTA 31 53
GTC 0 1 Ile
(?)
ATC 21 26
GTG 0 0 ATT 477 476
GTT 38 67
Lys (uuu)
AAA 174 152
Asn (guu)
AAC 17 11 AAG 1 8
AAT 265 238
Trp (uca)
TGA 71 78
The difference in size observed for the 16S gene is quite small, since we have found variations of 102 bp for protein-coding genes (cytB). Size differences are accept-able on rRNA genes more than on protein-coding genes, since there is no need to maintain a frame to read, and only the secondary structure matters to their function (Wolstenholme, 1992). Castro and Dowton (2005) aligned the 12S and 16S genes of several insects and found
con-served sequence blocks, indicating that the rRNA secondary structure is also conserved as consequence.
Difficulties to amplify the A+T-rich region inM. bicolor
The A+T-rich region appears generally difficult to amplify in insects, mainly due to tandem repeats, hetero-plasmy and great length variation at intra and inter-specific
levels (Zhang and Hewitt, 1997). Also the use of heteros-pecific primers, designed from flanking tRNA gene se-quences, may lead to amplification failure if one of those genes is translocated to another region of the genome (Zhang and Hewitt, 1997).
Our inability to amplify the control region of M.
bicolormay also be explained by its size. Weinlichet al.
(2004) estimated it to be about 3,300 bp long, around 2.5 kb longer than in A. mellifera (Crozier and Crozier, 1993). Normally such differences are due to partial duplications inside this region, a common feature of insect mtDNA (Si-monet al., 1994), which may also make amplification diffi-cult.
Transfer RNA genes
The tRNA genes were mainly identified by eye, using simple local alignment with their homologues in A.
melliferamtDNA. However, when detection was difficult
due to low similarity or translocations, these regions were analyzed with specific software (tRNA-Scan, Lowe and Eddy, 1997), which identifies the genes and folds them in typical cloverleaf structures.
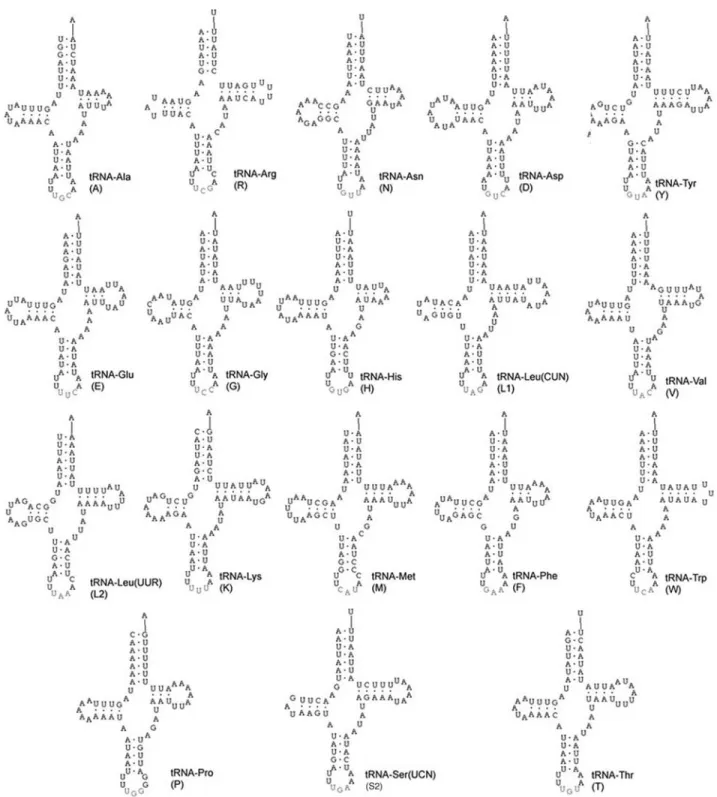
From the 22-23 tRNA genes regularly found in animal mitochondrial genomes, 19 were identified onM. bicolor
mtDNA (Figure 3). The four missing genes were tRNAs for Cys, Gln, Ile and Ser (S1). Although the tRNAIlegene could be identified and positioned on theM. bicolorgenome, its se-quence was not entirely obtained. Analyzing all the M.
bicolortRNA sequences as a whole, we have 1,193 bp, with
11.1% G+C and 88.9% A+T. The proportion of A+T for the same genes ofA. melliferais slightly less: 87.1%.
The secondary structures of tRNAs ofA. melliferaand
M. bicolorwere very similar. Nonetheless, a few differences were found, concentrated at the D and TΨC arms, consid-ered the most variable ones (Clary and Wolstenholme, 1985). The anticodon loop always had seven nucleotides, and its arm always had five base pairs, except onA. mellifera
tRNAVal(4 bp). The acceptor arm was also conserved in size (7 bp), except onM. bicolortRNAArg(6 bp). The anticodons were the same for both species.
Eleven tRNA gene clusters (Figure 1) were identi-fied, comprising the 19 tRNA genes sequenced. Nine tRNA genes ofM. bicolor are on different positions or strands when compared withA. mellifera. Two tRNA genes had their position inferred based on their absence in the pre-dicted or sequenced locations. These 11 genes are distrib-uted in only 4 clusters. This number of translocations is higher than those usually found between pairs of Diptera species (OGRE). The molecular and evolutionary implica-tions of this phenomenon on bees are discussed elsewhere (Silvestreet al., 2002; Silvestre and Arias, 2006).
The KD tRNA cluster in Meliponini
In insects, the junction between the cytochrome oxidase II and ATPase 8 genes normally contains two
tRNA genes, tRNALys(K) and tRNAAsp(D) (e.g.Clary and Wolstenholme, 1985). This junction has been called the KD cluster (Dowton and Austin, 1999), as the plesio-morphic organization is considered to be KD (i.e. COII-K-D-ATP8); this arrangement has been verified in several members of the Hymenoptera, Diptera and Orthoptera. However, inM. bicolorthis cluster is represented only by the tRNAAsp(D) gene, while A. melliferahas the plesio-morphic organization (KD). This observation led us to am-plify, sequence and characterize the KD cluster in 14 Meliponini species, representing the large distributional range of the tribe. Species from Brazil, India, Thailand, Australia and Africa were analyzed; all contained only the tRNAAsp gene (D). In the M. bicolor mitochondrial ge-nome, the tRNALysgene is located in the first tRNA cluster, near the A+T rich region; this region is considered a hot spot of translocation events (Boore and Brown, 1998). Al-though we have not sequenced cluster one in the additional meliponine species (to confirm the location of the tRNALys gene), its absence in the KD cluster is a strong argument that the translocation of this gene occurred very early in the evolutionary history of Meliponini, and seems to be a fixed character of the tribe. Data from other bee families and tribes were obtained (Dowton and Austin, 1999; Silvestre and Arias, unpublished data) and reinforce that this gene re-arrangement is a unique feature of Meliponini.
The mitochondrial genome ofM. bicoloris the first that has been sequenced for stingless bee species. This work provides critical data for future mtDNA analyses of other meliponine species, facilitating the investigation of biological, ecological and evolutionary questions at intra-and inter-specific levels. As several stingless bees are con-sidered endangered, population studies applying molecular tools will be very important in terms of conservation. The sequence obtained here, representing 78% of the total ge-nome, has been available in GenBank since 2003, and has already been used for phylogenetic purposes (Castro and Dowton, 2005) in an attempt to reconstruct the phylogeny of the Holometabola and the position of the Hymenoptera within it. There is an emerging tendency to use complete or nearly complete mtDNA genome sequences for phylogen-etic analysis, while this type of data may also provide gene order characters for phylogenetic inferences (Boore and Brown, 1998; Rawlingset al., 2001). It is worthwhile to note the high rate of tRNA gene rearrangement found in the
M. bicolormitochondrial genome in comparison to other
Meliponini species and their dispersion over the tropical and southern subtropical areas of the World. The inclusion of more molecular data and analysis of other tRNA clusters may provide further clues for the evolution and biogeo-graphy of the Meliponini.
Acknowledgments
Thanks are due to Peter Kwapong, Connal Eardley and Isabel Alves dos Santos for providing specimens from Africa and Thailand. Thanks also to Patricia Drumond, Richard Rowe and Ross Crozier for provision of specimens from Australia. We are grateful to Susy Coelho, Cristina Costa and Ivone Fonseca for their technical assistance, and Dr. Walter Steven Sheppard for his careful reading of the manuscript and suggestions. This work was supported by `Fundação de Amparo à Pesquisa do Estado de São Paulo’ (Fapesp - 99/10969-0).
References
Arias MC, Brito RM, Francisco FO, Moretto G, de Oliveira FF, Silvestre D and Sheppard WS (2006) Molecular markers as a tool for population and evolutionary studies of stingless bees. Apidologie 37:259-274.
Arias MC, Silvestre D, Francisco FO, Weinlich R and Sheppard WS (2008) An oligonucleotide primer set for PCR amplifi-cation of the complete honey bee mitochondrial genome. Apidologie 39, in press.
Beagley CT, Okimoto R and Wolstenholme DR (1998) The mito-chondrial genome of the sea anemone Metridium senile (Cnidaria): Introns, a paucity of tRNA genes, and a near-standard genetic code. Genetics 148:1091-1108.
Boore J (1999) Animal mitochondrial genomes. Nucleic Acids Res 27:1767-1780.
Boore JL (2001) Complete mitochondrial genome sequence of the polychaete annelid Platynereis dumerilii. Mol Biol Evol 18:1413-1416.
Boore JL and Brown WM (1998) Big trees from little genomes: Mitochondrial gene order as a phylogenetic tool. Curr Opin Genet Dev 8:668-674.
Boore JL, Collins TM, Stanton D, Daehler LL and Brown WM (1995) Deducing the pattern of arthropod phylogeny from mitochondrial DNA rearrangements. Nature 376:163-165. Brito RM and Arias MC (2005) Mitochondrial DNA
characteriza-tion of two Partamona species (Hymenoptera, Apidae, Meliponini) by PCR-RFLP and sequencing. Apidologie 36:431-437.
Brown WM (1985) The mitochondrial genome of animals. In: MacIntyre RJ (ed) Molecular Evolutionary Genetics. Plenus Press, New York, pp 95-130.
Castro LR and Dowton M (2005) The position of the Hymenoptera within the Holometabola as inferred from the mitochondrial genome of Perga condei (Hymenoptera, Symphyta, Pergidae). Mol Phylogenet Evol 34:469-479. Castro LR, Austin AD and Dowton M (2002) Contrasting rates of
mitochondrial molecular evolution in parasitic Diptera and Hymenoptera. Mol Biol Evol 19:1100-1113.
Clary DO and Wolstenholme DR (1985) The mitochondrial DNA molecule ofDrosophila yakuba: Nucleotide sequence, gene organization, and genetic code. J Mol Evol 22:252-271. Cornuet JM, Garnery L and Solignac M (1991) Putative origin
and function of the intergenic region between COI and COII
of Apis mellifera L. mitochondrial DNA. Genetics
1128:393-403.
Crozier RH and Crozier YC (1993) The mitochondrial genome of the honeybeeApis mellifera: Complete sequence and the ge-nome organization. Genetics 133:97-117.
Dowton M and Austin AD (1999) Evolutionary dynamics of a mi-tochondrial rearrangement “hot spot” in the Hymenoptera. Mol Biol Evol 16:298-309.
Dowton M and Campbell NJH (2001) Intramitochondrial recom-bination: Is it why some mitochondrial genes sleep around? Trends Ecol Evol 16:269-271.
Dowton M, Belshaw R, Austin AD and Quicke DL (2002) Simul-taneous molecular and morphological analysis of Braconid relationships (Insecta, Hymenoptera, Braconidae) indicates independent mt-tRNA gene inversions within a single wasp family. J Mol Evol 54:210-226.
Dowton M, Castro LR, Campbell SL, Bargon SD and Austin AD (2003) Frequent mitochondrial gene rearrangements at the hymenopteran nad3-nad5 junction. J Mol Evol 56:517-526. Foster PG, Jermiin LS and Hickey DA (1997) Nucleotide compo-sition bias affects amino acid content in proteins coded by animal mitochondria. J Mol Evol 44:282-288.
Francisco FO, Silvestre D and Arias MC (2001) Mitochondrial DNA characterization of five species ofPlebeia (Apidae, Meliponini): RFLP and restriction maps. Apidologie 32:323-332.
Franck P, Garnery L, Solignac M and Cornuet J-M (1998) The ori-gin of west European subspecies of honeybees (Apis mellifera) new insights from microsatellite and mitochon-drial data. Evolution 52:1119-1134.
Garnery L, Cornuet J-M and Solignac M (1992) Evolutionary his-tory of the honey beeApis melliferainferred from mitochon-drial DNA analysis.Mol Ecol 1:145-154.
Garnery L, Mosshine EH, Oldroyd BP and Cornuet J-M (1995) Mitochondrial DNA variation in Moroccan and Spanish honey bee populations. Mol Ecol 4:465-471.
Hall HG and Smith DR (1991) Distinguishing African and Euro-pean honeybee matrilines using amplified mitochondrial DNA. Proc Natl Acad Sci USA 88:4248-4552.
Hoffmann RJ, Boore JL and Brown WM (1992) A novel mito-chondrial genome organization for the blue mussel,Mytilus edulis. Genetics 131:397-412.
Jameson D, Gibson AP, Hudelot C and Higgs PG (2003) OGRe: a relational database for comparative analysis of mitochon-drial genomes. Nucleic Acids Res 31:202-206.
Kerr WE, Carvalho GA and Nascimento VA (1996) Abelha Uru-çu-Biologia, Manejo e Conservação. Fundação Acangaú, Belo Horizonte, 143 pp.
Lowe TM and Eddy SR (1997) tRNAscan-SE: A program for im-proved detection of transfer RNA genes in genomic se-quence. Nucleic Acids Res 25:955-964.
Michener CD (2000) The Bees of the World. The Johns Hopkins University Press, Baltimore, 952 pp.
Nogueira-Neto P (1997) Vida e Criação de Abelhas Indígenas sem Ferrão. Nogueirapis, São Paulo, 446 pp.
Okimoto R, Macfarlane JL, Clary DO and Wolstenholme DR (1992) The mitochondrial genome of two nematodes,
Caenorhabditis elegans and Ascaris suum. Genetics
130:471-498.
Pesole G, Attimonelli M and Liuni S (1988) A backtranslation method based on codon usage strategy. Nucleic Acids Res 5:1715-1728.
Rawlings TA, Collins TM and Bieler R (2001) A major mitochon-drial gene rearrangement among closely related species. Mol Biol Evol 18:1604-1609.
Shao R, Dowton M, Murrell A and Barker SC (2003) Rates of gene rearrangement and nucleotide substitution are corre-lated in the mitochondrial genomes of insects. Mol Biol Evol 20:1612-1619.
Sheppard WS and McPheron B (1991) Ribosomal DNA diversity in Apidae. In: Smith DR (ed) Diversity in the GenusApis. Westview Press, Boulder, pp 89-102.
Silvestre D and Arias MC (2006) Mitochondrial tRNA gene translocations in highly eusocial bees. Genet Mol Biol 29:572-575.
Silvestre D, Francisco FO, Weinlich R and Arias MC (2002) A scientific note on mtDNA gene order rearrangements among highly eusocial bees. Apidologie 33:355-356.
Simon C, Frati F, Beckenbach A, Crespi B, Liu H and Flook P (1994) Evolution, weighting, and phylogenetic utility of mi-tochondrial gene sequences and a compilation of conserved
polymerase chain reaction primers. Ann Entomol Soc Am 87:651-701.
Velthuis HHW, De Vries H and Imperatriz-Fonseca VL (2006) The polygyny ofMelipona bicolor: Scramble competition among queens. Apidologie 37:222-239.
Weinlich R, Francisco FO and Arias MC (2004) Mitochondrial DNA restriction and genomic maps of seven species of Melipona(Apidae, Meliponini). Apidologie 35:365-370. Wolstenholme DR (1992) Animal mitochondrial DNA: Structure
and evolution. Int Rev Cytol 141:173-216.
Xia X (1996) Maximizing transcription efficiency causes codon usage bias. Genetics 144:1309-1320.
Xia X (2000) Data analysis in molecular biology and evolution. Kluwer Academic Publishers, Boston/Dordrecht/London, 296 pp.
Zhang D and Hewitt GM (1997) Insect mitochondrial control re-gion: A review of its structure, evolution and usefulness in evolutionary studies. Biochem System Ecol 25:99-120.
Internet Resources
National Center for Biotechnology Information (NCBI), BLAST searches, http://www.ncbi.nlm.nih.gov/BLAST.
TraceViewer 2.0.1, http://www.codoncode.com. tRNA-Scan, http://lowelab.ucsc.edu/tRNAscan-SE/.
Assistant Editor: Klaus Hartfelder