Variance component estimates applying random regression models for
test-day milk yield in Caracu heifers (
Bos taurus
Artiodactyla, Bovidae)
Lenira El Faro
1, Vera Lucia Cardoso
1and Lucia Galvão de Albuquerque
21
Agência Paulista de Tecnologia dos Agronegócios, Secretaria da Agricultura e Abastecimento,
Ribeirão Preto, SP, Brazil.
2
Departamento de Zootecnia, Faculdade de Ciências Agrárias e Veterinárias,
Universidade Estadual Paulista “Júlio de Mesquita Filho”, Jaboticabal, SP, Brazil.
Abstract
Random regression models (RRM) were used to estimate covariance functions for 2,155 first-lactation milk yields of native Brazilian Caracu heifers. The models included contemporary group (defined as year-month of test and pad-dock) fixed effects, and quadratic effect of age of cow at calving. Genetic and permanent environmental effects were fitted by a random regression model and Legendre polynomials of days in milk (DIM). Schwarz’s Bayesian informa-tion criteria (BIC) indicated that the best RRM assumed a six coefficient funcinforma-tion for both random effects and a sixth order variance function for residual structure. Akaike’s information criteria suggested a model with the same number of coefficients for both effects and a residual structure fitted by a step function with 15 variances. Phenotypic, additive genetic, permanent environmental and residual variances were higher at the beginning and declined during lacta-tion. The RRM heritability estimates were 0.09 to 0.26 and generally higher at the beginning and end of lactalacta-tion. Some unexpected negative genetic correlations emerged when higher order covariance functions were used. A model with four coefficients for additive genetic covariance function explains more parsimoniously the changes in ge-netic variation with DIM since the gege-netic parameter was more acceptable and BIC was close to that for a six coeffi-cient covariance function.
Key words:covariance functions, dairy cattle, genetic parameters, longitudinal data, milk yield. Received: June 27, 2007; Accepted: January 23, 2008.
Introduction
In animal husbandry, repeated measurements of the same individual have been analyzed using several different approaches, with repeatability models and test-day models (TDMO) using univariate or multivariate analyses having been the customary approach to model such measurements. More recently, however, instead of the traditional cumula-tive 305-day analysis random regression models (RRM) have been used as an alternative for the genetic evaluation of dairy cattle.
The use of RRM allow fitting individual random lac-tation curves as deviations of a mean trend, using ordinary polynomials or other linear functions. In addition, they per-mit the estimation of (co)variance structures between dif-ferent tests using covariance functions. Covariance func-tions, proposed by Kirkpatricket al.(1990) for the analysis of longitudinal data (for example, growth or lactation
mea-surements), are equivalent to covariance matrices for the multivariate models of finite dimension. What makes covariance functions interesting is their ability to describe gradual changes in covariances over time, and to estimate punctual variances and covariances along a trajectory, even if little or no information between points is available.
With RRM, it is possible to produce estimated breed-ing values (EBVs) for the lactation curves of each animal and for the components of the curves such as lactation per-sistency (Ptak and Schaeffer, 1993; Jamrozik and Schaeffer, 1997). This might be important when selecting animals from breeds with low lactation persistency, such as Zebu (Bos indica) or native breeds, as well as crossbreds.
In general, RRM heritability estimates are higher than those obtained by TDMO, indicating higher genetic vari-ability both at the beginning and at the end of the lactation. Some authors have reported overestimation of heritability or unexpected genetic correlations between test day milk yields (TDMY) at different stages of lactation using RRM (Jamrozik and Schaeffer, 1997; Jamroziket al., 1997a,b; Brotherstoneet al., 2000; Kettunenet al., 2000).
www.sbg.org.br
Send correspondence to Lenira El Faro. Secretaria da Agricultura e Abastecimento, Av. Bandeirantes 2419, 14030-640 Ribeirão Preto, SP, Brazil. E-mail: [email protected].
In Brazil and most Latin America countries, milk pro-duction is based on crossbred cows resulting from the mat-ing of Zebu or native breed cows with bulls of specialized European breeds. The Caracu breed is considered to be a native Brazilian breed originating from Iberian cattle brought to Brazil during colonization but, however, esti-mates of covariance function for the milk yield of Zebu and Brazilian native cattle breeds are not frequent.
The objective of the study described in this paper was to estimate additive genetic and permanent environmental covariance functions for Caracu TDMY using RRM with different residual variances structures.
Material and Methods
In this study we used information collected from a 2,500 head herd of Caracu cattle of all age categories held at Recreio Farm in the municipality of Poços de Caldas in the southeastern Brazilian state of Minas Gerais (MG). The farm had 14 paddocks, where cows were allocated accord-ing to lactation stage and production level. Cows were milked by hand, twice a day, in the presence of the calf. One quarter was left for feeding the calf during the whole lacta-tion period. During the rainy season (October to May), cows were kept on pastures, receiving corn silage supple-mentation during the dry season. All cows received concen-trate supplementation after milking. A breeding season was adopted and cows were submitted to natural mating during April to February. Up to 1995 heifers were mated at two years of age and a body weight of 300 kg to 400 kg, but after 1995 the first mating was at 17 months and a body weight of 350 kg.
We analyzed 86,698 weekly records from 2,155 first-lactation heifers recorded between 1978 and 1998. There were from 6 to 43 TDMY per lactation and over 94% of the lactations had at least 35 tests. Days in milk ranged from 5 days to 305 days and were grouped into 43 weekly classes. The average age at first calving was 35.68 months, with a standard deviation of 4.06 months.
Univariate RRM were used to estimate covariance functions for TDMY. The additive genetic and permanent environmental effects were modeled by polynomials on a Legendre scale with functions ranging from 4 to 6 coeffi-cients. The model included fixed effects of contemporary group and linear and quadratic effects of calving age. The population mean trend was modeled by a four coefficient cubic regression on the Legendre polynomial of days in milk based on the smallest mean square errors after adjust-ing functions from 2 to 5 coefficients. There were 1,582 contemporary groups, defined as year-month of record and paddock. Temporary environmental effects were assumed to be independently distributed, with heterogeneous resid-ual variances modeled by a step function with 15 classes (σ2ei, i = 1,15), or by a sixth order ordinary polynomial vari-ance function. Classes of residual varivari-ances were: 1, 2, 3,
4-5, 6-7, 8-9, 10-11, 12-13, 14-16, 17-25, 26-30, 31-35, 36-38, 39-42 and 43 weeks of lactation, based on a previous study (El Faro and Albuquerque, 2003).
The general random regression model can be repre-sented as:
y=Xb Za Wc e+ + +
wherey= vector ofNobservations, measured inNd
recor-ded animals;b= vector of fixed effects;a= vector of solu-tions for additive genetic random coefficients;c= vector of solutions for permanent environmental random coeffi-cients;e= vector of N different residuals;X,Z,W= inci-dence matrices for fixed and additive genetic and perma-nent environmental random effects, respectively.
The assumptions with respect to the components of the model were:
E y a c e Xb = 0 0 0 ; and
V a K A
V c K I
V e R
a c Nd ( ) ; ( ) ; ( ) , = ⊗ = ⊗ =
whereKaandKcare the genetic and permanent
environ-mental covariance matrices between random regression co-efficients, respectively. A is the additive genetic relation-ship matrix;INdis an identity matrix of dimensionNd, andR
represents a diagonal matrix containing the residual vari-ances. For days in milk ti and tj, standardized to the interval -1 to 1, the genetic (G) and permanent environmental (C) covariances between test-day milk yields were estimated by
(
)
G t t K t
t
i i a
j j = 1 1 2 2 K K and
(
)
C t t K t
t
i i c
j j = 1 1 2 2 K K
When the structure of residual variances were fitted by variance function, the variances were estimated by:
Ve Ve rtij r r q i 2 2 1 0 1 = + =
∑
β ,Ve0 2
corresponds to variance intercept,βrare theqregression
coefficients of VF andtijare weeks of lactation.
The additive genetic eigenvalues with small varia-tions were set to an operational zero (10-18), forcing esti-mates of theKa matrix to have a reduced rank (m). The
reduced fromk(k+1)/2coefficients tokm-m(m-1)/2 coeffi-cients, withk =order of the polynomial function (Meyer, 1998b).
Variance components were estimated by the re-stricted maximum likelihood method (REML) using the DXMRR program from the DFREML package (Meyer, 1998a). Standard univariate analysis considering a finite di-mension model (TDMO) was carried out for 21 TDMY (Table 1), with a univariate animal model containing the contemporary groups, age of cow (linear and quadratic) and days in milk (linear) as fixed effects and additive genetic as random effect. Variance components were estimated by the restricted maximum likelihood method (REML) using MTDF package (Boldmanet al., 1995).
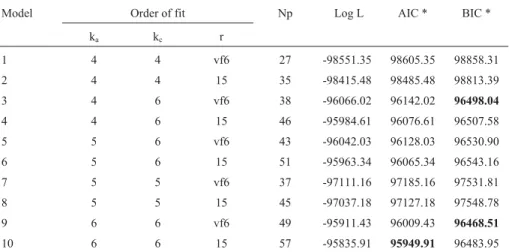
The RRM, with different orders of fit, were compared by Akaike’s information criterion (AIC) and Schwarz’s Bayesian information criterion (BIC) (Wolfinger, 1993; Nunez-Antón and Zimmerman, 2000), both of which im-pose penalties according to the number of parameters to be estimated.
Ten different RRM were compared to identify the best order of covariance functions for additive genetic and permanent environmental effects and for residual structures of variances. The number of covariance function coeffi-cients was denoted respectively, as ka and kc, for genetic and permanent environmental random effects. For both ef-fects, the number of coefficients ranged from 4 to 6. The re-sidual variances were denoted vf6, for the variance function or c15 for a step function with fifteen classes.
Results and Discussion
The overall TDMY mean 5.09 kg with a standard de-viation of 2.30 kg. The number of records decreased as lac-tation progressed and larger variations in milk yields were observed at the end of lactation (Table 1).
Modeling the residual variances by a step function with 15 classes (c15) instead of a sixth order variance func-tion (vf6) increased the log-likelihood funcfunc-tion (log L) and AIC decreased, independent of the other components in the model (Table 2). However, in general, the BIC results fa-vored the variance function model, probably because this criterion attributes a more stringent penalty for the number of parameters to be estimated.
Changing the number of coefficients of genetic and permanent environmental covariance functions from 4 (cu-bic) to 6 (quintic) increased log L (Table 2). For AIC, the best fit model had ka= 6, kc= 6 and a step function with 15 classes of residual variances (model 10) and 57 parameters to be estimated. However, the BIC results indicated that a model with ka= 6, kc= 6 and a variance function (model 9) with 49 parameters to be estimated was sufficient to ade-quately model the covariance structures. Based on LRT, re-ducing the rank of kafrom 6 to 5 or 4 (not shown) did not significantly affect log L. López-Romero and Carabaño (2003) also found that BIC results favored less
parame-terized models, and those considering orders from 2 to 3 for kaand 5 to 6 for kc, with homogeneity of residual variances, were indicated.
The structure of residual variances (vf6 or c15) did not affect the partition of variances for models 9 and 10. The variance of intercept was 0.656 and the coefficients of variance functions for residual structure were, -0.577, 1.288, -0.279, -1.154, -0.621 and 0.973, respectively, for linear to 6th order. No differences in residual variance estimates were observed between these models (Figure 1).
Covariance component and heritability estimates
Genetic covariance estimates (not shown) between TDMY, at the beginning and the end of lactation, obtained by the two best RRM models based on BIC, were negative. Moreover, the genetic covariance surfaces estimated with these models were not smooth. It has been found that higher order polynomials usually produce “wiggly” functions (Kirkpatricket al., 1990 and Meyer, 1998b). An alternative less parameterized model was used to compare the trends in parameters. It was observed that a model considering ka= 4, kc= 6 and a variance function for residuals (model 3) had BIC values slightly higher than model 9 and did not show
Table 1- Days in milk, number of records, overall means and standard de-viations of test-day milk yields (TDMY) for the univariate model.
Week Day in milk Number of records Mean±SD (kg)
2 12-18 2059 7.25±2.53
4 26-32 2076 7.42±2.51
6 40-46 2087 7.18±2.34
8 54-60 2092 6.99±2.09
10 68-74 2120 6.68±1.98
12 82-88 2129 6.30±1.89
14 96-102 2130 5.80±1.77
16 110-116 2138 5.42±1.69
18 124-130 2142 5.09±1.63
20 138-144 2132 4.93±1.60
22 152-158 2130 4.76±1.59
24 166-172 2137 4.60±1.56
26 180-186 2135 4.46±1.55
28 194-200 2134 4.32±1.55
30 208-214 2136 4.15±1.57
32 222-228 2121 3.97±1.59
34 236-242 2099 3.69±1.61
36 250-256 2026 3.41±1.60
38 264-270 1875 3.16±1.56
40 278-284 1614 2.96±1.49
negative covariance estimates or “wiggly” surface. Results will be presented and compared for model 9 and model 3.
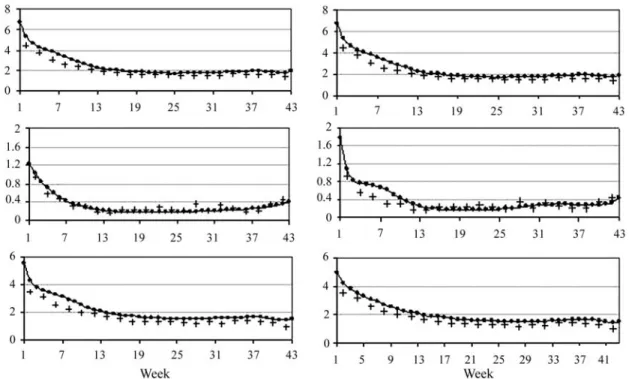
Phenotypic, additive genetic, permanent environ-mental and residual variances were higher at the beginning of lactation, decreasing thereafter. For RRM, residual plus permanent environmental variances (σ2e+σ2ap) were pre-sented and compared with residual variances for standard univariate model (TDMO). When analyzing standard univariate models, the environmental variances are not split in permanent and temporary. Therefore, to compare esti-mates obtained from the three models, the environmental temporary and permanent variances obtained from RRM were summed (Figure 2). Phenotypic variances (σ2p) esti-mated either by RRM or by standard univariate analysis were similar. In relation toσ2e+σ2apfor MRA and toσ2efor TDMO, a similar behavior was observed for the variances. Genetic variance estimates obtained with both RRM (4,6,vf6 and 6,6,vf6) were similar and close to those ob-tained by univariate analysis. In general, the variance esti-mates were higher at the beginning of the lactation and decreased thereafter, with exception of genetic variance es-timates which slightly increased at the end of lactation.
Heritability estimates obtained with the two RRM (4,6,vf6 and 6,6,vf6) and by univariate analysis are pre-sented in Figure 3. The heritability estimates obtained with the TDMO ranged from 0.09 (12th week) to 0.32 (42nd week), with higher estimates at the end of lactation, proba-bly due to the lower number of records at these points. Heritabilities estimated by the 6,6,vf6 model ranged from 0.09 to 0.26, while those estimated by the 4,6,vf6 model ranged from 0.09 to 0.21. For both RRM, the estimates were lower during mid-lactation, from 14thto 30thweek. In general, RRM heritability estimates were similar to those obtained by TDMO, with larger differences in test day milk yields around 14thto 28thweeks. The estimates obtained by 6,6,vf6 model oscillated more than those from 4,6,vf6 model, with higher heritabilities observed at the extremes of lactation. Trends of the heritability estimates, obtained by RRM, followed those reported in the literature, i.e., higher estimates at the beginning and towards the end of lactation (Strabel and Misztal, 1999; Tijaniet al., 1999; Brotherstoneet al., 2000). Difficulties to model the vari-ances at the extremes of lactation can be explained, in part, by the biological processes that occur at the beginning of lactation and the smaller number of records at the end. For Zebu and tropical native breeds, both reasons can be even more important. In general, these animals have not been as intensively selected for milk production as Holsteins and population sizes are smaller. It is usually necessary to keep the calf with the dam during milking and short lactations are frequent.
Due to the high order of genetic covariance function (ka= 6), oscillations in heritability estimates were observed along the trajectory. Although the estimates obtained by standard univariate analysis had shown a similar pattern for the heritabilities at the end of lactation, like the RRM with ka= 6, a less parameterized model for additive genetic effect,
e.g.4,6,vf6 model seems to be more consistent biologically.
Table 2- Order of fit for additive genetic (ka) and permanent environmental (kc) effects and residual structures (r), number of parameters (Np), log likeli-hood function (log L), Akaike’s information criterion (AIC) and Bayesian information criterion (BIC).
Model Order of fit Np Log L AIC * BIC *
ka kc r
1 4 4 vf6 27 -98551.35 98605.35 98858.31
2 4 4 15 35 -98415.48 98485.48 98813.39
3 4 6 vf6 38 -96066.02 96142.02 96498.04
4 4 6 15 46 -95984.61 96076.61 96507.58
5 5 6 vf6 43 -96042.03 96128.03 96530.90
6 5 6 15 51 -95963.34 96065.34 96543.16
7 5 5 vf6 37 -97111.16 97185.16 97531.81
8 5 5 15 45 -97037.18 97127.18 97548.78
9 6 6 vf6 49 -95911.43 96009.43 96468.51
10 6 6 15 57 -95835.91 95949.91 96483.95
* Values in boldface type indicate the best models.
The magnitude of heritability estimates in the present study was smaller than those reported for European breed cows in Brazil (Meloet al., 2005 and Cobuciet al., 2005) and in temperate regions (Jamrozik and Schaeffer, 1997; Jamroziket al., 1997a,b; Oloriet al., 1999). Jamrozik and Schaeffer (1997), using the parametric function described by Ali and Schaeffer (1987), obtained heritability estimates ranging from 0.40 to 0.59, with higher values during the first ten days of lactation. Oloriet al.(1999), using RR on orthogonal polynomials of days in milk with orders varying from three to five, estimated heritabilities ranging from 0.22 to 0.52. They also found that, in general, TDMY at the end of lactation (around the 35thweek) were more heritable than those obtained at earlier stages.
Regarding Zebu breeds, e.g. Gyr, heritability esti-mates have been higher than those obtained for Holstein cattle. Costaet al.(2005) presented estimates ranging from 0.71 at the earlier to 0.27 at the end of lactation.
Correlation estimates
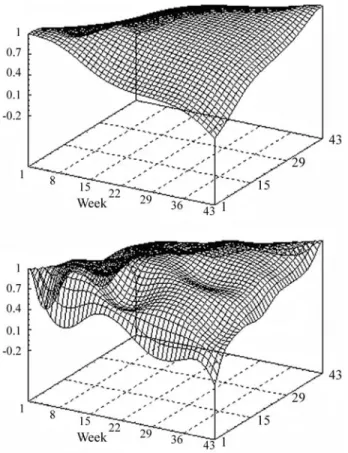
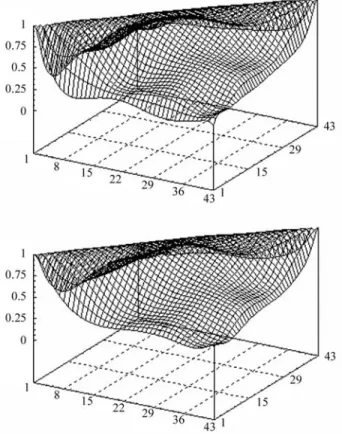
Phenotypic correlation estimates ranged from 0.09 to 0.77 and were very close for both RRM (4,6,vf6 and 6,6,vf6). The estimates were higher between adjacent re-cords (Figure 4). Other authors have reported the same trend, with positive estimates that are higher between closer productions (Lidaueret al., 2003; Mayereset al., 2004). As expected, permanent environmental correlation estimates obtained with both models were similar, since both had the same order of fit, and ranged from 0.25 to 0.99 (Figure 5). Some oscillations were observed in surfaces for both RRM, although a smoother pattern had been expected. In general, genetic correlations were higher than permanent environ-mental and phenotypic correlations, but estimates de-creased more drastically with the increase in days between records.
Some differences in genetic correlation estimates were observed between models (Figure 6). Genetic correla-tions for the 6,6,vf6 model were not as smooth as those
Figure 2- Phenotypic (top), genetic (middle) and environmental (bottom) variance estimates from 4,6,vf6 (left) and 6,6,vf6 (right) random regression and standard univariate (+) analysis.
obtained by the 4,6,f6 model, probably because of the higher order polynomial used for kain the first model. It is to be expected that a higher order polynomial is more flexi-ble, following the changes of (co)variances with age more closely and producing “wiggly” surfaces (Meyer, 1998b). In general, genetic correlation estimates were higher be-tween adjacent tests, decreasing markedly with the increase of test intervals. Estimates ranged from -0.15 to 0.99 for the 6, 6, vf6 model and from 0.03 to 0.99 for the 4,6,vf6 model. Irrespectively of the residual variance structure, vf6 or c15, negative genetic correlations were observed between tests at the beginning and at the end of lactation with the model with ka = 6. These estimates may suggest over-parame-terization of these RRM. The estimates for 4,6,vf6 random regression model were similar to those obtained with the di-mension finite model, whose genetic correlation ranged from 0.2 to 1.0, and seem to be more acceptable.
Negative genetic correlations between yields during early and late lactation were also obtained by Brotherstoneet al.(2000), using parametric functions to fit RRM, such as Wilmink and Ali and Schaeffer func-tions, for Holstein TDMY. López-Romero and Carabaño (2003) pointed out that these parametric functions tend to overestimate the genetic variances and underestimate the genetic correlations between milk yield at the beginning and the end of lactations. Probably this is also truth for
Legendre polynomials. Those authors also found that high order Legendre polynomials produced “wiggly” func-tions, with variance patterns different from those at ex-pected in biological processes.
Estimates of (co)variances and correlations between random regression coefficients for 4,6,vf6 and 6,6,vf6 models are presented in Table 3. For both models the most variable coefficient was the intercept. The correlation be-tween fourth and fifth additive genetic random regression coefficients was high and negative, resulting in an eigenvalue close to zero for the fifth coefficient, for the 6,6,vf6 model. Independently of the model, the correlations between all permanent environmental coefficients were of low magnitude. In both the 4,6,vf6 and 6,6,vf6 models, per-manent environmental coefficient matrix eigenvalues were higher than those of the additive genetic effect. These re-sults could justify higher orders for permanent environ-mental covariance functions than for additive genetic, as also reported by other authors (Brotherstoneet al., 2000; Pool et al., 2000; López-Romero and Carabaño, 2003). López-Romero and Carabaño (2003) reported that increas-ing the order of fit for the permanent environmental effect resulted in a clear improvement of statistics employed in the model comparison. However, when increasing the order of fit for the additive genetic effect, the model improvement was smaller. Similar results have also been reported for
Figure 4- Estimates of phenotypic correlations between TDMY obtained
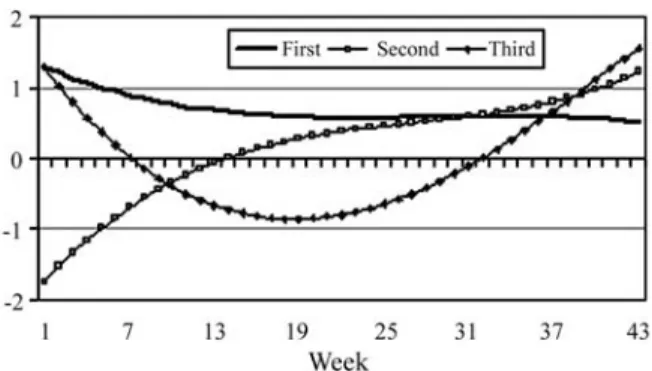
Holstein cows (López-Romero and Carabaño, 2003). A similar trend has also been reported for growth traits (Meyer, 1998b; Albuquerque and Meyer, 2001). For both random effects, the highest variations were associated with the first and second eigenvalues (Table 3). For both the 4,6,vf6 and 6,6,vf6 models the first three eigenvalues of the additive genetic covariance function accounted for about 96% of the sum of all eigenvalues. These values are similar to those reported by Poolet al.(2000), with the first three eigenvalues explaining 98% of the total genetic variation. In our study, the leading eigenvalue accounted for 70% (6,6,vf6 model) and 73% (4,6,vf6 model) of the sum of all eigenvalues. These results suggest that a reduced rank model or a kawith smaller order could be used.
The additive genetic eigenfunctions for the 4,6,vf6 model are shown in Figure 7. The same pattern of additive genetic eigenfunctions was observed for the 6,6,vf6 ran-dom regression model. The main eigenfunction, corre-sponding to the largest eigenvalue, provided only positive values along the trajectory and did not show any large changes during lactation. The major part of the observed genetic variance can be explained by a factor which is prac-tically constant throughout lactation, suggesting that if se-lection were based on any TDMY genetic gains would be obtained for all periods. A similar pattern was also obtained
by Oloriet al.(1999), with the leading eigenvalue account-ing for 93% of total variation.
The second eigenfunction was associated with an eigenvalue of 0.142, corresponding to 23% of the total ge-netic variation. The corresponding eigenfunction was nega-tive up to the 13thweek and positive during later weeks. This indicates an antagonistic relationship between initial
Table 3- Estimates of variances (diagonal, boldface type), covariances (lower diagonal) and correlations (upper diagonal) between random re-gression coefficients and eigenvalues (λ) for additive genetic effects and permanent environmental effects based on the coefficient matrices for two models, one with an order of fit of 6,6,vf6 (ka= 6, kc= 6) and a variance function for residuals (model 10) and the other with an order of fit of 4,6,vf6 (ka= 4, kc= 6) and a variance function for residuals (model 3). The abbreviations ka and kc are the genetic and permanent environmental covariance matrices between random regression coefficients respectively, while vf is the variance function.
Model with 6,6,vf6 order of fit Random regression coefficients
Eigenvalues (λ) 0 1 2 3 4 5
Additive genetic effect
0.5044 0.4758 -0.26 0.40 -0.27 -0.34 0.26 0.1347 -0.0665 0.1334 -0.58 0.53 0.03 -0.08 0.0183 0.0517 -0.0393 0.0348 -0.53 0.05 0.004 0.0086 -0.0238 0.0246 -0.0126 0.0162 -0.33 0.58 0.0652 -0.0476 0.0025 0.0018 -0.0085 0.0404 -0.90 0.0000 0.0312 -0.0052 0.0001 0.0129 -0.0318 0.0306
Permanent environmental effect
1.5163 1.5052 -0.13 -0.04 -0.01 -0.17 -0.05 0.4001 -0.0984 0.3617 -0.29 -0.06 0.15 -0.43 0.1867 -0.0249 -0.0799 0.2122 -0.19 -0.20 0.10 0.1177 -0.0046 -0.0119 0.0279 0.1052 -0.29 -0.31 0.0564 -0.0567 0.0239 -0.0253 -0.0260 0.0754 -0.11 0.0195 -0.0116 -0.0500 0.0087 -0.0192 -0.0059 0.0369
Model with 4,6,vf6 order of fit Random regression coefficients
Eigenvalues (λ) 0 1 2 3 4 5
Additive genetic effect 0.4566 0.4358 -0.23 0.40 -0.34 0.1422 -0.0565 0.1388 -0.58 0.64 0.0196 0.0496 -0.0413 0.0360 -0.56 0.0076 -0.0282 0.0297 -0.0131 0.0154
Permanent environmental effect
0.4012 -0.1056 0.3596 -0.29 -0.08 0.14 -0.37 0.1872 -0.0234 -0.0799 0.2119 -0.18 -0.15 0.08 0.0864 -0.0032 -0.0158 -0.0275 0.1063 -0.31 -0.09 0.1360 -0.0924 0.0288 -0.0237 -0.0333 0.1111 -0.42 0.0287 0.0157 -0.0573 0.0098 -0.0074 -0.0365 0.0668 Figure 6- Estimates of permanent environmental correlations between
milk yields (up to 13 weeks) and milk yields during the re-maining lactation period. The third eigenfunction indicates a positive and favorable relationship between yields up to the 9thweek and from the 32ndweek on, and an unfavorable relationship with mid-lactation yields. Changes in sign ob-served for the 2ndand 3rdeigenfunctions suggest the exis-tence of factors with contrasting effects between stages of lactation, but they account for a small proportion of the ad-ditive genetic variance. Although eigenfunctions can iden-tify the most probable changes in the trajectory of lactation, selection based on these components or on canonic vari-ables is still uncertain.
The difficulties of establishing criteria for the choice of the best RRM are evident in our study. In principle, the AIC and BIC tests were regarded as being sufficient for se-lection, but, in fact, the estimates of genetic parameters also proved to be helpful. The literature shows that, in general, the choice of models are based either on AIC or BIC, with preference being given to the BIC results because they are more rigorous concerning the number of parameters in the model. In our study, the BIC test indicated that the 6,6,vf6 model was the best. Negative genetic covariances between TDMY, however, could suggest an overparameterization of the model for the additive effect since a model with a smaller order of kadid not produce the same negative esti-mates, therefore providing a more parsimonious fit. We ex-pected to obtain covariance or correlation structures de-scribing smoother patterns for the surfaces, but this was not observed for the additive genetic effect when kawas equal to six coefficients (Figure 4). In previous studies using the same data set and applying standard bivariate analyses, El Faro and Albuquerque (2003) did not observe negative ge-netic correlation estimates between test day yields.
During the lactation trajectory we observed oscilla-tions in heritability estimates due to the high order of ge-netic covariance function (ka= 6). Although the estimates obtained by standard univariate analysis showed patterns similar to those obtained by the RRM with ka= 6 at the end of lactation, a less parameterized model (e.g., the 4,6,vf6 model) for additive genetic effect provided lower estimates at the extremes and seems to be biologically more
consis-tent. Unlike the univariate estimates, which were highest at mid-lactation, the RRM heritability estimates were gener-ally higher at the extremes of the lactation curves. The be-ginning of lactation is marked by biological processes which are difficult to model, a fact emphasized by the higher residual variances estimated by us during this pe-riod. However, fewer records are available at the end of lac-tation for Zebu and Caracu animals due to shorter laclac-tation and management decisions. This is a problem yet to be solved in the application of random regression models.
Although the use of RRM in dairy cattle breeding has been questioned (Druetet al., 2005; Strabel et al., 2005; Strabel and Jamrozik, 2006) the possibility of estimating breeding values for milk persistency is an undeniable ad-vantage of this methodology (Schaeffer, 2004). In tropical countries, milk production is largely based on Zebu cattle and their crosses or tropical native breeds characterized by low persistency of lactation, this methodology represents an important tool for the improvement of milk production. The application of these models in animal breeding pro-grams has proved to be feasible as they already have being implemented in some countries (Schaeffer, 2004).
Based on the absence of interference of the structure of residual variances (step function or variance function) on genetic parameters, and on BIC test results, we concluded that a model with residual variances function would be suf-ficient to model such structure. Despite the fact that the AIC and BIC tests indicated that a RRM with six additive ge-netic and permanent environmental coefficients would be the most adequate, the genetic parameters estimated for the best model according to these tests suggest that overpara-meterization for the additive genetic effect may have oc-curred. A model with four coefficients for additive genetic covariance function seems to be sufficient to explain more parsimoniously the changes in genetic variation with days in milk.
Acknowledgments
The authors thank the Recreio farm, in special Mr. Andre Stein Carvalho Dias, for providing the data and Dr Karin Meyer for helping in the beginning of this work. We gratefully acknowledge the Conselho Nacional de Pesquisa Científica (CNPq), Brazil, for the first authors’ scholarship.
References
Albuquerque LG and Meyer K (2001) Estimates of covariance functions for growth from birth to 630 days of age in Nelore cattle. J Anim Sci 79:2776-2789.
Ali TE and Schaeffer LR (1987) Accounting for covariances among test day milk yields in dairy cows. J Anim Sci 67:637-644.
Boldman KG, Kriese LA, Van Vleck LD, Van Tassel CP and Kachman SD (1995) A Manual for Use of MTDFREML. A Set of Programs to Obtain Estimates of Variances and Covariances [DRAFT]. USDA-ARS, Clay Center, 114 pp.
Brotherstone S, White IMS and Meyer K (2000) Genetic model-ing of daily yield usmodel-ing orthogonal polynomials and para-metric curves. J Anim Sci 70:407-415.
Cobuci JA, Euclydes RF, Lopes OS, Costa CN, Torres RA and Pereira CS (2005) Estimation of genetic parameters for test-day milk yield in Holstein cows using a random regres-sion model. Genet Mol Biol 28:75-83.
Costa CN, Melo CM, Machado CH, Freitas AF, Packer IU and Cobuci JA (2005) Parâmetros genéticos para a produção de leite de controles individuais de vacas da raça Gir estimados com modelos de repetibilidade e regressão aleatória. Rev Bras Zootec 34:1519-1530.
Druet T, Jaffrézic F and Ducrocq V (2005) Estimation of genetic parameters for test day records of dairy traits in the first three lactations. Genet Sel Evol 37:257-271.
El Faro L and Albuquerque LG (2003) Estimação de parâmetros genéticos para produção de leite no dia do controle e para a produção acumulada em até 305 dias para primeiras lacta-ções de vacas da raça Caracu. Rev Bras Zootec 32:284-294. Jamrozik J and Schaeffer LR (1997) Estimates of genetic
parame-ters for a test day model with random regressions for yield traits of first lactation Holsteins. J Dairy Sci 80:762-770. Jamrozik J, Kistemaker Gj, Dekkers JCM and Schaeffer LR
(1997a) Comparison of possible covariates for use in a ran-dom regression model for analyses of test day yields. J Dairy Sci 80:2550-2556.
Jamrozik J, Schaeffer LR, Liu L and Jansen G (1997b) Multiple trait random regression test day model for production traits. In: Proc 16th Interbull Meeting, Vienna, pp 43-47. http://
www-interbull.slu.se/bulletins/bulletin16/Jamrozik.pdf (Ja-nuary, 2008).
Kettunen A, Mäntysaari EA and Pösö J (2000) Estimation of ge-netic parameters for daily milk yield of primiparous Ayr-shire cows by random regression test-day models. Livestock Prod Sci 66:251-261.
Kirkpatrick M, Lofsvold D and Bulmer M (1990) Analysis of the inheritance, selection and evolution of growth trajectories. Genetics 124:979-993.
Lidauer M, Mantysaari EA and Stranden I (2003) Comparison of test-day models for genetic evaluation of production traits in dairy cattle. Livestock Prod Sci 79:73-86.
López-Romero P and Carabaño MJ (2003) Evaluating alternative random regression models to analyse first lactation daily milk yield data in Holstein-Friesian cattle. Livestock Prod Sci 82:81-96.
Mayeres P, Stoll J, Bormann J, Reents R and Gengler N (2004) Prediction of daily milk, fat, and protein production by a ran-dom regression test-day model. J Dairy Sci 87:1925-1933. Melo CMR, Costa CN, Packer IU and Machado PF (2005)
Parâ-metros genéticos para as produções de leite do dia do con-trole e da primeira lactação de vacas da raça holandesa. Rev Bras Zootec 34:796-806.
Meyer K (1998a) DXMRR – A program to estimate covariance functions for longitudinal data by REML. In: Proc. 6thWorld
Congr Genet Appl Livest Prod, Armidale, Australia, v. 27, pp 465-466.
Meyer K (1998b) Estimating covariance functions for longitudi-nal data using a random regression model. Genet Sel Evol 30:221-240.
Nunez-Antón VN and Zimmerman DL (2000) Modeling non-stationary longitudinal data. Biometrics 56:699-705. Olori VE, Hill WG, Mcguirk BJ and Brotherstone S (1999)
Esti-mating variance components for test day milk records by re-stricted maximum likelihood with a random regression ani-mal model. Livestock Prod Sci 61:53-63.
Pool MH, Janss LLG and Meuwissen THE (2000) Genetic param-eters of Legendre polynomials for first parity lactation curves. J Dairy Sci 83:2640-2649.
Ptak E and Schaeffer LR (1993) Use of test day yields for genetic evaluation of dairy sires and cows. Livestock Prod Sci 34:23-34.
Schaeffer LR (2004) Application of random regression models in animal breeding. Livestock Prod Sci 86:35-45.
Strabel T and Jamrozik J (2006) Genetic analysis of milk produc-tion traits of Polish Black and White cattle using large-scale random regression test-day models. J Dairy Sci 89:3152-3163.
Strabel T and Misztal I (1999) Genetic parameters for first and second lactation milk yields of Polish Black and White cattle with random regression test-day models. J Dairy Sci 82:2805-2810.
Strabel T, Szyda J, Ptak J and Jamrozik J (2005) Comparison of random regression test-day models for Polish Black and White cattle. J Dairy Sci 88:3688-3699.
Tijani A, Wiggans GR, Van Tassel CP, Philpot JC and Gengler N (1999) Use of (co)variance functions to describe (co)vari-ances for test day yield. J Dairy Sci 82(supplement):226. Wolfinger R (1993) Covariance structure selection in general
mixed models. Commun Statist 22:1079-1106.
Associate Editor: Pedro Franklin Barbosa