Test-day milk yield as a selection criterion for dairy buffaloes
(
Bubalus bubalis
Artiodactyla, Bovidae)
Humberto Tonhati
1, Mário Fernando Cerón-Muñoz
2, João Ademir de Oliveira
1, Lenira El Faro
3,
André Luís Ferreira Lima
1and Lucia Galvão de Albuquerque
11
Faculdade de Ciências Agrárias e Veterinárias, Universidade Estadual Paulista “Júlio de Mesquita Filho”,
Jaboticabal, SP, Brazil.
2
Universidad de Antioquia, Medellín, Colombia.
3
Agência Paulista de Tecnologia dos Agronegócios, Ribeirão Preto, SP, Brazil.
Abstract
Due to the great demand for buffalo milk by-products the interest in technical-scientific information about this species is increasing. Our objective was to propose selection criteria for milk yield in buffaloes based on total milk yield, 305-day milk yield (M305), and test-day milk yield. A total of 3,888 lactations from 1,630 Murrah (Bubalus bubalis) cows recorded between 1987 and 2001, from 10 herds in the State of São Paulo, Brazil, were analyzed. Covariance components were obtained using the restricted maximum likelihood method applied to a bivariate animal model. Ad-ditive genetic and permanent environmental effects were considered as random, and contemporary group and lacta-tion order as fixed effects. The heritability estimates were 0.22 for total milk yield and 0.19 for M305. For test-day yields, the heritability estimates ranged from 0.12 to 0.30, with the highest values being observed up to the third test month, followed by a decline until the end of lactation. The present results show that test-day milk yield, mainly during the first six months of lactation, could be adopted as a selection criterion to increase total milk yield.
Key words:genetic correlations, genetic parameters, heritability, selection efficiency.
Received: July 20, 2007; Accepted: February 25, 2008.
Introduction
Milk production in buffaloes (Bubalus bubalis
Artiodactyla, Bovidae) is an economically important trait, accounting for more than 40% of the milk produced in Asia and sustaining a powerful dairy industry in Italy, with buf-falo milk also being consumed on a smaller scale in many other countries.
Asian countries traditionally tend to express milk pro-duction based on yields at 305 days of lactation (Saneet al., 1972; Mourad and Mohamed, 1995), while in Italy, taking into account buffaloes mean lactation period, milk yield ad-justed to 270 days of lactation is adopted as a selection cri-terion (Rosati and Van Vleck, 2002) as recommended by the International Committee of Animal Recording (ICAR, 2008). In dairy cattle, 305 days cumulative milk yields or yields at partial periods of lactation have been considered for genetic evaluation. For the calculation of these yields,
milk production is generally monitored at average intervals of 30 days and the production of one cow on each test day is called test-day (TD) milk yield. Cumulative yields for dif-ferent lactation periods are calculated using estimated ex-tension or adjustment factors, with accuracy of cumulative yield depending on the quality and quantity of the available test-day records (Tonhatiet al., 2004; ICAR, 2008).
There are various methods to calculate the milk pro-duction in the lactation (ICAR, 2008), but the usual one is the test interval method as described in Everett and Carter (1968). The problem of using estimates of extension factors is that this approach assumes that there is no variability in the shape of the lactation curve between animals, thus elim-inating some genetic variation in milk yield (Shahrbabak MM – PhD Thesis, University of Guelph, Guelph, Canada, 1997). On the other hand, exclusion of short or incomplete lactation records might cause bias due to the pre-selection of data. In addition, the use of total yields or yields accumu-lated in long lactation periods implies not only the impossi-bility of considering environmental effects that may influence milk production during certain periods but also of including in the analysis incomplete data from young ani-mals.
An alternative to overcome the problem of extending production records until the end of lactation using exten-sion factors is to utilize TD yields instead. The main advan-tage of this approach is the possibility of reducing the number of TD, thus reducing the generation interval. In ad-dition, a cow can be included in the evaluation if it has at least one measurement and the larger amount of available data will increase sires evaluation accuracy and minimize possible bias due to excluding incomplete lactations (Schaefferet al., 1977; Ptak and Schaeffer, 1993).
In dairy cattle, heritability estimates for TD yields have been close to or slightly less than those obtained for 305-day yields (Meyer et al., 1989), however, applying random regression models heritability estimates for daily yields have been higher than for 305-d yields (Jamrozik and Schaeffer, 1997). In general, rank correlations between ani-mals’ breeding values for 305-day milk yields and some TD milk yields are relatively high, with a large number of sires in common when sires are ranked based on the two cri-teria (Ptak and Schaeffer, 1993; Swalve, 1995).
In buffaloes, (Tiwana MS and Dhillon JS – Proceed-ings of I World Buffalo Congress, Cairo, Egito, 1985) a heritability estimate of 0.37 for cumulative milk yield up to the fourth month of lactation and a genetic correlation of 0.96 between this trait and 305-day milk yield have been re-ported. The authors concluded that the adoption of partial production as a selection criterion may result in greater an-nual genetic gain, mainly due to reduction in the generation interval.
Based on the above considerations, the objectives of the present study were to estimate genetic parameters for total, 305-day and TD milk yields and to propose a selec-tion criterion for milk producselec-tion in buffaloes.
Materials and Methods
Data
The data analyzed were obtained from the buffalo milk-recording program maintained by the Department of Animal Science, UNESP, Jaboticabal, São Paulo, Brazil, including 10 farms in the State of São Paulo. Most of the data (32%) originated from one farm only, which started a recording system in 1987. There were a minimum of 42 and a maximum of 1,225 lactations per herd. Data included 3,888 lactations (from first to sixth order) from 1,630 Murrah breed cows (Bubalus bubalis) recorded from 1987 through 2001. The number of lactations per year varied from 62 to 721. Animals were reared on pastures mainly of
BrachiariaandPanicum. In general, the practice of bulk feed supplementation based on chopped sugar cane or grass silage and cotton seed-, barley- and soybean-based concen-trate was adopted mainly during the dry season (April to September). Mineral salt was offered regularly and a sys-tem of natural breeding and artificial insemination was adopted. Sanitary control was performed according to the
recommendations of the Brazilian Ministry of Agriculture (http://www.agricultura.gov.br/). Drugs against ecto- and endoparasites were applied twice a year on average. Test-day records were obtained monthly. The cows were milked twice a day and the calves were with the cow during milk-ing.
Total milk yield was defined as the amount of milk (kg) produced throughout the lactation period, while M305 was obtained by truncating the production on day 305 of lactation. These traits were chosen because Madalenaet al.
(1992) found in Zebu cattle that adjusting lactation milk yield for days in milk removed genetic variability of milk yield. Moreover, in previous work, with Buffaloes, Tonhati
et al.(2004) reported less genetic variability for lactation milk yield when adjustment factors for days in milk were used. Average lactation length for this population was 254.42 days with a standard deviation of 66.11 days. Test-day yields refer to the monthly milk measurements per-formed throughout the lactation period (TD1 to TD10).
Model
Test-day milk yield, total milk yield and M305 (co)variance components were estimated by restricted maximum likelihood (REML) using a bivariate animal model according to the algorithm developed by Boldmanet al.(1995). The model can be represented as:
yi=Xibi+Ziai+Wici+ei;
whereyiis the observation vector for the ithtrait (test-day
milk yield, total milk yield or M305), andXi,Zi, andWiare
incidence matrices related to fixed (bi) and random animal
(ai) and permanent environmental (ci) effects, respectively.
It was assumed that:
E y X E
a a c c e e [ ]=[ ]; = 1 2 1 2 1 2 0 0 0 0 0 0 ; Var= = a a c c e e A A
a a a
a 1 2 1 2 1 2 2
1 1 2 0 0 0 0
σ σ
σ
2 1 2
1 1 2
2 1 2
1 2
2
1
2
0 0 0 0
0 0 0
0 0 0
0 0 0
a a
c c c
c c c
e A A I I I I I σ σ σ σ σ
σ σe e
e e e
I
I I
1 2
2 1 2
0 0 0 σ σ2
whereAis the relationship matrix,σai
2
are additive genetic variances,σai,aj are additive genetic covariances,
σ
ci
2
are permanent environmental variances,σci,cj are permanent
environmental covariances,σei
2
are residual variances and
σ
ei,ej are residual covariances between two traitsiandjand
ving year for total milk yield or 305-d milk yield and herd-date of recording for test-day milk yield) and lactation order as fixed effects. Calving season was not included as a fixed effect since previous analyses had shown no effect of this factor on milk yield (Tonhatiet al., 2000a). Six lacta-tion orders and 67 contemporary groups with a minimum of five lactation records were considered for analysis. There were 7,396 animals in the relationship matrix from which 2,062 (27.88%) were inbred with a mean inbreeding coeffi-cient of 4.8%. Results presented for test day milk yields (TD1 to TD10) were obtained from bivariate analysis with total milk yield.
Expected genetic gain and correlated response to se-lection were obtained using the estimates of heritability (h2), genetic correlations and phenotypic standard devia-tions. Selection of the best 5% males was examined, corre-sponding to a selection intensity factor of 2.06 (Lush, 1964). Females were randomly replaced in the herd, with selection intensity equal to zero. Thus, the mean selection intensity factor for all traits was 1.03. Expected direct and correlated responses to selection and the relative efficiency of response were calculated by the usual selection index formulas, considering a progeny test with number of daughters by sire varying from 5 to 100.
Results and Discussion
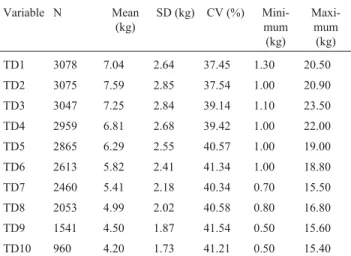
The observed mean for total milk yield (kg) was 1,532.68±660.88 and 1,495.08±617.12 for M305, which is similar to those reported by Tonhatiet al.(2000a). The number of observations and the means, standard deviations and coefficients of variation for TD milk yield are shown in Table 1.
Monthly TD milk yield means varied according to the phase of lactation, with the highest production being re-corded for the second month of lactation, followed by a gradual decrease through to the tenth month. The increase in milk yield was 7.80% from the first to the second month, corresponding to a milk yield of 0.55 kg. The mean percent-age of decline observed after the second test-day was 7.09%. A minimal decline in percentage of production was observed from the second to the third month (4.48%), while the largest decrease (9.82%) occurred between the eighth and ninth month of test. These results support the recom-mendation from ICAR (2008) for using milk yield adjusted for 270 days of lactation.
In absolute terms, the average monthly decline in milk yield was 0.42 kg from the lactation peak. The largest decrease (0.52 kg) was observed from the fourth to the fifth test-day, while the smallest decrease (0.30 kg) occurred be-tween the ninth and tenth test-day. The percentage and ab-solute total losses in milk yield from the second to the tenth test-day were 44.46% and 3.39 kg, respectively. Similarly, Bremner-Gaonaet al. (1985) for Mediteranean and
Mu-nõz-Berrocalet al.(2005) for Murrah buffalo in Brazil re-ported that lactation peaked at the second month of lacta-tion, with milk yield decreasing continuously thereafter. In Brazil, until few years ago, selection for milk yield in buffa-loes was based on the milk production of dams. Tonhatiet al.(2000b) reported milk yield average breeding values for Murrah buffalo sires close to zero from 1977 to 1995, showing that the selection was not effective.
Milk yields on each test-day had high coefficients of variation (Table 1), indicating considerable variability in the shape of the lactation curve. The lower coefficients of variation obtained for test-days at the beginning of lactation might be due to the greater standardization of post-partum treatment and/or to the body status of the cows which gen-erally have good body reserves after calving. On the other hand, the smaller number of observations close to the end of lactation, as well as individual differences between animals in terms of lactation persistency, might have contributed to the higher coefficients of variation for those test-days. Con-sidering the positive genetic correlation between persis-tency of lactation and total milk yield (Gengler, 1996), it could be expected that only the more productive cows would be lactating in the last stage of lactation.
Table 2 shows the estimates of variance components and of genetic and phenotypic parameters obtained by bi-variate analysis including total milk yields and M305. The heritability estimates were within the limits reported in the literature for these traits (Tonhatiet al., 2000a; Rosati and Van Vleck, 2002). A high positive genetic correlation (0.99) was also observed between total milk yield and M305, demonstrating a pleiotropic effect of genes on these traits.
Estimates of permanent environmental correlations were high, suggesting that both traits are affected in part by the same environmental factors. Consequently, the repeat-ability estimates indicate that, as an aid for selection, past coefficient of variation (CV) and minimum and maximum values of test-day milk yield in kg (TD1 to TD10).
Variable N Mean (kg)
SD (kg) CV (%) Mini-mum (kg)
Maxi-mum (kg)
TD1 3078 7.04 2.64 37.45 1.30 20.50
TD2 3075 7.59 2.85 37.54 1.00 20.90
TD3 3047 7.25 2.84 39.14 1.10 23.50
TD4 2959 6.81 2.68 39.42 1.00 22.00
TD5 2865 6.29 2.55 40.57 1.00 19.00
TD6 2613 5.82 2.41 41.34 1.00 18.80
TD7 2460 5.41 2.18 40.34 0.70 15.50
TD8 2053 4.99 2.02 40.58 0.80 16.80
TD9 1541 4.50 1.87 41.54 0.50 15.60
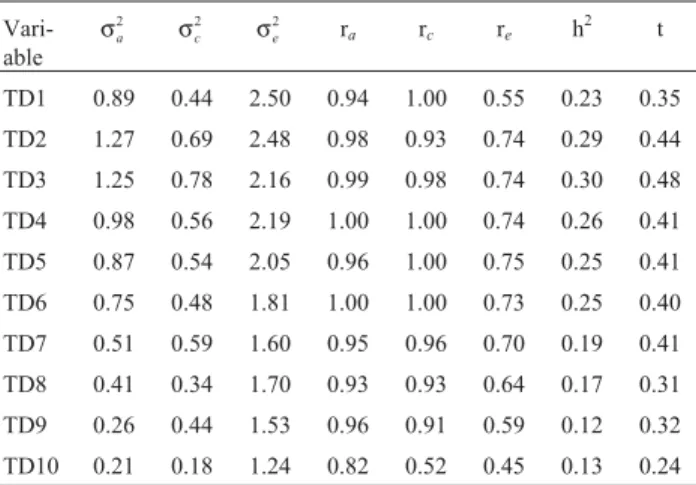
values for both, total milk yield and M305, can be used as indicators of future yields. Estimates of variance compo-nents and of genetic and phenotypic parameters for test-day milk yields obtained from bivariate analyses, with total milk yield, are shown in Table 3.
Phenotypic variance estimates showed the same trend as test-day milk yield, increasing from the first to the second test-day and decreasing thereafter (Figure 1). The highest es-timates of residual and additive genetic variances were ob-served in the first and second months of lactation, respectively, followed by a gradual decrease during the sub-sequent periods of lactation (Table 3). Estimates of perma-nent environmental variance showed an increase from the beginning of lactation to the third test-day (TD3), declining thereafter. This variance behavior led to higher heritability estimates during the initial phase of lactation, with a maxi-mum value of 0.30 at the third test-day (Figure 1). Although all the variance estimates decreased with days in milk, the decrease in the genetic variance was more than in the resid-ual variances and, as a consequence, heritability estimates were lower after the sixth month of lactation. Probably, this pattern is due to the fact that only more persistent cows re-main producing until the tenth month of lactation which would decrease genetic variability. Moreover, higher heritability estimates during the first half of lactation might be due to better control of environmental conditions through standardization of post-partum management. Estimates of heritability for TD yields reported in the literature for dairy cattle show different magnitudes but, in general, the mid-lactation yields are more heritable than those at the be-ginning and at the end of lactation (Meyeret al., 1989; Pan-deret al., 1992 and Swalve, 1995).
The advantage of using TD yields for genetic evalua-tions due to their higher coefficients of heritability (Meyer
et al., 1989; Ptak and Schaeffer, 1993; Swalve, 1995) was confirmed in the present study. In addition, the genetic cor-relations between TD yields and total milk yield were high (Table 3), indicating that a large proportion of the additive genetic variance is common to both TD and total yields.
Table 4 shows estimates of genetic gain (∆G) for total milk yield (TY), correlated responses and relative selection
efficiencies for total milk yield as a function of direct selec-tion for M305 and TD yields. The estimates of correlated response for total milk yield as a function of direct selection for TD yields indicate that the adoption of initial TD yields as a selection criterion,i.e., from second to sixth TD, would be an efficient approach to increase total milk yield, be-cause these TD milk yields have higher heritability esti-mates than TY and the genetic correlations, among the TD
Table 3- Estimates of additive genetic (σa
2
), permanent environmental (σc2) and residual (σ
e
2) variances (kg2), and estimates of heritability (h2),
re-peatability (t), genetic (ra), permanent (rc) and temporary environmental
(re) correlations obtained for test-day milk yield (TD1 to TD10) by
bivariate analysis with total milk yield.
Vari-able
σa2 σ
c
2 σ
e
2
ra rc re h2 t
TD1 0.89 0.44 2.50 0.94 1.00 0.55 0.23 0.35
TD2 1.27 0.69 2.48 0.98 0.93 0.74 0.29 0.44
TD3 1.25 0.78 2.16 0.99 0.98 0.74 0.30 0.48
TD4 0.98 0.56 2.19 1.00 1.00 0.74 0.26 0.41
TD5 0.87 0.54 2.05 0.96 1.00 0.75 0.25 0.41
TD6 0.75 0.48 1.81 1.00 1.00 0.73 0.25 0.40
TD7 0.51 0.59 1.60 0.95 0.96 0.70 0.19 0.41
TD8 0.41 0.34 1.70 0.93 0.93 0.64 0.17 0.31
TD9 0.26 0.44 1.53 0.96 0.91 0.59 0.12 0.32
TD10 0.21 0.18 1.24 0.82 0.52 0.45 0.13 0.24
Table 2- Estimates of additive genetic (σa
2
), permanent environmental (σc2}) and residual (σ
e
2) variances (kg2), and estimates of heritability (h2),
repeatability (t), genetic (ra), permanent (rc) and temporary environmental
(re) correlations for total milk yield (TY) and yields at 305 days of lactation
(M305).
Parameter Total milk yield M305
σ
a
2
56035.86 41057.26
σc2 54081.86 49063.31 σe2
150007.01 121019.82
h2 0.22 0.19
t 0.42 0.43
ra= 0.99 rc= 1.00 re= 0.93
Figure 1- Estimates of phenotypic (x), genetic (l), permanent
and TY, are greater than 0.95. However, this advantage would decrease with an increase in the number of daughters by sire because, in this case, differences in accuracy by us-ing TD or TY as selection criterion are small. For example, for the 5thtest-day milk yield, if the sire has 5 daughters, the accuracy of selection would be 0.50 for TD5 and 0.47 for TY. However, with 100 daughters the accuracy would be 0.93 for TD5 and 0.92 for TY. But, in some cases, to obtain a larger number of daughters per sire it would be necessary to use the sires for a longer period, thus increasing the gen-eration interval and decreasing response to selection. The genetic parameters estimated indicate that milk yields around the lactation peak,i.e., the second and third TD, have the highest heritability and a strong relationship with total milk yield and, therefore, result in the greatest ex-pected correlated responses for TY. Based on these results, an economic selection index considering two or more TD, including other measurements such as persistency of lacta-tion, could be developed. To favor animals with higher per-sistency of lactation, TD after the peak of production proba-bly should be included in the selection index.
The results obtained in the present study indicate that adoption of test-day milk yields as selection criteria might contribute to greater genetic gain in total milk production. In addition, the results indicate that test-day milk yields near the lactation peak (TD2 and TD3) are most closely re-lated to total milk yield.
Acknowledgments
Appreciation is extended to the Fundação de Apoio à Pesquisa do Estado de São Paulo (FAPESP) and Conselho
(CNPq) for financial support.
References
Boldman KG, Kriese LA, Van Vleck LD and Kachman SD (1995) A Manual for Use of MTDFREML. Department of Agricul-ture/Agricultural Research Service, Lincoln, 120 pp. Bremner-Gaona JH, Andrade VJ, Pereira CS and Sampaio IBM
(1985) Estudo da curva de lactação em búfalas da raça Mediterrânea e seus mestiços. Arq Bras Med Vet Zootec 37:477-495 (Abstract in English).
Everett RW and Carter HW (1968) Accuracy of test interval method of calculating dairy herd improvement association records. J Dairy Sci 51:1936-1941.
Gengler N (1996). Persistency of lactation yields: A review. Interbull Bull 12:87-96.
Jamrozik J and Schaeffer LR (1997) Estimates of genetic parame-ters for a test day model with random regressions for yield traits of first lactation Holsteins. J Dairy Sci 80:762-770. Lush JL (1964) Como a seleção muda uma população - Expressão
dos resultados. In: Melhoramento Genético dos Animais Domésticos. USAID, Rio de Janeiro, pp 186-217.
Madalena FE, Lemos AM and Teodoro RL (1992) Consequences of removing the variation in lactation length on the evalua-tion of dairy cattle breeds and crosses. Braz J Genet 15:585-594.
Meyer K, Graser HU and Hammond K (1989) Estimates of ge-netic parameters for first lactation test day production of Australian Black and White cows. Livestock Prod Sci 21:77-199.
Mourad KA and Mohamed MM (1995) Genetic and phenotypic aspects of milk yield traits and reproductive performance of Egyptian buffaloes. Egypt J Anim Prod 32:125-137. Munõz-Berrocal M, Tonhati H, Cerón-Muñoz M, Duarte JMC
and Chabariberi RL (2005) Uso de modelos lineares e não lineares para o estudo da curva de lactação em búfalos Murrah e seus mestiços em sistema de criação semi exten-sivo no Estado de São Paulo. Arch Latinoam Prod Anim 13:19-23 (Abstract in English).
Pander BL, Hill WG and Thompson R (1992) Genetic parameters of test day records of British Holstein-Friesian heifers. Anim Prod 55:11-21.
Ptak E and Schaeffer LR (1993) Use of test day yields for genetic evaluation of dairy sires and cows. Livestock Prod Sci 34:23-34.
Rosati A and Van Vleck LD (2002) Estimation of genetic parame-ters for milk, fat, protein and mozzarella cheese production in the Italian river buffalo population. Livestock Prod Sci 74:185-190.
Sane DD, Khanna RS, Bajpai LD and Bhat PN (1972) Studies on Murrah buffalo (Bubalus bubalis). II: Genetic analysis of milk yield and peak yield. Indian J Anim Prod 3:61-65. Schaeffer LR, Minder CE, McMillan I and Burnside EB (1977)
Non-linear techniques for predicting 305-day lactation pro-duction of Holstein and Jerseys. J Dairy Sci 60:1636-1644. Swalve HH (1995) The effect of test day models on the estimation
of genetic parameters and breeding values for dairy yield traits. J Dairy Sci 78:929-938.
Tonhati H, Muñoz MFC, Duarte JMC, Reichert RH, Oliveira JA and Lima ALF (2004) Estimates of correction factors for and correlated response for total milk yield with direct selection for
test-day milk yield (TD) and relative selection efficiency.
Trait Correlated response (number of daughters
by sire)
Relative selection efficiency (number of daughters
by sire)
5 10 50 100 5 10 50 100
TY* 115.8 147.8 210.3 225.2 100.0 100.0 100.0 100.0
M305 107.8 139.2 203.9 220.3 93.1 94.2 97.0 97.8
TD1 110.8 141.0 198.8 212.4 95.7 95.3 94.5 94.3
TD2 126.6 158.2 213.2 224.9 109.4 107.0 101.3 99.8
TD3 129.6 161.5 216.1 227.7 111.9 109.2 102.7 101.1
TD4 123.8 156.1 214.8 227.9 106.9 105.5 102.1 101.2
TD5 117.0 148.0 205.2 218.2 101.1 100.1 97.5 96.9
TD6 121.9 154.2 213.8 227.3 105.3 104.2 101.6 100.9
TD7 103.5 133.6 195.6 211.4 89.3 90.3 93.0 93.8
TD8 96.6 125.7 188.2 204.8 83.4 85.0 89.5 90.9
TD9 85.7 113.7 182.4 203.4 73.9 76.9 86.7 90.3
TD10 75.9 100.2 158.2 175.5 65.4 67.7 75.2 77.9
lactation length and genetic parameters for milk yield in buf-faloes. Arq Bras Med Vet Zootec 56:251-257 (Abstract in English).
Tonhati H, Muñoz MFC, Oliveira JA, Duarte JMC, Furtado TP and Tseimazides SP (2000a) Parâmetros genéticos para a produção de leite, gordura e proteína em bubalinas. Rev Bras Zootec 29:2051-2056 (Abstract in English).
Tonhati H, Vasconcelos FB and Albuquerque LG (2000b) Ge-netic aspects of productive and reproductive traits in a Mur-rah buffalo herd in São Paulo, Brazil. J Anim Breed Genet 117:331-336.
Internet Resource
ICAR (2008) Guidelines for buffalo milk recording for low to me-dium and meme-dium to high input production systems. http:// www.icar.org/pages/recording_guidelines.htm (February 13, 2008).
Associate Editor: Pedro Franklin Barbosa