Estimation of genetic parameters for test-day milk yield in Holstein cows
using a random regression model
Jaime Araujo Cobuci
1, Ricardo Frederico Euclydes
2, Paulo Sávio Lopes
2, Claudio Napolis Costa
1,
Robledo de Almeida Torres
2and Carmen Silva Pereira
21
Embrapa Gado de Leite, Juiz de Fora, MG, Brazil.
2
Departamento de Zootecnia, Universidade Federal de Viçosa, Viçosa, MG, Brazil.
Abstract
Test-day milk yield records of 11,023 first-parity Holstein cows were used to estimate genetic parameters for milk yield during different lactation periods. (Co)variance components were estimated using two random regression models, RRM1 and RRM2, and the restricted maximum likelihood method, compared by the likelihood ratio test. Additive genetic variances determined by RRM1 and additive genetic and permanent environmental variances estimated by RRM2 were described, using the Wilmink function. Residual variance was constant throughout lactation for the two models. The heritability estimates obtained by RRM1 (0.34 to 0.56) were higher than those obtained by RRM2 (0.15 to 0.31). Due to the high heritability estimates for milk yield throughout lactation and the negative genetic correlation between test-day yields during different lactation periods, the RRM1 model did not fit the data. Overall, genetic correlations between individual test days tended to decrease at the extremes of the lactation trajectory, showing values close to unity for adjacent test days. The inclusion of random regression coefficients to describe permanent environmental effects led to a more precise estimation of genetic and non-genetic effects that influence milk yield.
Key words:random regression models, REML method, genetic parameters, test-day milk yield, Holstein cows.
Received: November 19, 2003; Accepted: August 16, 2004.
Introduction
Nowadays, the genetic evaluation of dairy cattle us-ing models that consider test-day milk yields has been offi-cially adopted by several countries (Jensen, 2001). However, a few years ago, aggregated test-day milk yield data representing total milk yield, normally standardized for a period of 305 days, were used as a standard measure in evaluations of production traits.
Recently, 305-day milk yield (P305) was replaced by
test-day milk yield (Ferreiraet al., 2002), with the latter
ap-proach showing several advantages: a) it permits the re-moval of environmental variation in phenotypic data on milk yield, since test-day milk yield considers the specific environmental effects for each production record, which is not possible when P305 data are used (Visscher and Goddard, 1995); b) it grants a more accurate evaluation of cows, due to the use of a larger number of records per cow,
as compared to the same records fitted to P305 (Rekayaet
al., 1999); c) it is not affected by the accuracy of the
differ-ent prediction methods for P305 (Rekayaet al., 1999),
be-cause it permits the use of part lactation information, with-out the need for adjusted factors and/or lactation prediction; d) it facilitates the genetic evaluation of lactation persis-tency (Jensen, 2001); e) it permits a more accurate estima-tion of the genetic and permanent environmental effects that affect milk yield.
Several models have been proposed for the genetic evaluation of dairy cattle (Strabel and Misztal, 1999).
Ac-cording to Jamroziket al. (1997a) and Van Der Werfet al.
(1998), random regression models (Henderson Jr., 1982; Laird and Ware, 1982) are more flexible, accurate and pre-cise than traditional models (multiple trait models).
In view of their various advantages and the recent progress in the area of computer science, the use of random regression models has been indicated for studies analyzing production traits (Pool and Meuwissen, 1999, 2000; Olori
et al., 1999; Lidauer et al., 2000; Mrode et al., 2000;
Kettunenet al., 2000), as well as traits such as somatic cell
count (Jamroziket al., 1998; Liuet al., 2001),
conforma-tion (Jonestet al., 1999; Uribeet al., 2000; Veerkampet al.,
2001a), feed intake and body weight (Veerkamp and Thompson, 1999), in addition to traits that are important for
www.sbg.org.br
Send correspondence to Jaime Araujo Cobuci. Rua Eugênio do Nascimento 610, Dom Bosco, 36038-330, Juiz de Fora, MG, Brazil. E-mail: [email protected] or [email protected].
(Veerkampet al., 2001b).
Thus, the objectives of the present study were to de-termine the parameters required for the use of random re-gression models in the evaluation of test-day milk yield in first-lactation Holstein cows, using the restricted maximum likelihood (REML) method, to estimate genetic parameters for test-day milk yield, and to determine the influence of the inclusion of random regression coefficients in the regres-sion models on the description of permanent environmental effects, using a mathematical function with three coeffi-cients.
Material and Methods
Field data
Data comprised test-day records of first-lactation Holstein cows calving from 1997 through 2001. The re-cords were obtained from the Milk Recording Organization of the Minas Gerais Association of Breeders of Holstein Cattle and comprise the National Zootechnical Archive of Dairy Cattle managed by the Embrapa Dairy Cattle Re-search Center.
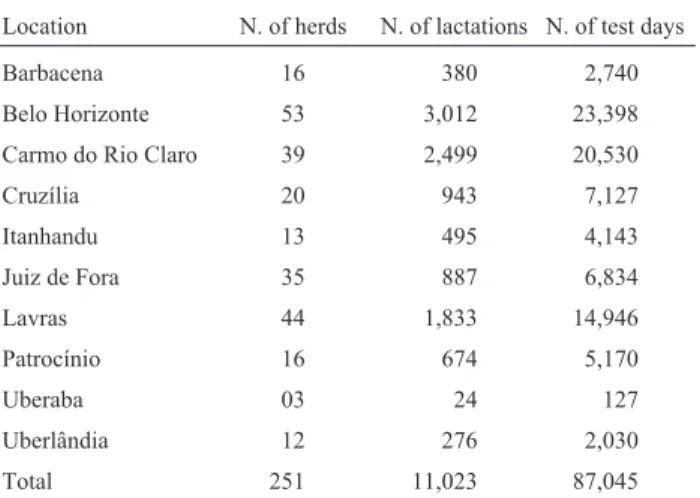
To obtain data sets of a consistent size, the following records were eliminated: data from daughters of sires that did not have at least four daughters per class of herd-year-month test day, cows younger than 18 and older than 48 months at calving, a lactation period shorter than 120 days, daily milk yield records lower than 2.60 or higher than 79.80 kg, and animals that were not pure of origin and equal to or higher than 31/32 Holstein breed. After applying these criteria, a total of 87,045 records from 11,023 lacta-tions of cows, daughters of 936 sires belonging to 251 herds distributed within 10 locations in the State of Minas Gerais, were left to be analyzed.
The analysis considered test-day milk yields obtained between the 6th and 305th days of lactation after calving, with an average of eight test-day records per cow. The indi-vidual test-day milk yields were grouped into four
sub-classes of cow’s age at calving,i.e., 20 to 24, 25 to 29, 30 to
34, and 35 to 48 months, respectively, and calving seasons,
i.e., January to March, April to June, July to September, and
October to December. These groups were combined into 16 classes of age-calving season and included in the random regression models as fixed effects. The contemporary groups were characterized by the combination of herd and year and month of test-day milk yield.
The summary of the data used in this study and the distribution of test days within the classes formed by cow’s age and calving season are shown in Tables 1 and 2, respec-tively.
Models
The following models were used in the evaluation of the inclusion of random regression coefficients in the
de-scription of permanent environmental effects on milk production records by random regression models:
yijkl HYMi kmZjlm a Z ep e m
jm jlm m
j ijkl
= + + + +
= =
∑
β∑
1 3
1 3
(1)
and
y HYM Z a Z
p Z
ijkl i km jlm m
jm jlm m
jm jlm m
= + + +
+
= =
=
∑
∑
∑
β
1 3
1 3
1 3
eijkl
, (2)
whereyijkl= test-day recordlof cowjobtained for days in
milk (tj) in subclass i (herd-year-month test day) and k
Location N. of herds N. of lactations N. of test days
Barbacena 16 380 2,740
Belo Horizonte 53 3,012 23,398
Carmo do Rio Claro 39 2,499 20,530
Cruzília 20 943 7,127
Itanhandu 13 495 4,143
Juiz de Fora 35 887 6,834
Lavras 44 1,833 14,946
Patrocínio 16 674 5,170
Uberaba 03 24 127
Uberlândia 12 276 2,030
Total 251 11,023 87,045
Table 2- Number of test days per class of cow’s age and calving season after data edition.
Age at calving (months) Calving season N. of test days
20-24 1 4,241
2 5,829
3 4,687
4 2,161
25-29 1 10,301
2 12,426
3 13,238
4 7,137
30-34 1 5,920
2 5,120
3 3,413
4 3,300
35-48 1 2,003
2 3,293
3 2,418
(age-calving season); HYMi = fixed effect of
herd-year-month test day;eijkl = residual random effect associated
withyijkl;βkm = fixed regression coefficients of test-day
milk yield as a function oft, which describes the shape of
the lactation curve within the cow’s age-calving season
subclass;ajmandpjm= random regression coefficients that
describe the genetic and permanent environmental effects
in each animal, respectively;epj= permanent
environmen-tal random effect; Zjlm = (co)variable represented by the
Wilmink function, whereZj1m= (Zj11Zj12Zj13)’ = (1t d)’,
andd= exp-0,05t;tandm= days in milk after calving and the
mthparameter of the function, respectively.
The mathematical function that permits the descrip-tion of the shape of the lactadescrip-tion curve of the animals, de-scribed by Wilmink (1987), was represented by
y = a1+ a2t + a3exp(-0,05 t), (3)
wherea1,a2anda3= parameters of the function, witha1
be-ing associated with the initial milk yield,a2with the decline
in milk yield after peak lactation, anda3with the increase in
milk yield after peak lactation.
In model 1 (RRM1), the permanent environmental and residual variances were considered to be constant throughout the lactation period, while in model 2 (RRM2), only the residual variance was considered to be constant. Residual variance was considered to be homogenous throughout lactation, due to limitations of the program used for the random regression analyses.
Estimation of variances and covariances
Estimation of the (co)variance components by the random regression models predicted a matrix containing variances and covariances of random regression coeffi-cients. Thus, the variances in milk yield during different lactation periods are obtained by the (co)variance matrix and by the vector that contains (co)variables which individ-ually describe the shape of the lactation curve of the ani-mals.
The estimates of genetic variance (g^tt), determined
by RRM1 and RRM2, and of permanent environmental
variance (ptt
^
), determined by RRM2, in milk yield during
any days in milktwere obtained by:
$ ’$
gtt = z Gzt t (4)
and
$ ’$
ptt = z Pzt t, (5)
whereG^ andP^ = matrices of genetic and permanent
envi-ronmental variances and covariances between random
re-gression coefficients, respectively; zt = (co)variables
related to a specific test daylmeasured during days in milk
t.
The estimates of genetic and permanent environmen-tal (co)variances between two test days during days in milk
t,gt t
^
' and pt t
^
', fort’≠t, were obtained by:
$’ ’’$
gt t =z Gzt t (6)
and
$’ ’$ ’
pt t =z Pzt t, (7)
whereG^,P^ andztare as described above, andz’ttranspose
ofzt, fort’≠t. The (co)variance components of the models
were estimated by the REML method, using the REMLF90 program (Misztal, 2001) on a LINUX operational system.
A value lower than 10-9of the square of the relative
differ-ences between consecutive estimates was defined as the convergence criterion.
Estimation of genetic parameters
The estimates of heritability for milk yield during
days in milkt, using RRM1 and RRM2, respectively, were
obtained by: $ $ ($ $ $ ) ( ) h g g t RRM tt
tt ep e
1 2
2 2
=
+σ +σ (8)
and $ $ ($ $ $ ) ( ) h g g p t RRM tt
tt tt e
2 2
2
=
+ + σ (9)
The estimates of genetic (determined by RRM1 and RRM2) and permanent environmental correlations
(deter-mined by RRM2) between test-dayt’andtmilk yields were
calculated by:
rg g
g g
t t
t t
t t tt
$ $ $ $ ’ ’ ’ ’ = × (10) and rp p p p t t t t
t t tt
$ $ $ $ ’ ’ ’ ’ = × (11)
wheret’andt= days in milk,σ$ep
2
= estimate of permanent
environmental variance,σ$e
2
= estimate of residual variance,
andgtt
^ ,gt t
^ ', ptt
^
and pt t
^
' are as described previously.
Comparison of the models
Differences between models 1 and 2 were evaluated by the likelihood ratio test (LRT). Thus, to compare model
i, which contains additional random regression coefficients
describing the permanent environmental effect, with model
j, in which these regression coefficients were not
consid-ered, the following likelihood ratio test (Rao, 1973) was used:
stricted likelihood function of modelsiandj, withi= (1)
andj= (2), respectively.
The null hypothesis (H0) to be tested implied that the equality of the restricted likelihood functions of the models
did not differ between one another, i.e., H0: -2loge
Li= -2logeLj. Thus, to reject the null hypothesis, the
calcu-lated value of LRTijwas compared to the chi-square (χ2tab)
table value with three degrees of freedom, with the level of significance set at 1%.
Results and Discussion
Mean milk yield and standard deviation, as well as the number of test-day records and the percentage of cows with the respective number of test-day records per lactation pe-riod are shown in Table 3. Small variations were observed in the standard deviation of milk yield of 10 test-day re-cords obtained during the lactation period. In addition,
76.12% of the lactations were incomplete,i.e., there were
less than 10 test-day records per lactation.
The (-2loge) values of the likelihood function were
301,665.2392 and 301,248.1940 for RRM1 and RRM2, re-spectively. Application of the likelihood ratio test showed that inclusion of the Wilmink function in the description of the permanent environmental effects significantly in-creased the fit of the models, considering that the difference
between the (-2 loge) values was greater than the table
value. Therefore, based on this test, the RRM2 model would be more adequate for the genetic evaluation of test-day milk yield in Holstein cows from the State of Minas Gerais.
According to Jensen (2001), different models can be proposed to evaluate test-day milk yield traits by random regression models. However, no consensus exists regarding the best model to fit milk yield data. In principle, the model
should be selected for the genetic evaluation of animals.
(Co)variance and correlation between random regression coefficients
In total, 8 and 13 (co)variance components were si-multaneously estimated by RRM1 and RRM2, respectively (Table 4).
The inclusion of the random regression coefficients in model RRM2 to describe permanent environmental effects promoted a decrease in the magnitude of the (co)variances and genetic correlations between random regression
coeffi-cients (Tables 4 and 5, respectively). However, Rekayaet
al. (1999) reported that the inclusion of permanent
environ-mental random regression coefficients did not affect in a significant manner the genetic correlation between the co-efficients of the model.
The estimates of genetic correlations between ran-dom regression coefficients for genetic and permanent en-vironmental effects determined by RRM1 and RRM2 are shown in Table 5. An expressive difference in the genetic correlation estimates was observed between the two mod-els, which might be due to the assumption in RRM1 that the permanent environmental effect was constant throughout the lactation period.
As shown in Table 5, negative associations could be
observed between the initial milk yield (a1), the rate in milk
yield decrease after peak lactation (a2), and the rate in milk
Table 3- Means and standard deviations of milk yield, number of test-day records and percentage of cows with the respective number of test-day re-cords per lactation (given in parentheses).
Test day Mean Standard deviation
N. of records
Percentage of cows (test day/lactation)
1 22.62 5.98 10,356 0.28 (1)
2 24.83 6.31 10,567 0.55 (2)
3 24.90 6.53 10,685 5.60 (3)
4 24.48 6.63 10,188 5.25 (4)
5 23.89 6.87 9,716 4.94 (5)
6 23.00 6.91 9,310 5.09 (6)
7 21.96 6.88 8,879 8.19 (7)
8 20.99 6.87 8,082 17.71 (8)
9 19.79 6.75 6,209 28.51 (9)
10 18.72 6.93 3,053 23.88 (10)
Mean 23.02 6.84 -
-Table 4- Estimates of genetic and permanent environmental (co)vari-ances of the random regression coefficients and permanent environmental and residual variances obtained by the RRM1 and RRM2 models.
Component (Co)variance component
RRM1 RRM2
Additive genetic a1a1 23.35 6.61
Regression coefficient a1a2 -0.94 x 10⁻¹ -0.11 x 10⁻¹
a1a3 -30.08 -6.70
a2a2 0.60 x 10⁻³ 0.12 x 10⁻³ a2a3 0.76 x 10
-1
0.96 x 10⁻²
a3a3 77.87 15.59
Permanent environmental p1p1 - 22.76
Regression coefficient p1p2 - -0.66 x 10⁻¹
p1p3 - -19.79
p2p2 - 0.38 x 10
-3
p2p3 - 0.57 x 10⁻¹
p3p3 - 54.26
Permanent environmental variance
Ep 9.326
-Residual variance E 7.229 7.166
a1,a2anda3- genetic regression coefficients,p1,p2andp3- permanent
en-vironmental regression coefficients, corresponding to (co)variablesZ1= 1, Z2=tandZ3= exp (-0,05t) of the Wilmink function; ep - permanent
yield increase until peak lactation (a3), whereas positive
as-sociations were found between the rate in milk yield de-crease after peak lactation and milk yield inde-crease until peak lactation. This indicates that cows with smaller pro-duction rates until peak lactation tend to present lactation curves with larger persistency of lactation (a smaller de-cline rate).
Random regression models also permit inferences re-garding the genetic aspects of the lactation curve. However, selection based on components related to different phases of the lactation curve is complex, because the association between these components and the phases of the lactation
curve is not well understood (Rekayaet al.., 1999).
Alter-natively, random regression coefficient functions provide the genetic merit of animals during the various lactation
pe-riods (Jamroziket al., 1997b).
The estimates of genetic correlations between regres-sion coefficients obtained by the RRM1 model were close
to the values (-0.79, -0.65 and 0.43) reported by Jamroziket
al. (1997a).
Variance components for milk yield
The estimates of genetic and environmental variances (sum of the variances of permanent environmental and re-sidual effects), referring to test-day yields obtained during the period from day 6 to day 305 after the beginning of lac-tation, were calculated from the values shown in Table 6. The genetic variances estimated by the RRM1 model were greater than those estimated by the RRM2 model and were
similar to those reported by Rekayaet al. (1999).
The behavior of the genetic and environmental vari-ance estimates throughout lactation, obtained by the RRM1 and RRM2 models, is shown in Figures 1 and 2, respec-tively. In general, the values obtained by the RRM1 model were overestimated. Genetic variance tended to be greater at the beginning and at the end of the lactation period (Fig-ure 1). However, a marked decrease in the course of the
ge-netic variance curve was observed for the first 30 days of lactation, suggesting that the models were less robust to de-scribe the genetic variance in milk yield during this period. A marked decrease in the course of the genetic variance Table 5- Estimates of genetic and permanent environmental correlations
between the random regression coefficients obtained by the RRM1 and RRM2 models.
Component Correlation
RRM1 RRM2
Additive genetic a1a2 -0.80 -0.40
Regression coefficient a1a3 -0.70 -0.66
a2a3 0.35 0.22
Permanent environmental p1p2 - -0.72
Regression coefficient p1p3 - -0.56
p2p3 - 0.40
a1,a2anda3- additive genetic regression coefficients,p1,p2andp3-
per-manent environmental regression coefficients, corresponding to (co)vari-ablesZ1= 1,Z2=tandZ3= exp (-0,05t) of the Wilmink function.
Table 6- Estimates of genetic and environmental variances for selected DIM of daily yields obtained by the RRM1 and RRM2 models.
DIM Va(RRM1) Va(RRM2) Ve(RRM1) Ve(RRM2)
6 21.08 5.18 16.555 30.106
30 9.70 3.95 16.555 20.916
60 11.81 5.11 16.555 21.806
90 10.70 5.41 16.555 20.686
120 9.20 5.59 16.555 19.326
150 8.46 5.90 16.555 18.446
180 8.75 6.41 16.555 18.186
210 10.10 7.13 16.555 18.606
240 12.53 8.07 16.555 19.696
270 16.04 9.23 16.555 21.466
305 21.51 10.85 16.555 24.386
Va(RRM1), Va(RRM2), Ve(RRM1)and Ve(RRM2)- additive genetic and
environ-mental variances obtained by RRM1 and RRM2, respectively.
Figure 1- Additive genetic variances during the different lactation peri-ods estimated by the RRM1 and RRM2 random regression models.
Jamroziket al. (1997b), Rekayaet al. (1999) and Kettunen
et al. (2000). The shape of the genetic variance curve throughout lactation obtained by the RRM1 and RRM2
models was similar to that observed by Jamrozik et al.
(1997b), Oloriet al. (1999) and Rekayaet al. (1999).
The variations in the environmental variance esti-mates (sum of permanent environmental effects and resid-ual variances) throughout lactation obtained by the RRM2 model (Figure 2) were not observed when the RRM1 model was applied, since in this model the permanent environ-mental and residual variances were considered to be homo-geneous throughout the lactation period.
The results obtained with the RRM2 model show that environmental factors were more expressive at the begin-ning and at the end of lactation (Figure 2), in agreement with the observations of Ludwick and Petersen (1943) that non-genetic factors tend to influence the milk yield in a more expressive manner during the first weeks of lactation.
Comparison of the behavior of genetic and environ-mental variances estimated by the RRM1 and RRM2 mod-els (Figures 1 and 2, respectively) showed that the absence of permanent environmental random regression coeffi-cients in the RRM1 model did not permit the differentiation between variance estimates for genetic and environmental
effects,i.e., part of the genetic variability obtained with the
RRM1 model was overestimated due to environmental fac-tors.
Genetic parameters
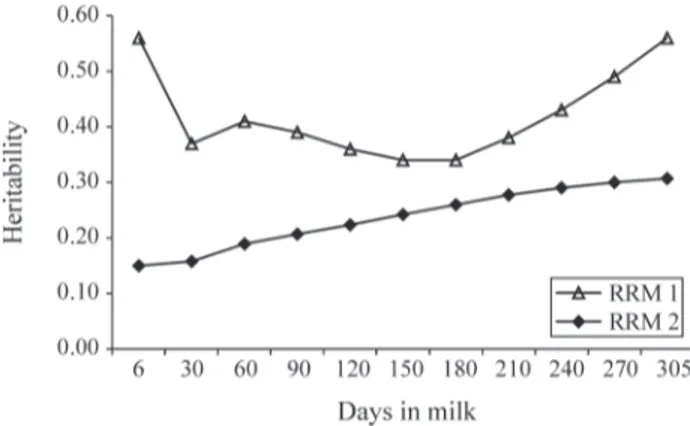
The heritability estimates for test-day milk yield ob-tained for selected periods of lactation by the RRM1 and RRM2 models are shown in Table 7. Graphic representa-tions of these estimates throughout lactation are illustrated in Figure 3.
The heritability estimates obtained with the RRM1 model ranged from 0.56 (first and last test day) to 0.34 (sixth and seventh test day), corresponding to 150 and 180 days of lactation (Table 7). A marked decrease in the heritability estimates was observed between day 6 and day 30 after the beginning of lactation, followed by an increase up to day 60, and remaining unchanged up to day 240, when an increase was again observed. Variations in heritability estimates throughout lactation have also been reported by
Jamrozik and Schaeffer (1997) and Rekayaet al. (1999) for
Holstein breeds and by Kettunenet al. (2000) for the
Ayr-shire breed, with the authors considering permanent envi-ronmental variances to be constant during lactation.
High heritability estimates for milk yield during dif-ferent lactation periods were also observed by Jamrozik
and Schaeffer (1997), Kettunenet al. (1997, 1998, 2000)
and Costaet al. (2002). According to Costaet al. (2002),
the overestimation of heritability has been one of the main problems to fit test-day milk yields by random regression models.
Heritabilities were always higher when estimated by the RRM1 model (Table 7), probably due to incorrect parti-tion of the genetic and environmental components, based on the assumption of variance homogeneity for the perma-nent environmental effect. Similar results were obtained by
Rekayaet al. (1999) in Holstein herds.
The heritability estimates obtained with the RRM2 model ranged from 0.15 to 0.31 (Table 7), with a gradual increase throughout lactation (Figure 3). This finding is in
contrast to those of Rekayaet al. (1999) for Holstein cattle,
and of Costaet al. (2002) for the Gir breed, considering
re-sidual variance heterogeneity between milk yield records throughout lactation. On the other hand, the present
find-ings are similar to those reported by Oloriet al. (1999) for
Holstein cows, using Legendre polynomials to model per-manent environmental effects.
Ferreira (1999), using data from the Milk Recording Organization of the Minas Gerais Association of Breeders of Holstein Cattle collected between 1989 and 1998 in a Table 7- Estimates of heritability for selected DIM of daily yields
ob-tained by the RRM1 and RRM2 models.
DIM h2
(RRM1) h2(RRM2)
6 0.56 0.15
30 0.37 0.16
60 0.41 0.19
90 0.39 0.21
120 0.36 0.22
150 0.34 0.24
180 0.34 0.26
210 0.38 0.28
240 0.43 0.29
270 0.49 0.30
305 0.56 0.31
h2
(RRM1)and h2(RRM2)- heritability estimates obtained by the random
regres-sion models RRM1 and RRM2, respectively.
multiple-trait analysis, obtained heritability estimates for monthly test-day milk yields ranging from 0.11 to 0.21. A gradual increase in heritability estimates was observed up to the eighth test day (240 days of lactation), followed by a decrease on the two subsequent test days.
Genetic correlation estimates between test-day milk yields during the selected lactation periods obtained by the RRM1 and RRM2 models are shown in Table 8. In general, genetic correlations between individual test days tended to decrease at the extremes of the lactation trajectory, showing values close to unity for adjacent test days. These results
agree with those reported by Rekayaet al. (1999) and Olori
et al. (1999) for Holstein cows, and by Kettunen et al.
(2000) and Costaet al. (2002) for Ayrshire and Gir breeds,
respectively.
Negative genetic correlation estimates between test-day milk yields measured during the selected lactation peri-ods were obtained by the RRM1 model (Table 8), a fact
also observed by Rekayaet al. (1999), Liuet al. (2000),
Kettunenet al. (2000) and Costaet al. (2002).
Permanent environmental correlation estimates be-tween milk yields during selected lactation periods ob-tained by the RRM2 model are shown in Table 9. For example, permanent environmental correlations were greater between adjacent test days and tended to decrease between test-day pairs at the extremes of the lactation tra-jectory.
Milk yields at the beginning (DIM30) and at the end of lactation (DIM270) and midlactation yields (DIM150) were chosen to represent the character of the genetic corre-lations for milk yield between different lactation periods, estimated by the RRM1 and RRM2 models (Figures 4 and 5). The lowest genetic correlation estimates were obtained at the beginning and at the end of lactation.
Conclusions
In view of the capacity of random regression models to provide mechanisms for the estimation of individual lac-tation curves, it seems feasible to predict the genetic merit of animals, using random regression coefficients.
Figure 4- Genetic correlations between daily milk yield at 30, 150 and 270 days and the other lactation periods obtained by the RRM1 model.
Table 8- Genetic correlation estimates between selected DIM of daily yields obtained by the RRM1 (above the diagonal) and RRM2 (below the diagonal) models.
DIM 6 30 60 90 120 150 180 210 240 270 305
6 0.40 -0.01 -0.15 -0.26 -0.35 -0.42 -0.46 -0.48 -0.48 -0.47 30 0.56 0.91 0.82 0.70 0.54 0.33 0.13 -0.04 -0.18 -0.30 60 0.31 0.95 0.98 0.92 0.79 0.62 0.42 0.25 0.10 -0.03 90 0.25 0.91 0.99 0.97 0.88 0.76 0.59 0.43 0.29 0.16 120 0.21 0.87 0.96 0.99 0.97 0.88 0.75 0.61 0.48 0.36 150 0.19 0.81 0.92 0.96 0.99 0.97 0.89 0.78 0.68 0.58 180 0.16 0.75 0.86 0.92 0.96 0.99 0.97 0.91 0.84 0.76 210 0.14 0.68 0.80 0.87 0.93 0.97 0.99 0.98 0.94 0.89 240 0.11 0.61 0.73 0.82 0.89 0.94 0.97 0.99 0.98 0.96 270 0.09 0.54 0.67 0.76 0.84 0.91 0.95 0.98 0.99 0.99 305 0.06 0.47 0.60 0.70 0.79 0.87 0.92 0.96 0.98 0.99
Table 9- Permanent environmental correlation estimates between se-lected DIM of daily yields obtained by the RRM2 model.
DIM 30 60 90 120 150 180 210 240 270 305
6 0.65 0.40 0.34 0.31 0.28 0.24 0.19 0.14 0.10 0.05 30 0.95 0.91 0.87 0.80 0.71 0.60 0.47 0.35 0.22
60 0.99 0.96 0.90 0.82 0.71 0.58 0.46 0.33
90 0.99 0.95 0.88 0.79 0.68 0.57 0.44
120 0.98 0.94 0.87 0.78 0.68 0.57
150 0.98 0.94 0.87 0.79 0.69
180 0.98 0.94 0.89 0.81
210 0.98 0.95 0.90
240 0.99 0.96
270 0.99
305
gression coefficients in random regression models to de-scribe permanent environmental effects, in order to define more precisely the genetic and non-genetic effects that in-fluence milk yield.
Acknowledgments
The authors thank Prof. Ignacy Misztal, University of Georgia, USA, for allowing the use of the REMLF90 pro-gram.
References
Costa CN, Melo CMR, Machado CHC, Freitas AF, Martinez ML and Packer IU (2002) Avaliação de funções polinomiais para ajuste da produção de leite no dia do controle de primeiras lactações de vacas Gir com modelo de regressão aleatória. XXXIX Reunião Anual da Sociedade Brasileira de Zootecnia, Recife, Brasil (CD-ROM).
Ferreira WJ (1999) Parâmetros genéticos para produção de leite no dia do controle de vacas da raça Holandesa. Master The-sis, Universidade Federal de Viçosa, Viçosa, Minas Gerais. Ferreira WJ, Teixeira NM, Torres RA and Silva MVGB (2002) Utilização da produção de leite no dia do controle na ava-liação genética em gado de leite - Uma revisão. Archivos Latinoamericanos de Producción Animal 10:46-53. Henderson Jr CR (1982) Analysis of covariance in the mixed
model: Higher-level, nonhomogenous, and random regres-sions. Biometrics 38:623-640.
Jamrozik J and Schaeffer LR (1997) Estimates of genetic parame-ters for a test day model with random regression for yield traits of first lactation Holstein. Journal of Dairy Science 80:762-770.
Jamrozik J, Kistemaker GJ, Dekkers JCM and Schaeffer LR (1997a) Comparison of possible covariates for use in a ran-dom regression model for analyses of test day yields. Journal of Dairy Science 80:2550-2556.
Jamrozik J, Schaeffer LR and Dekkers JCM (1997b) Genetic evaluation of dairy cattle using test day yields and random regression model. Journal of Dairy Science 80:1217-1226. Jamrozik J, Schaeffer LR and Grignola F (1998) Genetic
parame-ters for production traits and somatic cell score of Canadian Holsteins with multiple trait random regression models. Pro-ceedings 6th World Congress Genetic Applied Livestock Production. Armidale, New South Wales, Australia 23:303-306.
Jensen J (2001) Genetic evaluation of dairy cattle using test-day models. Journal of Dairy Science 84:2803-2812.
Jonest HE, White IMS and Brotherstone S (1999) Genetic evalua-tion of Holstein Friesian sires for daughter condievalua-tion-score changes using a random regression model. Animal Science 68:467-475.
Kettunen A, Mäntysaari EA, Stradén I and Pösö J (1997) Genetic parameters for test day milk yields of Finnish Ayrshires with random regression model. Journal of Dairy Science 80:197. Kettunen A, Mäntysaari EA, Strandén I, Pösö J and Lidauer M
(1998) Estimation of genetic parameters for first lactation test day milk production using random regression models. Proceedings 6th World Congress Genetic Applied Livestock
23:307-310.
Kettunen A, Mäntysaari EA and Pösö J (2000) Estimation of ge-netic parameters daily milk yield of primiparous Ayrshire cows by random regression test-day models. Livestock Pro-duction Science 66:251-261.
Laird NM and Ware JH (1982) Random effect models for longitu-dinal data. Biometrics 38:963-974.
Lidauer M, Mäntysaari EA, Stradén I and Pösö J (2000) Multiple trait random regression test-day model all lactations. Proc. Int. Workshop on Genetic Improvement of Functional Traits in Cattle. Interbull Bulletin 25:81-86.
Liu Z, Reinhardt F and Reents R (2000) Estimating parameters of a random regression test day model for first three lactation milk production traits using the covariance function ap-proach. Proc. Int. Workshop on Genetic Improvement of Functional Traits in Cattle. Interbull Bulletin 25:74-80. Liu Z, Reinhardt F and Reents R (2001) Parameter estimates of a
random regression test day model for first three lactation so-matic cell scores. Proc. Int. Workshop on Genetic Improve-ment of Functional Traits in Cattle. Interbull Bulletin 26:61-65.
Ludwick TM and Petersen WE (1943) A measure of persistency of lactation of dairy cattle. J Dairy Sci 26:439-445. Misztal I (2001) REML90 manual: Available at: ftp://nce.ads.uga.
edu/pub/ignacy/blupf90/. Accessed March 22, 2001. Mrode RA, Swanson GJT and Lindberg CM (2000) Efficiency of
test day models in genetic evaluation with part lactation in-formation. Proc. Int. Workshop on Genetic Improvement of Functional Traits in Cattle. Interbull Bulletin 25:87-91. Olori VE, Hill WG, McGuirk BJ and Brotherstone S (1999)
Esti-mating variance components for test day milk records by re-stricted maximum likelihood with a random regression animal model. Livestock Production Science 61:53-63. Pool MH and Meuwissen THE (1999) Prediction of daily milk
yields from a limited number of test days using test day model. Journal of Dairy Science 82:1555-1564.
Pool MH and Meuwissen THE (2000) Reduction of the number of parameters needed for a polynomial random regression test day model. Livestock Production Science 64:133-145. Rao CR (1973) Linear Statistical Inference and its Applications.
John Wiley & Sons, New York, 552 pp.
Rekaya R, Carbaño MJ and Toro MA (1999) Use of test day yield for the genetic evaluation of production traits in Holstein-Friesian cattle. Livestock Production Science 57:203-217. Strabel T and Misztal I (1999) Genetic parameters for first and
second lactation milk yields of Polish black and white cattle with random regression test-day models. Journal of Dairy Science 82:2805-2810.
Uribe H, Schaeffer LR, Jamrozik J and Lawlor TJ (2000) Genetic evaluation of dairy cattle for conformation traits using ran-dom regression models. Journal Animal Breeding and Ge-netic 117:247-259.
Van Der Werf JHJ, Goddard ME and Meyer K (1998) The use of covariance functions and random regression for genetic evaluation of milk production based on test day records. Journal of Dairy Science 81:3300-3308.
Veerkamp RF, Koenen EPC and De Jong G (2001a) Genetic cor-relations among body condition score, yield, and fertility in first-parity cows estimated by random regression models. Journal of Dairy Science 84:2327-2334.
Veerkamp RF, Brotherstone S, Engel B and Meuwissen THE (2001b) Analysis of censored survival data using random re-gression models. Animal Science 72:1-10.
Visscher PM and Goddard ME (1995) Genetic parameters for milk yield, survival, workability and type traits for Austra-lian dairy cattle. Journal of Dairy Science 78:205-220. Wilmink JBM (1987) Adjustment of test-day milk, fat and protein
yields for age, season and stage of lactation. Livestock Pro-duction Science 16:335-348.