HINAYAH ROJAS DE OLIVEIRA
COMBINING DIFFERENT FUNCTIONS TO DESCRIBE MILK, FAT AND PROTEIN YIELD IN GOATS USING BAYESIAN MULTIPLE-TRAIT RANDOM
REGRESSION MODELS
VIÇOSA
MINAS GERAIS – BRAZIL 2015
Ficha catalográfica preparada pela Biblioteca Central da Universidade Federal de Viçosa - Câmpus Viçosa
T
Oliveira, Hinayah Rojas de, 1989-O48c
2015
Combining different functions to describe milk, fat and protein yield in goats using bayesian multiple-trait random regression models / Hinayah Rojas de Oliveira. – Viçosa, MG, 2015.
ix, 52f. : il. ; 29 cm.
Inclui apêndices.
Orientador: Fabyano Fonseca e Silva.
Dissertação (mestrado) - Universidade Federal de Viçosa. Inclui bibliografia.
1. Caprino - Melhoramento genético. 2. Leite. 3. Gordura do leite. 4. Proteínas. 5. Polimônios - Modelos estatísticos. 6. Análise de regressão. I. Universidade Federal de Viçosa. Departamento de Zootecnia. Programa de Pós-graduação em Genética e Melhoramento. II. Título.
ii
iii ACKNOWLEDGEMENTS
I would like to thank the Universidade Federal de Viçosa and the Genetics and Breeding
Program for providing me the opportunity to carry out and conclude my Master, contributing to
my academic and professional growth. I am also grateful to the Conselho Nacional de
Desenvolvimento Científico e Tecnológico (CNPq) for the financial support during my graduate
study.
I am grateful to my advisor and friend Fabyano Fonseca e Silva, who knew how to supervise
me and teach me in the “right measure”, sparing no effort to help me in this work. It is gratifying
for me to work with someone who has so much knowledge and is so committed to science as you.
I would like to thank my co-adviser Robledo de Almeida Torres, who I had the pleasure to
work with since my undergraduation, for his friendship, advises and teachings. It is pleasant to
learn with a professional with so much high moral values and patience as you.
I thank my committee members, Paulo Sávio Lopes and Henrique Torres Ventura, for their
attention to this work, for spending their time on reading it and for their valuable suggestions.
I would also like to thank Marcelo Teixeira Rodrigues for making the goat sector data set
available and for his teaching and confidence, and to thank Ricardo Frederico Euclydes (Bajá), my
first advisor in this “academic world”, for all teachings and, especially, for showing me that the
simple moments of the life are the most important ones.
I am grateful to all the other professors and teachers who I had throughout life, who helped
me to dream higher and to get here.
I am very thankful to my family, for understanding often my reasons for physical absence,
for unconditional love and support that were crucial to strengthen my persistence in difficult times. Thus, I would like to thank my mother Sandra Rojas de Oliveira and my father Djmir Marques de
Oliveira (in memoriam), the great masters of my life, examples of love and overcoming, and to
thank my brother Murilo Rojas de Oliveira, my best friend in all my life. I also would like to thank
my grandmother Wanda Cardoso Rojas, my godmother Tânia Aparecida Rojas, my cousins
Mariana Rojas Martin and Maurício Rojas Martin, and my godson Bento Rojas Martin Couto, who
make my life happier.
I would like to thank my boyfriend Otávio Henrique, for his companionship,
encouragement and confusions, which make my days much better.
I would like to thank my friends from afar, for making themselves so present in my
iv I thank the gold team of the GRUMECA (Nadson Oliveira de Souza, Vinícius Junqueira
Felipe Gomes da Silva, Luiz Fernando Brito, Laís Costa Brito, Ana Lúcia Puerro, William Heleno
Mariano, Geraldo Iria de Souza, Delvan Alves, Alessandra Alves, Giovani Caetano, Hugo Teixeira,
Sirlene Lázaro, Naila Carvalho, Bárbara Nogueira and all the other people who have been through
here), for contributing to my learning and making our Saturdays a special day. Without you, this
work would not be possible!
I also thank my friends of the Genetic and Breeding Program, Animal Science Program,
Labtec and GMAves, for all conversations, learning and laughter.
And last but not least important, I would like to thank the team of the Goat Sector, of the
Department of Animal Science and of the Graduate in Genetic and Breeding Office from the
Universidade Federal de Viçosa, who have always been so helpful.
“
If I got here was because each one of you helped me at the right time and in a
unique way. So I leave here, once again, my THANK YOU SO MUCH!
”
v
“All progress is precarious, and the solution of one problem brings us face to face with another problem.”
Martin Luther King Jr.
“But be not afraid of going slowly, be afraid only of standing still.”
vi BIOGRAPHY
Hinayah Rojas de Oliveira, daughter of Djmir Marques de Oliveira and Sandra Rojas de
Oliveira, was born on August 10, 1989, in Bragança Paulista, São Paulo, Brazil. In March 2009,
she joined the Animal Science major at the Universidade Federal de Viçosa in the city of Viçosa –
MG, where she studied and joined several research groups and projects.
In April 2009, she was admitted as a Trainee at EJZ Consultoria, where in November 2009
she assumed the Human Resources Department and in November 2010 assumed the Presidency.
In December 2011 she became advisor in the EJZ Consultoria. From December 2011 to February
2012 she did an English course at the Embassy School, in California-USA. From March 2011 to
February 2014 she was granted a scholarship of scientific initiation, under the supervision of
Doctor Ricardo Frederico Euclydes and Doctor Robledo de Almeida Torres. In July 2011, she
participated of the Projeto Rondon, in the city of Poconé – MT. Since September 2013 she has been
writing for a column, the "Gazeta Rural", in the "A Gazeta Regional" newspaper, distributed in the
State of São Paulo. From December 2013 to February 2014 she did an internship at the Embrapa
Gado de Leite, in the city of Juiz de Fora – MG, under the supervision of Doctor Marcos Vinícius
Gualberto Barbosa da Silva.
In November 2011 two of her studies were awarded for its scientific importance at the
Simpósio de Integração Acadêmica, at the Universidade Federal de Viçosa, Viçosa-MG. In March
2014 she received an honorable mention of the Centro de Ciências Agrárias of the Universidade
Federal de Viçosa, for her excellent performance in the Animal Science major courses, and she
started her Masters Course in the area of Genetics and Breeding at the Universidade Federal de
Viçosa, under the supervision of Doctor Fabyano Fonseca e Silva.
On July 27, 2015, she submitted to defense committee her dissertation in order to obtain the
vii SUMMARY
ABSTRACT ... viii
RESUMO ...ix
INTRODUCTION ... 1
GENERAL REVIEW ... 2
1. Genetic breeding of dairy goats ... 2
2. Random regression models ... 4
2.1. Multiple-trait random regression ... 5
3. Parametric functions ... 6
4. Legendre orthogonal polynomials ... 8
5. Segmented Polynomials ... 9
5.1. B-Splines ... 11
6. Bayesian Inference ... 12
MATERIALS AND METHODS ... 14
RESULTS ... 18
DISCUSSION ... 31
CONCLUSIONS ... 35
REFERENCES ... 35
APPENDIX I ... 41
Multiple-trait random regression models ... 42
APPENDIX II ... 48
viii ABSTRACT
OLIVEIRA, Hinayah Rojas de, M.Sc., Universidade Federal de Viçosa, july, 2015. Combining different functions to describe milk, fat and protein yield in goats using bayesian multiple-trait random regression models. Adviser: Fabyano Fonseca e Silva. Co-adviser: Robledo de Almeida Torres.
The present study aimed to propose multiple-trait random regression models (multiple-trait RRM)
combining different functions to describe milk yield, fat and protein percent in a dairy goats genetic
evaluation by using MCMC (Markov Chain Monte Carlo) Bayesian inference. Were analyzed
3,856 milk yield (MY), fat (FP) and protein (PP) percent test-day records from 535 first lactation
of Saanen and Alpine goats (including crosses). The initial analyses were performed using
single-trait RRM, in which for all effects (average curve, additive genetic and permanent environmental)
the following models were considered: third and fifth order Legendre polynomials, linear B-splines
with three (at 1, 20 and 40 weeks) and five (at 1, 8, 15, 20 and 40 weeks) knots, Ali and Schaeffer
function (Ali and Schaeffer, 1987) and Wilmink function (Wilmink, 1987). Residual variances
were modeled by a step function with three classes: 1 to 3, 4 to 8, and 9 to 40 weeks of lactation.
After definition of the best single-trait RRM to describe each trait (MY, FP, PP) based on the
Deviance Information Criterion (DIC), the functions were combined to compose the multiple-trait
RRM. The model based on Ali and Schaffer function fitted better for MY and PP, while the model
based on fifth order Legendre polynomials (Leg5) was the best one for FP. All tested RRM
considering the combinations of functions presented lower DIC values, showing the superiority of
these models when compared to other multiple-trait RRM based only on one function. Among the combined RRM, those considering Ali and Schaeffer function to describe the MY and PP, and
Leg5 to describe the FP, presented the best fit. Estimates of heritability for MY and FP were close
until 20 weeks, ranging from 0.25 at 0.54. The estimates of heritability for PP were, in general,
higher than the estimates for MY and FP, ranging from 0.35 until 0.51. The genetic correlation
between MY and FP and between MY and PP throughout the lactation period were negative, except
for the period immediately after lactation peak. The genetic correlationbetween FP and PP was
positive and approximately constant throughout the lactation (about 0.54). We concluded that
combining different functions in a unique multiple-trait RRM can be an plausible alternative for
ix RESUMO
OLIVEIRA, Hinayah Rojas de, M.Sc., Universidade Federal de Viçosa, julho de 2015. Modelos de regressão aleatória multicaracterísticos combinando diferentes funções para descrever produção de leite, gordura e proteína em caprinos via inferência bayesiana. Orientador: Fabyano Fonseca e Silva. Co-orientador: Robledo de Almeida Torres.
1 INTRODUCTION
Dairy goats are present in every continent and, according to the Asian-Australasian Dairy
Goats Network (AADGN, 2014), currently more than 90% of the 921 million goats existing in the
world are raised in developing countries, being an important source of food and income for these
populations. Among the generated products, despite the low efficiency, goat milk has won a
prominent position, since it is the main raw material used in the production of goat cheese. The
yield and quality of the goat cheese depends, however, on the content of milk components,
especially the fat and protein percent.
Thus, an alternative to improve the efficiency of milk yield, fat and protein percent in dairy
goat herds is through genetic breeding, whose the success also depends on the improvement of
statistical methods used for the (co)variance components and breeding values estimation. Among
the proposed methods, the multiple-trait random regression models (RRM) have been adequate for
the joint analyses of milk yield and milk constituents. Nevertheless, multiple-trait RRM
considering these traits in goats have not been reported in the literature, which present only
multiple-trait analyses considering different kidding orders as different traits, separately for milk,
fat and protein yield (Menéndez-Buxadera et al., 2010). In dairy cattle and buffalos, there are some
studies based on multiple-trait RRM considering these traits, however, the majority of them are
based on the Legendre orthogonal polynomials (Kheirabadi et al., 2014; Pereira et al., 2013;
Borquis et al., 2013).
Under a single-trait RRM, studies about the milk yield of dairy goats using splines
(Thepparat et al., 2014; León et al., 2012) and other specific functions to model the lactation curve
(González-Peña et al., 2012) have demonstrated equal or better fit than the traditional Legendre
polynomial models. Inrelation to the modeling of milk constituents, the majority of the studies
about single-trait RRM have also been based on Legendre polynomials (Andonov et al., 2013), but
some studies in cows have shown that splines are better to describe fat and protein yield
(Bouallegue et al., 2015).
In this context, the combination of these different models under the multiple-trait RRM
framework is an important source of research in the field of animal breeding, since it allows using
different functions to describe different traits in a unique model, enabling improve the fit quality
in relation to single-trait and multiple-trait RRM considering only one function for all traits. Thus,
the present study aimed to propose multiple-trait random regression models combining different
2 protein percent in a dairy goats genetic evaluation by using MCMC (Markov Chain Monte Carlo)
Bayesian inference.
GENERAL REVIEW
1. Genetic breeding of dairy goats
Dairy goats produce about 2% of the world total amount of milk produced by livestock
species (FAO, 2008), however, only the developing countries produce approximately 83% of the
total amount. Thus, most organizations engaged in the genetic breeding of dairy goats are located, currently, in developed countries and are dedicated to milk production (Aziz, 2010).
In Brazil, the first goats were introduced by the Portuguese, French and Dutch settlers
around 1535 year (Machado, 1996). Nonetheless, only from the 1970, the interest in the
commercial exploration of goats for milking purposes has appeared. Due to this interest, in 1974 it
was founded the Associação Brasileira de Criadores de Caprinos (ABCC), later giving rise to the
Associação Brasileira de Criadores de Caprinos Leiteiros (CAPRILEITE). Thus, in the 1970 and
1980 the Association was responsible for a cycle of importing that brought to Brazil animals from
various breeds specifically for milk production, among them the Saanen and Alpine breeds.
The importation of animals was performed from countries that had structured genetics
breeding programs, mainly from European countries and United States of America, and resulted in
dependence of other countries for the Brazil improve its herds. However, besides of health problem
that such importations generated in Brazil, another problem was the difference between the goal
selection between the countries. Among these different goals selection, whereas Brazil had as main
objective to increase the amount of milk, European countries aimed mainly to improve the quality
of milk produced, targeting the manufacture of the goat cheese, and USA had as main goal the type
traits (Aziz, 2010).
From the year 2005 on, the Embrapa Caprinos e Ovinos created the Programa de
Melhoramento Genético de Caprinos Leiteiros (Capragene). It has as its main objective to promote
the genetics improvement of the dairy goats in Brazil through of the accurate identification of the
superior genetically sire for traits such as conformation, milk production and quality, reducing the
dependency on animal importation. Thus, nowadays dairy goats in Brazil is an activity potentially
profitable, which is being consolidated as an important segment of thenational livestock. Then,
Brazil is currently the 17th largest producer of goat milk in the world and the largest producer of
3
per animal is around 1 kg/goat/day, and the process of herd improvement has not followed the trend of modernization and intensification of the production system, in general. The intensive dairy goat activity prevails especially in the southern and southeastern regions of the country, due to the better prices paid for goat milk. Importantly, that the goat milk is not paid for its quality in Brazil, nonetheless, as some companies have already paid cow milk in accordance with protein and fat
content, there is a tendency that, in a few years, the goat milk is also paid for its content.
In France, currently, the breeding programs have been based on index selection called ICC
(Index Combine Caprine), which combine information about total protein, total fat and fat and protein percent, but does not include the amount of milk produced. Recently, type traits as
attachment of the udder and the placement of teats has been introduced using a type score. The
Spanish selection program for improving goat milk production have been based on milk yield and
protein percent. In the USA, genetic evaluation have been based on milk, fat and protein yield and
type traits (Aziz, 2010).
According to Wood (1967), the knowledge of the lactation curve is essential to lead the
nutritional and reproductive management adopted in the farm, since it allows, from the registrations
of incomplete productions, for the evaluation of animals before the end of yielding, saving time
and financial resources. The comparison of the shape of the curve between different groups of
animals, with different genetic group, ages, herds and other treatments of interest, are of great
importance because these comparisons can provide information about the effectiveness of these
groups, providing a better production control beyond the selection of those more productive
animals.
There are different mathematical models for studying the lactation curve, as Wood (1967),
Ali and Schaeffer (1987) and Wilmink (1987) models (more details about this models on the topic
of parametric functions), but not always the parameters used in these models adjust adequately,
since many factors can be influencing production. Among the factors that influence the lactation
curve of goats are breed, number of offspring, order of kidding, year and season of kidding and
potential yield (Silva et al., 2013a). Among the used methodologies, those that consider the random
regression models have been proposed as an alternative to model traits that are repetitious in the
4 2. Random regression models
Longitudinal data, such as the milk yield, fat and protein percent test-day, need a special
statistical treatment, since the covariance pattern among the repetitive measurements is well
structured. Then, an alternative to work this data is through applying random regression models.
The use of random regression models (RRM), also known as infinite dimensions models,
was proposed by Henderson Jr. (1982) as an alternative to overcome the problem of
overparameterizing in multiple-trait analyses. Thus, in random regression, coefficients for the
chosen polynomials are estimated in order to explain the variation of the trait(s) through time. According to Schaeffer (2004), the RRM must contain a set of fixed curves that describe
the phenotypic relation for the various groups of individuals, and random regressions for the
additive genetic and the permanent environmental effects. This way, in the RRM the fixed
regression describes the average curve of the population, the additive genetic effect describes the
curve of each animal as a difference from the genetic average of the population, the permanent
environmental random regression describes the non-additive differences, and the variations not
explained by the regression are called the residues.
It is important to emphasize that the RRM present a series of advantages in relation to the
traditional models, since they do not require a minimum number of records per animal, which
means that there is no need to exclude animals with few records of the analysis; consider the
relationship matrix for obtaining genetic estimates; allow the estimating of the covariance
components among the controls; allow estimating the heritability of the trait and the estimated
breeding value of the animals in any given point of the curve; allow to use the phenotypic
information without the need of adjustment factors and/or time standards, which means it makes it
possible to work with the milk yield data on the same day of the test-day; allow using heterogeneous
residual variance; admit the use of random permanent environmental effect; and, mainly, make it
possible to estimate a smaller number of parameters than other methodologies, especially when the
objective is to obtain genetic parameters among various traits simultaneously analyzed.
Moreover, Andonov et al. (2013), comparing single-trait random regression and
repeatability models to predict breeding values for milk yield, fat and protein content test-day
records of Norwegian goats, conclude that the genetic merit was predicted more accurate with
RRM than with the repeatability model. In bovines, Khanzadeh et al. (2013), working with Holstein
cattle, found similar results to the Andonov et al. (2013), when estimated the daughter yield
5 The RRM fit implies assuming a determined covariance structure between the records taken
over the time. This structure is characterized as a function of covariance and as a result of the
covariance among the random regression coefficients (Meyer, 1998). Resende et al. (2001) mention
that the RRM and the functions of covariances are able to express in a more realistic way the
phenomena associated to longitudinal data, as they assume that the trait in question can continually
and gradually change over time.
The possibility of using the milk yield on the day of control instead of the accumulated milk
yield (AMY) brings undisputable advantages in terms of animal genetic breeding, since it minimizes the errors in estimating the AMY for the calculation of the breeding values. However,
it is still not well defined in the literature the best method for calculating the accuracy of the
generated estimates.
The concern about the number of parameters to be estimated is related to the computational
demand. In other words, related to difficulties of adequate convergence in terms of computational
algorithms. Therefore, the advantage of the RRM becomes even greater when there is the interest
in performing multiple-trait analyses of longitudinal data, as in the case of milk yield, protein and
fat content, which has become even more essential due the perspective of remuneration related to
the quality of the milk.
2.1. Multiple-trait random regression
The use of multiple-trait random regression models (MRRM) for dairy goats is important,
since it allows the study of the genetic relations between milk yield and its components during
lactation. Thus, it is possible to work with milk yield on test-day along with the protein and fat
contents, essential components for the manufacture of milk products. Besides, the multiple-trait
random regression assures all the advantages of multiple-trait analyses in relation to single-trait
analyses, such the increase in the estimate of additive genetic variance, the reduction of residual
variance and the increase of accuracy (Boligon et al., 2011).
However, although it seems to be a sensible choice to work with MRRM in the dairy goats
genetic breeding area, few studies have used this methodology. Menéndez-Buxadera et al. (2010),
working with Murciano-Granadino goats, compared the genetic parameters and the estimated
breeding values obtained with MRRM considering the same trait in different lactations, based on
the Legendre orthogonal polynomials, with the ones obtained by the repeatability test-day models
6 being preferable, since they guarantee a better response for selection programs. Moreover, the
authors mention that genetic evaluations based on MRRM have the additional advantage of
permitting selection of animals by their lactating curves shape. We have, not found studies based
on MRRM considering different traits in dairy goats in the literature.
Borquis et al. (2013), working with Murrah buffalos in a MRRM based on Legendre
polynomials for the estimation of genetic parameters for milk, fat, and protein yield, found that the
accuracy associated with estimated breeding values obtained using multiple-trait random
regression was slightly higher (around 8%) when compared with single-trait random regression. The authors explain this difference to the greater amount of information available per animal, in
the MRRM. Muir et al. (2007) and Hammami et al. (2008) found similar results working with dairy
cattle.
It is necessary to emphasize, however, that even though the MRRM are more appropriate
for studies that involve correlated traits, the multiple-trait random regression analyses are more
exigent in computer terms than the single-trait random regression ones, which can mean problems
in converging the used algorithms, since the dimensions of the matrices and the vectors are in
function of the number of traits analyzed.
The application of RRM has become popular since the use of parametric functions
specifically created to model lactating curves, as is the case of Wilmink (1987) and Ali and
Schaeffer (1987) functions. However, studies using RRM based on parametric functions are most
often found in the literature about goats as a milk-trait analysis. (González-Peña et al., 2012; León
et al., 2012).
3. Parametric functions
The first mathematic functions created to represent the pattern of milk yield during lactation
were proposed by Brody et al. (1923) and Brody et al. (1924), however, only after the development
of the function proposed by Wood (1967) is that the using of parametric functions has become
popular. Since then, many researchers have attempted to develop empiric mathematical models to
describe the shape of the lactating curve of production animals (Pereira, 2013).
The empiric mathematical models of lactating curves are regular functions y = f (t), defined
for positive values of daily milk yield (y) and time of lactation (t). Each function has parameters
that are associated to the phases of the curve of lactation, making it possible to estimate the
7 the parameters be similar in different functions, they do not have the same mathematical and/or
biological interpretation.
Then, each function presents specific interpretations and unique estimates of its parameters
that can describe more or less accurate terms the reality of the data. This way, the usage of a model
or function depends on its ability to describe the production, being preferable those with the
smallest associated prediction error (Groenewald and Viljoen, 2003), for that posteriorly can be
obtained accurate estimates of the breeding values of each animal for the economically interesting
traits.
Several mathematics functions, linear and non-linear, have been proposed to describe the
shape of the lactation curve. Jamrozik et al. (1997), working with cows, compared many of these
functions. Among all, the authors found to be more adequate the RRM based on Ali and Schaeffer
(1987) and Wilmink (1987) functions, for after, to be compared to each other. Based on the
obtained results, Jamrozik et al. (1997) observed that the RRM based on Wilmink function to
describe the shape of the lactation curve required fewer computational resources and less time for
analyses, while the RRM base on Ali and Schaeffer function has produced fewer prediction errors.
Nonetheless, the authors have also observed that the RRM based on Wilmink and Ali and Schaeffer
functions have generated practically the same classification of bulls by predicted genetic values at
305 days, being both of them adequate to describe the curve of milk yield of these animals.
In dairy goats, González-Peña et al. (2012) and Breda et al. (2006), working with Alpine
breed, compared diverse mathematical models used to describe the lactation curve, among them
the Wilmink (1987), Ali and Schaeffer (1987) and Legendre orthogonal polynomials. Both authors
conclude that Ali and Schaeffer and Legendre polynomials models were the best functions to model
adequately lactation curves of Alpine goats. However, Breda et al. (2006) comments that the
genetic correlation estimates between milk yields in the beginning and in the end of lactation
obtained by Ali and Schaeffer function were negative.
It is important to show, however, that although the parametric functions tend to describe
better the shape of the lactation curve, the predictions can be not accurate due to not so adequate
numeric properties. Thus, it is suggested that these numerical properties can be improved through
orthogonalizing the covariance for each given random effect (Nobre et al., 2003).
This way, based on the fact that polynomial regression is appropriate and flexible to adjust
8 2003). It has been prioritized, then, the use of non-parametric functions in the processes of
estimating covariance functions, as in the Legendre orthogonal polynomials.
4. Legendre orthogonal polynomials
The Legendre orthogonal polynomials (LOP) are non-parametric functions derived from a
transformation made in the independent variable. In the case of milk yield, the transformation of
the lactation days (a) can be obtained through the equation shown in Kirkpatrick et al. (1990):
a∗ = a − a
a ax− a −
in which a ax and a are the highest and the lowest days in lactation that can be found in the
data set, respectively.
Also, still according to Kirkpatrick et al. (1990), the jth normalized LOP, ϕ , can be defined
as follow:
ϕ a∗ = √ k + ∑ − [ / ]
= km
k − m
k a∗ −
where a∗ is the established day for the range in which the polynomial k is defined as [-1 to +1].
One of the biggest advantages of the LOP is that, since they are orthogonal, they reduce the
problems of multicollinearity of the data, which means the columns of the matrix referring to the
days are independent, preventing the matrix to become non-defined positive. Another important
advantage of the LOP is that, as the lactating days become independent after the transformation,
new terms can be added to the model without the need to alter the previous estimates, a process
that increases the computational efficiency.
However, it is important to remember that very complex polynomials make the convergence
of the algorithms more difficult, make the results more difficult to be obtained or the analyses less
accurate. In addition, it is possible for the polynomial interpolation to present oscillations in the extremes of the curve of the interpolated interval that tend to the infinite. This effect is
9 The Runge Effect describes the increase of the error of polynomial approximation due to
the increase in the adjustment order, with errors predominantly attributed to oscillations in the
curve extremes. López-Romero et al. (2004) comments that such behavior can generate unfeasible
estimates of variance components in the extremes of the curve of the control variable and negative
correlations between farther control days.
On the other hand, the choice of very simple equations and poorly parameterized makes
modelling more difficult, becoming inefficient to explain part of the genetic variations. Therefore,
an alternative to reduce the order of the employed functions without compromising the fit of the model is through using segmented polynomials.
Several studies involving single-trait random regression models (SRRM) based on the LOP
have already been found in the literature of dairy goats, among them Thepparat et al., 2014;
Andonov et al., 2013; Silva et al., 2013b; Sarmento et al., 2008; Zumbach et al., 2008 and Breda
et al., 2006. For multiple-trait random regression analyses based on LOP, however, there are still
just a few studies found, being that most of studies considering one trait in different lactations
(Menéndez-Buxadera et al., 2010).
5. Segmented Polynomials
The segmented polynomials, also known as splines, can be defined as segments of
polynomials of m order that are connected in a way to have continuous derivations of m-1 order
(Rice, 1969). In essence, what is done is to adjust regression lines in different gaps and to connect
them with knots. Therefore, another definition for splines is that these are models with local fits
among knots that allow to estimate the functional state of the data.
As with the Legendre orthogonal polynomials, in splines, the independent variable (x) is
transformed. However, more than just taking into consideration the knots, in splines calculations
the order of the used polynomial is considered since the beginning of the analysis. This way,
segmented polynomials do not have the advantage of being possible to add coefficient without
altering the other ones, as is the case of Legendre polynomials.
The polynomial order to be used must be defined according to the knowledge of the
researcher about the trait, being the number of random regression coefficients to model the
trajectory of the functions on linear, square and cubic bases given respectively by N, N+1 and N+2,
10 According to Schenkel (1989), among the advantages of the segmented polynomials, it can
be mentioned: the reduction of multicollinearity in analyses, once the independent variable (x) is
transformed; the improvement in modeling, given that the behavior of the function that describes
the relation of the variables in one region becomes independent from the behavior in other regions;
their linearity in terms of parameters; the fact that they have best properties (Best Linear Unbiased
Estimators - BLUE); and the increase in the domain of approximation, which means, they are able
to provide estimates in a broad spectrum of possible values.
Misztal (2006) comments that since each coefficient of a segmented polynomial affects only a fraction of the trajectory, models with better numerical properties are expected, so that the
changes in the extremes of the trajectory are more moderate. Therefore, differently from what
happens with LOP, in splines the Runge Effect is not observed.
Furthermore, Misztal (2006) demonstrates that the knots of the segmented polynomials can
be chosen in order to correspond to the pattern of changes along the trajectory, which would result
in a reduction in the dimension of the model. This way, the knots can be denser in regions of fast
changes, and scarcer in regions of slow changes. However, one of the biggest difficulties of
working with segmented polynomials is the recognition of the spots where the knots must be
inserted. To define the best points, Schenkel (1989) comments that among the known methods are
the previous knowledge of the researcher in the area, the use of diagrams and averages for
estimating the knots and/or the use of a non-linear model for estimating not only the knots but also
the regression coefficients.
Thepparat et al. (2014) compared covariance functions of milk yield from test-day records
among exotic (Saanen, Anglo-Nubian, Toggenburg and Alpine) and crossbred goats (Thai native
and exotic breed). Among the tested covariance functions were Wilmink function (1987), second
and third order Legendre polynomials, and two models with linear splines with 4 knots (located at
5, 25, 90 and 155 days in milk and 5, 35, 95 and 155 days in milk). The authors concluded that the
covariance function had an important impact on (co)variance estimation in RRM and that the RRM
based on splines with 4 knots (located at 5, 25, 90 and 155 days in milk) had better fit than all other
tested functions. The authors also comments that the model based on linear splines was more
appropriate than model based on LOP due to its greater flexibility, offering knots in the shape of
fitted curves.
It is necessary to emphasize that there are several types of segmented polynomials.
11 genetic evaluation, and it is possible to find interesting studies with dairy cows (Bohmanova et al.,
2008; Jamrozik et al., 2010; Bignardi et al., 2012). Studies with dairy goats using B-splines are still
scarce in literature.
5.1. B-Splines
B-spline functions are local base functions used to implement the spline segments due to
their better numerical and computational properties, when compared to other base functions (de
Boor, 2001; Schumaker, 2007). According to Meyer (2005), the B-splines functions comprehend a set of overlapped functions, smooth and non-negative, that are single-mode and add up the unit
for all time values.
The B-spline segmented polynomials present interesting computational properties, since
they reduce the cost per iteration and increase the convergence rate, when compared to models with
LOP (Bohmanova et at., 2005; Robbins et al., 2005). Misztal (2006) states that this superiority of
the B-splines functions is due to better numerical properties of these functions, since each
coefficient affects only a fraction of the trajectory.
Santos et al. (2014), studying the prediction of the genetic values for milk yield from Guzerá
cows, using random regression models, compared the quality of the fit of the additive genetic and
permanent environmental effects modeled by Wilmink function, Ali and Schaeffer function, cubic
B-spline and LOP. The authors have concluded that the best fit was provided by the model that
used the cubic B-spline function with five coefficients of random regression for the additive genetic
and permanent environmental effects. However, the same authors comment that the effects can be
modeled using Ali and Schaeffer function and/or the Legendre polynomials, with little variation in
the estimates of the generated genetic parameters. Bignardi et al. (2011) compared model variations
in test-day milk yield during the first lactation of Brazilian Holstein cows by RRM considering the
mean trend of milk yield modeled with a fourth order LOP, and the additive genetic and permanent
environmental covariance functions modeled by Ali and Schaeffer, Wilmink and B-spline
functions. The authors concluded that the RRM based on B-spline and Legendre polynomials as
base functions are the most adequate to describe the covariance structure of the data, however, they
comments that B-spline functions were less susceptible to implausible genetic variance estimates
at extremes of the trajectory.
In the dairy goat area, studies about RRM based on B-spline are still scarce in the literature.
12 quadratic and cubic, from 3 to 6 knots) to describe the milk yield test-day of Alpine and Saanen
goats, concluded that the most suitable RRM for genetic evaluation of milk yield of Alpine and
Saanen breeds are a quadratic B-spline function with six knots, and a cubic B-spline function with
six knots, respectively.
One of the methodologies used to estimate regression coefficients (either adopting the
B-spline segmented polynomials, Legendre polynomials or through parametric functions) is the usage
of Bayesian methods.
6. Bayesian Inference
The statistic inference works in the presence of observations (y), being the values initially
unknown described by means of a probability distribution p(y|θ). Thus, the Bayesian theory is
based on a theorem proposed by Thomas Bayes in 1761, which proposes that the uncertainty of a
parameter must be quantified in terms of probability. The proportionality that represents Bayes
Theorem is given by:
p θ|y ∝ p y|θ p θ where:
p(θ) is the prior probability density of θ, which reflects the level of accumulated knowledge about
the possible values of θ, before data contained in y is obtained;
p(y|θ) corresponds to likelihood function of y that represents the contribution of the data to the
knowledge of the parameter;
p(θ|y) is the posterior probability density of θ, over which are done the inferences related to some
specific parameter of interest.
The Markov Chain Monte Carlo (MCMC) methods constitute a family of iterative
processes to approximate the generation of multivariate distribution samples. These methods have
become the most important computational tool in Bayesian statistics, since they generate Markov
Chains, which means chains whose parameter n depends only on the parameter n-1, by means of
the iterative Monte Carlo simulation, that generates random values, whose stationary distribution
is the own posteriordensity of interest (Sorensen and Gianola, 2002). This way, the MCMC method
avoids the resolution of the complicated integrals that did not allow the use of the Bayesian
13 Gibbs sampling, a particular case of the algorithm of Metropolis-Hastings of the MCMC
method, is presented as a technique for indirectly obtaining the random variables of a marginal
distribution without, however, the need to calculate the marginal probability density function
(Casela and George, 1992). Geman and Geman (1984) define Gibbs sampling as a method of
alternated conditional sampling defined in terms of subvectors of θ. Each iteration in Gibbs
sampling consists of simulating values for each subvector de θ, conditionally to values of all the
subvectors, totalizing K simulations for each complete iteration of the cycle. This kind of
approximation will get better as the number of samples used in the calculations increase. However, successive samples are dependent on one another, which is undesirable and, for this reason, there
is a discard of intermediate samples, known as thin. Besides, the stage of heating upof the chain,
or in the other words, previous stage to the chain convergence, is also discarded (burn-in). The size
of the chain to be generated is related to the easiness for converging the posterior distributions of
the parameters, and they should vary according to the data and the functions used in the analyses.
Among the advantages of the Bayesian inference, it is necessary to mention that it provides
precise solutions for the problem of finite size samples, since that for each data set there is an exact
posterior distribution for inferences; it makes possible to build exact probability intervals for the
estimates of the genetic parameters, being the probability of the parameters associated to the
quantity and accuracy of the used information; in general, it presents estimates with smaller pattern
deviation than the Restricted Maximum Likelihood Method (REML); it permits the use of prior
information; and it presents computational advantages, since it does not require solutions for mixed
model equations, making analyses easier.
However, when comparing models in Bayesian inference, it is not usual to adopt the Akaike
information criteria (AIC) and the Bayesian information criterion (BIC) because the prior act as
reducers of the effective number of parameters through its interdependences. Then, when working
with Bayesians it is used the Deviation Information Criteria (DIC), proposed by Spiegelhalter et
al. (2002), for comparing the models.
The DIC can be describe as follow:
,
where is a point estimate of the deviance obtained by substituting the parameters by their
posterior means estimates in the likelihood function; and is the effective number of parameters
in the model.
D
DICD( ) 2p
D( )
D
14 MATERIALS AND METHODS
Phenotypic data and systematic effects
In the present study, 3,856 milk yield, fat and protein percent test-day records from 535 first
lactation of Saanen and Alpine goats (including crosses) belong to Universidade Federal de Viçosa,
Brazil, were analyzed. The relationship matrix included a total of 1,061 animals, up to 3 previous
generations to animals with phenotypic data.
The goats were kept in collective stalls under the free stall system and received feed based
on corn silage and hay, in addition to concentrated mixture, provided according to their nutritional
requirements. In order to reduce the reproductive seasonality of the animals, the herd adopts the
use of hormonal protocols. The kids were separated from their mothers immediately after birth.
The goats have kidded between 2000 and 2014 years, and the milk yield records were obtained by
mechanical milking. Milk components were estimated monthly at the Milk Quality Laboratory of
the Universidade Federal de Viçosa.
Milk yield, fat and protein percent records were considered weekly, varying from 1 (starting
subsequently on the fifth day after kidding) to 40 weeks. According to Meyer (2005), RRM using
polynomials of high orders require that each animal has more records than the order of the used
polynomials to avoid implausible (co)variance component estimates. Thus, only animals with at
least five records were included in the analyses. Data considered as outliers (μ ± 3 standard
deviation, inside contemporary group) were discarded.
The systematic effects for all traits were: contemporary group (defined as year and season
of kidding, where the season was divided in April to September and October to March. A total of
21 contemporary group were formed, with minimum of 5 and maximum of 57 animals); litter size
(formed by 2 groups, one or two kids, where the first group was formed by 176 animals and the
second one was formed by 359 animals); and genetic group (formed by 3 groups, Alpine ≥ 90%,
Saanen ≥ 90%, and crossbreed between Alpine and Saanen goats, with minimum of 122 and
maximum of 241 animals). The age of the dam at kidding was included as covariate with linear
effect for all traits. After data editing, the descriptive statistics of milk yield, fat and protein percent
15 Table 1. Descriptive statistics of milk yield, fat and protein percent test-day records.
Statistics Milk yield (Kg) Fat percent (%) Protein percent (%)
N 3,856 3,856 3,856
Mean 2.33 4.51 4.09
SD 0.96 0.86 0.38
Minimum 0.20 1.36 2.14
Maximum 6.30 8.93 6.45
N: number of observations; SD: standard deviation.
Random regression models
The initial analyses were performed using single-trait random regression models
(single-trait RRM). These models included the average curve of the population, systematic effects and, the
additive genetic, permanent environmental and residual as random effects. To model the average
curve, additive genetic and permanent environmental curves, third and fifth order Legendre
polynomials, linear B-splines with three (at 1, 8 and 40 weeks) and five (at 1, 8, 15, 20 and 40
weeks) knots, Ali and Schaeffer function (Ali and Schaeffer, 1987) and Wilmink function
(Wilmink, 1987) were used. The Ali and Schaeffer function (1) and the Wilmink function (2) can
be describe as follow:
yt = a + bf + cf + dw + gw , (1)
where a, b, c, d and g are the parameters that define the shape of the lactation curve; f is given by
(t/tt) and w is given by ln(tt/t), assuming that t is the number of weeks in lactation in which milk
yield was registeredandtt is the total time of lactation (in weeks).
yt = a + b exp −kt + ct , (2)
where a is a parameter associated to the initial milk yield; b is a parameter associated to the decline
rate of milk yield after the lactation peak; c is a parameter associated to the increase rate of milk
yield up to the lactation peak; t is the number of weeks in milking in which production was
registered; and k is a mathematical constant, assumed herein that k=0.05.
Residual variances were modeled by a step function with three classes: 1 to 3, 4 to 8, and 9
to 40 weeks of lactation. These classes were chosen according to preliminary single-trait RRM
analyses considering a basic third order Legendre polynomials.
The RRM were compared based on the Deviance Information Criterion (DIC) developed
16 ,
where is a point estimate of the deviance obtained by substituting the parameters by their
posterior means estimates in the likelihood function; and is the effective number of parameters
in the model. In order to facilitate the interpretation of the DIC values in terms of the superiority
of one model over another, the model posterior probabilities (MPP) were calculated from DIC
using the approximation presented by Silva et al. (2011), which is given by:
2
t t t
t 1
p(M | ) exp / 2
/
exp / 2
l ,
where p(M | )t l is the posterior probability of model t; t is the DIC difference between model t
and the best model (that present smaller DIC).
After definition of the best single-trait RRM to describe each trait (milk yield, fat and
protein percent) based on the DIC, the functions were combined to compose the multiple-trait RRM
(combined RRM). The coefficients of the functions related to intercept, in the combined RRM,
were standardized in order to ensure that the generated estimates by the different functions could
be properly scaled. Multiple-trait RRM analyses considering the same function for all traits were
also tested.
To choose the best multiple-trait RRM, the spent time per iteration was considered as
selection criterion, in addition to DIC and MPP. The general RRM can be described as follow:
y = �G + LS + GG + ∑ −= X + ∑ −= Z + ∑ −= ω W + e , (3)
where y is the milk yield, fat and/or protein percent in the test-day j for goat i within
contemporary group k, litter size l and genetic group o; �G is the contemporary group effect; LS
is the litter size effect; GG is the genetic group effect, are the m fixed regression coefficients;
and ω are the m random regression coefficients associated with the additive genetic and
permanent environmental effects of animal i, respectively; X , Z and W are the polynomial m
for weeks in milk, with order p-1; and e is the random error. In the matrix notation, the model
in (3) can be described as:
� = � + + � + � ,
D
DICD( ) 2p
D( )
D
17 where: y is the vector of phenotypic record(s); �, a, p and e are, respectively, the vectors of
systematic effects, additive genetic coefficients, permanent environmental coefficients and residual
effects; X, Z and W are incidence matrices of �, a and p, respectively.
In this context, � ~ N � + + �, � ⊗ � , � , � and � follow independent uniform distributions. For the vectors = [ ]′ and � = [� � � ]′, were assumed, respectively, ~ N , � ⊗ and � ~ N , ��⊗ � , in which G and �� are the covariance matrices. For the residual vector it was assumed that e ~ N , � ⊗ � . Uniform prior distributions
were assumed for the systematic effects, Gaussian distributions for genetic and permanent
environmental coefficients, and the inverse Wishart distribution for the (co)variance matrices.
Details about the multiple-trait RRM, including G, �� and R matrix, are shown in Appendix I. All analyses were executed using a computer Intel Core i7-2600 (8M Cache, up to 3.80 GHz) and 8.00
GB RAM. The operating system used was Windows 7. The (co)variance components were
estimated by Bayesian inference using the GIBBS3F90 software (Misztal, 2010).
A chain length of 250,000 cycles, considering a burn-in period of 50,000 cycles, and a
sampling interval (thin) of 5 cycles was established for all analyses. The convergence criterion was
based on graphical analysis and Geweke criterion (Geweke, 1992) available in the package
Bayesian Output Analysis (Smith, 2007) of the R software (R Core Team, 2015).
The posterior marginal distribution samples for heritability throughout the lactation curve
for each trait were obtained by:
h = σ̂ σ̂a
a +σ̂ + σ̂e ,
where: h is the heritability estimate for trait q at test-day j, σ̂a is the additive genetic variance
for trait q at test-day j (on the Σ matrix, in Appendix I), σ̂ is the permanent environmental
variance for trait q at test-day j (on the � matrix, in Appendix I), and σ̂e is the residual variance
for trait q, that depends on the residual variance classes mentioned earlier (if week in lactation ≤ 3; 3 < week ≤ 8 and if the week in lactation > 8).
The posterior marginal distribution samples for correlation between traits throughout the
lactation curve were obtained by:
r , ′ = σ̂a , ′
√σ̂a .σ̂a ′
18 where: r , ′ is the correlation between traits q and q' at test-day j, σ̂a , ′ is the genetic covariance
between q and q' at test-day j (on the Σ matrix, in Appendix I), σ̂a is the additive genetic
variance for trait q at test-day j and σ̂a ′ is the additive genetic variance for trait q' at test-day j
(on the Σ matrix, in Appendix I).
The breeding values for each animal i were estimated for accumulated milk yield at 40
weeks (MY), and for fat (FP) and protein (PP) percent of milk using the posterior mean of the estimated random regression coefficients, as follow:
��V̂ MY = ∑ ��V4 ̂ MY ��V̂ FP = ∑ ��V̂ FP 4
⁄ ��V̂ PC = ∑ ��V̂ PP 4
⁄
where ��V̂ of animal i at test-day j is provided by multiplying the vector of (co)variables for
animal i related to the function used (Legendre, B-spline, Wilmink or Ali and Schaeffer) by the
vector with breeding values for covariance function coefficients (details in Appendix I).
After estimating the breeding values for each trait (MY, FP or PP), the breeding values were standardized and the animals were ranking based on the index selection, calculated by:
Ii
̂ = . ∗ ��V̂ MY + . ∗ ��V̂ FP + . ∗ ��V̂ PP
where Îi is the index selection of the animal i. The Pearson correlation for the index selection and
the Kendall rank correlation were obtained using the function cor, in the R software (R Core Team,
2015), for all animals in the pedigree and for the sires with more than 10 daughters each.
Percentages of selected individuals in common between different RRM were obtained considering
2%, 5%, 10%, 20% and 50% of the best individuals.
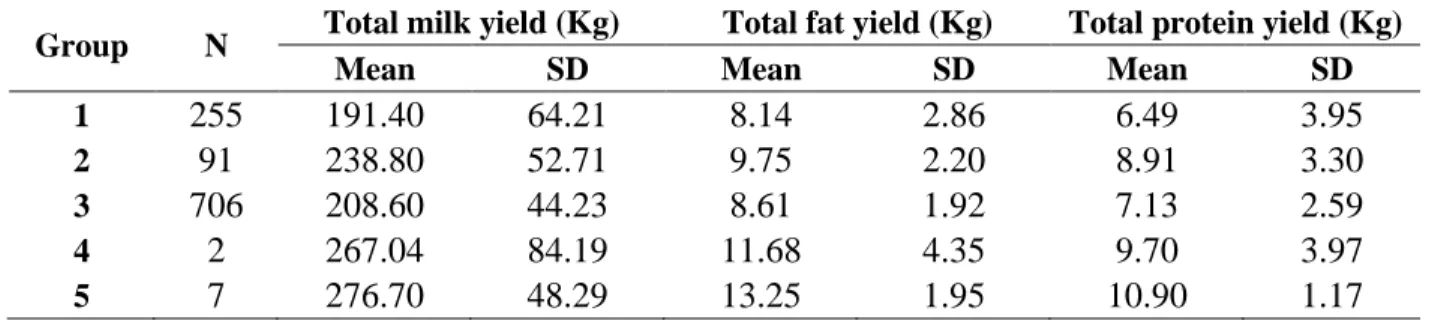
The animals were clustered by the additive genetic curves estimated by the combined RRM
considering the Euclidean distance, using the NbClust package (Charrad et al., 2014) available in
the R software (R Core Team, 2015). Total milk yield, total fat yield and total protein yield for
each group were calculated as the sum of the milk, fat and protein mensal yield estimated,
respectively.
RESULTS
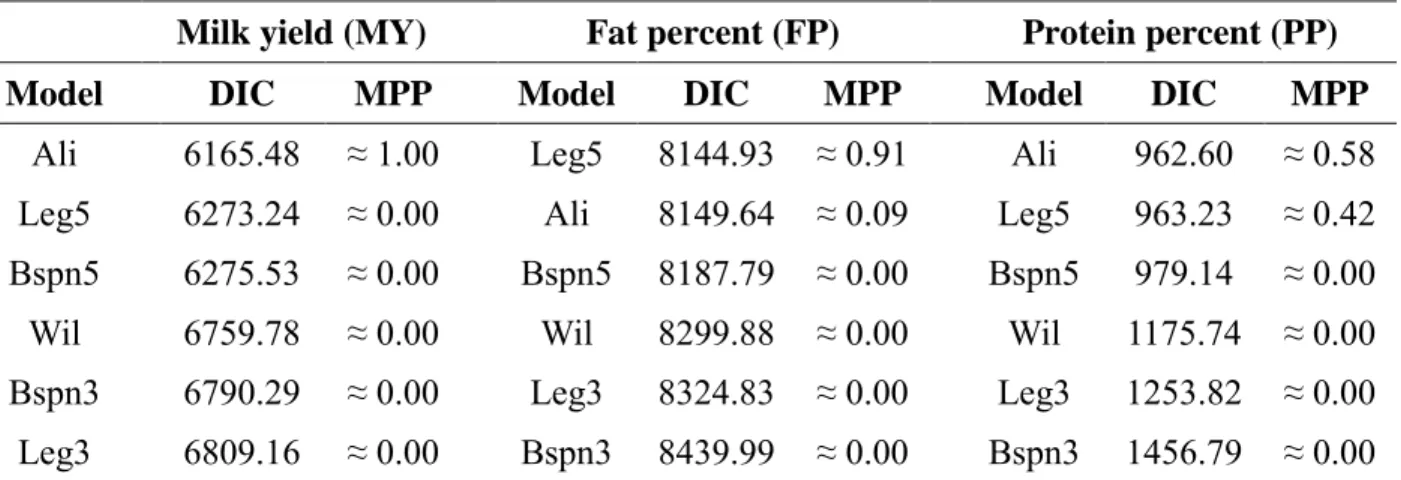
The Deviance Information Criterion (DIC) and the model posterior probabilities (MPP)
calculated for the comparison between the single-trait RRM for MY, FP and PP, based on third and
19 (Bspn3 and Bspn5), Ali and Schaeffer function (Ali) and Wilmink function (Wil) are shown in
Table 2.
Table 2. Deviance Information Criterion (DIC) and the model posterior probabilities (MPP) estimated for the single-trait random regression tested models.
Milk yield (MY) Fat percent (FP) Protein percent (PP)
Model DIC MPP Model DIC MPP Model DIC MPP
Ali 6165.48 ≈ 1.00 Leg5 8144.93 ≈ 0.91 Ali 962.60 ≈ 0.58
Leg5 6273.24 ≈ 0.00 Ali 8149.64 ≈ 0.09 Leg5 963.23 ≈ 0.42 Bspn5 6275.53 ≈ 0.00 Bspn5 8187.79 ≈ 0.00 Bspn5 979.14 ≈ 0.00
Wil 6759.78 ≈ 0.00 Wil 8299.88 ≈ 0.00 Wil 1175.74 ≈ 0.00
Bspn3 6790.29 ≈ 0.00 Leg3 8324.83 ≈ 0.00 Leg3 1253.82 ≈ 0.00 Leg3 6809.16 ≈ 0.00 Bspn3 8439.99 ≈ 0.00 Bspn3 1456.79 ≈ 0.00
Ali: Ali and Schaeffer function; Leg5 and Leg3: fifth and third order Legendre polynomials, respectively; Bspn5 and Bspn3: linear B-spline with five and three knots, respectively; Wil: Wilmink function.
The model based on Ali and Schaffer function fitted better for MY and PP, while the model
based on fifth order Legendre polynomials was the best for FP. These single-trait results were used
to define the following combined multiple-trait RRM: Ali_Ali_Leg5, Ali_Leg5_Ali and
Ali_Leg5_Leg5; where the first name (before the underline) refers to the function used to describe
the MY, the second one the FP and the third one the PP. The spent time per iteration (Time), DIC
20 Table 3. Spent time per iteration (Time), Deviance Information Criterion (DIC) and the model posterior probabilities (MPP) estimated for the multiple-trait random regression models.
Model Time DIC MPP
Ali_Leg5_Ali 0.1728 808.4021 ≈ 1.00
Ali_Ali _Leg5 0.1742 830.8451 ≈ 0.00
Ali _Leg5_Leg5 0.1787 848.6646 ≈ 0.00
Leg5_Leg5_Leg5 0.1050 884.9908 ≈ 0.00
Ali_Ali_Ali 0.0632 933.3734 ≈ 0.00
Bspn5_Bspn5_Bspn5 0.1267 989.2999 ≈ 0.00
Wil_Wil_Wil 0.0270 1497.0308 ≈ 0.00
Leg3_Leg3_Leg3 0.0275 1649.0182 ≈ 0.00
Bspn3_Bspn3_Bspn3 0.0348 2431.1232 ≈ 0.00
Symbol models: The first name (before the underline) refers to the function used to describe the MY, the second one the FP and the third one the PP. Ali: Ali and Schaeffer function; Leg5 and Leg3: fifth and third order Legendre polynomials, respectively; Bspn5 and Bspn3: linear B-spline with five and three knots, respectively; Wil: Wilmink function.
Time was higher for the models considering the combinations of functions (Ali_Ali_Leg5,
Ali_Leg5_Ali and Ali_Leg5_Leg5) due to greater complexity of these analyzes. However, all
combined RRM presented lower DIC values, showing the superiority of these models when
compared to other multiple-trait models based on one function (Leg5_Leg5_Leg5, Ali_Ali_Ali,
Bspn5_Bspn5_Bspn5, Wil_Wil_Wil, Leg3_Leg3_Leg3 and Bspn3_Bspn3_Bspn3). Among the
combined models, the model that presented the best fit to the data was the model considering Ali
to describe the MY and PP, and Leg5 to describe the FP, similar to that found in the single-trait
analysis.
The used function have influence on the variance components estimates, thus, we compared
the variances obtained using the combined RRM (Ali_Leg5_Ali) with the variances estimated by
two multiple-trait RRM considering the same function to all traits (Ali_Ali_Ali and
Leg5_Leg5_Leg5). These variances from multiple-trait models were also compared with the
estimates generated by three single-trait RRM: two based on Ali (to describe MY and PP) and one
based on Leg5 (to describe FP).
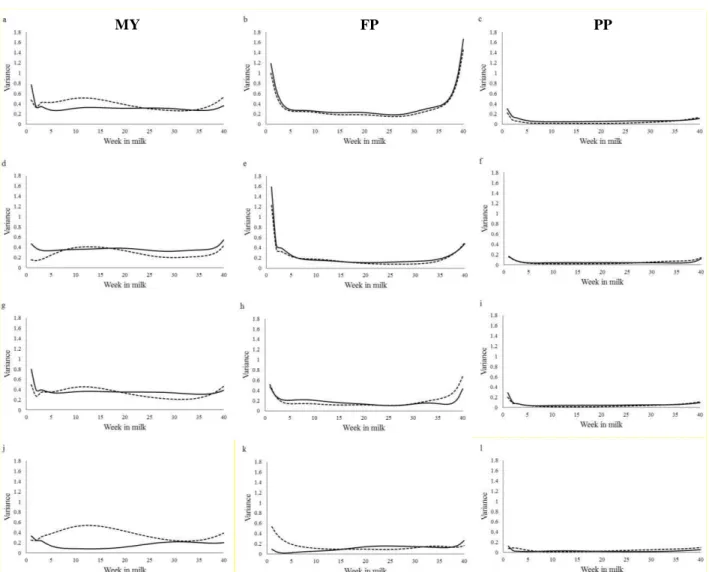
In general, the additive genetic variance (σ̂a) and permanent environmental variances (σ̂ e)
21 followed the same pattern for each trait, but, the σa were smaller in the single-trait RRM when
compared to multiple-trait models (Figure 1).
Figure 1. Additive genetic variance (___) and permanent environmental variance (---) estimated by
the combined multiple-trait random regression model (a, b, c), multiple-trait random regression
model based on fifth order Legendre polynomials (d, e, f), multiple-trait random regression model
based on Ali and Schaeffer function (g, h, i) and by the single-trait random regression model (j, k,
l); for milk yield (MY, left), fat percent (FP, middle) and protein percent (PP, right).
The σa estimated for MY by the combined RRM and by the multiple-trait RRM based on
Ali were very similar, nonetheless, the σ e estimated by the combined RRM was a little higher
than the others multiple-trait RRM. The σa and σ e estimated for FP by combined RRM was higher
than those estimated by two simple multiple-trait models and by single-trait RRM, mainly by the
22 ending of lactation (after 35 weeks). The variances estimated for PP by the different models were
approximately the same.
In all tested models, the residual variances (σe) were smaller for the combined RRM and
for the simple multiple-trait RRM when compared to single-trait RRM (Table 4).
Table 4. Posterior mean and 95% highest posterior density interval (LL: low limit and HL: high limit)for residual variance for milk yield, fat and protein percent from each assumed class (1-3,
4-8 and 9-40 weeks), using the combined multiple-trait (Ali_Leg5_Ali), multiple-trait based on fifth
order Legendre polynomials (Leg5_Leg5_Leg5), multiple-trait based on Ali and Schaeffer
function (Ali_Ali_Ali) and single-trait (Ali for MY and PP, and Leg5 for FP) random regression
models.
Model Classes Milk yield (MY) Fat percent (FP) Protein percent (PP)
Mean LL HL Mean LL HL Mean LL HL
Combined RRM
1-3 0.1603 0.1095 0.2124 0.5498 0.4373 0.6803 0.0889 0.0662 0.1117
4-8 0.3255 0.2641 0.3896 0.3977 0.3307 0.4897 0.0469 0.0380 0.0566
9-40 0.2016 0.1884 0.2151 0.3355 0.3138 0.3585 0.0555 0.0521 0.0590
Multiple by Leg5
1-3 0.1620 0.1110 0.2150 0.5492 0.4248 0.6736 0.0929 0.0708 0.1167
4-8 0.3240 0.2622 0.3880 0.3686 0.2955 0.4416 0.0507 0.0415 0.0604
9-40 0.2032 0.1902 0.2173 0.3662 0.343 0.3894 0.0539 0.0505 0.0575
Multiple by Ali
1-3 0.1620 0.1090 0.2150 0.6152 0.4912 0.7452 0.0890 0.0661 0.1118
4-8 0.3240 0.2607 0.3874 0.4126 0.3382 0.4888 0.0467 0.0372 0.0562
9-40 0.2032 0.1897 0.2167 0.3529 0.3296 0.3761 0.0556 0.0521 0.0591
Single-trait
1-3 0.1880 0.1294 0.2504 0.6861 0.5633 0.8147 0.0933 0.0718 0.1162
4-8 0.3250 0.2650 0.3891 0.4358 0.3630 0.5155 0.0474 0.0383 0.0566
9-40 0.2104 0.1967 0.2246 0.3711 0.3476 0.3964 0.0572 0.0536 0.0609
Figure 2 shows the change of the heritability and genetic correlation between the traits over
40 weeks in milk, estimated by the combined RRM. Estimates of heritability for MY and FP were
close until 20 weeks, and they ranged from 0.25 at 0.54. The estimates of heritability for PP were,
in general, higher than the estimates for MY and FP, ranging from 0.35 until 0.51. The genetic
correlation between MY and FP and between MY and PP throughout the lactation period were
negative, except for the period immediately after lactation peak. The genetic correlationbetween
23 Figure 2. Heritability (a) for milk yield (___), fat percent ( ) and protein percent (- - -), and
genetic correlation (b) between milk yield and fat percent ( ), milk yield and protein percent (
) and between fat and protein percent ( ) estimated by the combined multiple-trait random
regression model (Ali_Leg5_Ali).
How the animal model was used in this study, EBVs were available for kids, dams and
sires. However, individual goat EBVs are subject to systematic errors by management practices,
usually not accounted by statistical methods. Thus, main target for breeding organizations would
be estimate breeding values of sires for daughter yield and therefore it is of major interest to show
how sire rankings are also affected by the functions used in the RRM. The index selection is an
alternative to combining EBVs from different traits of the same animal in a unique value, making
that several useful traits can be selected simultaneously. EBVs originated in different RRM can be
highly different, what can change the index selection of the animal and consequently, change the
position of the animal in the ranking. Thus, index selection for sires that had more than 10 daughters
(total of 21 sires) were selected for comparison, in addition to comparison of index selection for
all animals in the pedigree.
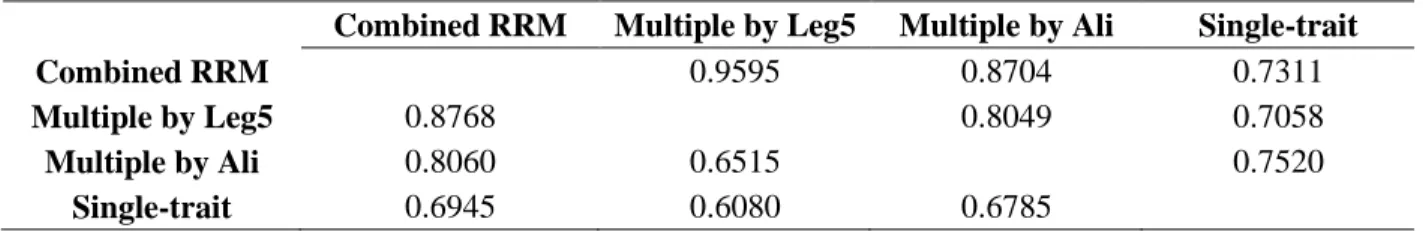
The standard deviations and range of the index selection are given for all animals and only
for sires, in Table 5. These statistics are shown for combined RRM, multiple-trait RRM based on
24 Table 5. Standard deviations and range of the index selection provided by combined multiple-trait (Ali_Leg5_Ali), multiple-trait based on fifth order Legendre polynomials (Leg5_Leg5_Leg5),
multiple-trait based on Ali and Schaeffer function (Ali_Ali_Ali) and from single-trait (Ali for MY
and PP, and Leg5 for FP) random regression model analyses, based on 1,061 animals in the
pedigree (All animals) or only on 21 sires with more than 10 daughters each (Only sires).
All animals Only sires Combined
RRM
Multiple by Leg5
Multiple by Ali
Single-trait
Combined RRM
Multiple by Leg5
Multiple by Ali
Single-trait
SD 0.6824 0.6725 0.6845 0.5574 0.8137 0.7749 0.8425 0.6135
Min -2.1328 -2.3329 -1.5891 -2.0735 -1.1035 -1.0470 -1.5891 -1.3460
Max 2.9569 3.2382 2.5411 2.0736 2.0770 2.2438 1.7458 0.6891
SD: Standard deviations; Min: Minimum; Max: Maximum.
In Table 6, the rankings are presented for the 2% best animals (All animals) and for the 21
sires with more than 10 daughters each (Only sires), based on index selection calculated according