Who is violent?: factors associated
with aggressive behaviors in
Latin America and Spain
Pamela Orpinas
1The main purpose of this paper was to evaluate the strength of the association between: 1) ag-gressive behaviors and 2) attitudes and self-efficacy for alternatives to violence, in different cities of the Region of the Americas and Spain. Results were based on a cross-sectional house-hold survey of a sample of the population aged 18 to 70 years. The survey was conducted in eight metropolitan areas of Latin America and Spain: Rio de Janeiro, Brazil; Salvador, Bahia, Brazil; Santiago, Chile; Cali, Colombia; San José, Costa Rica; San Salvador, El Salvador; Cara-cas, Venezuela; and Madrid, Spain. Each sample of approximately 1 200 respondents per city was stratified by clusters and was proportional in terms of socioeconomic position and popu-lation density. In all cities and for all targets of aggression studied, people who reported using aggression were less likely to feel confident that they could solve conflicts without violence, and they were more likely to hold attitudes supporting violence. Young persons were also more likely to commit aggression against all the targets. In addition, aggression toward nonfamily members was found most frequently among young men who reported binge drinking, who ei-ther carried a firearm or would have liked to carry one, or who perceived the police as ineffi-cient. Additional studies need to be done in each country to describe more specific attitudes as-sociated with aggression within each subculture. Future prevention programs should focus on modifying attitudes that support violence, increasing self-efficacy in solving problems without using violence, supporting the development of a police system that people can trust, regulat-ing firearms and access to alcohol, and raisregulat-ing people’s education levels.
ABSTRACT
In the Region of the Americas, vio-lence has been a source of concern among governmental and nongovern-mental organizations and other social sectors. In addition, in recent polls, residents of large cities have defined violence as a major source of worry. Violence is one of the greatest threats to public health and security, causing injury, disability, and numerous pre-mature deaths.
Only recently has the problem of violence been seen through the eyes of public health (1). Professionals in mul-tiple disciplines have turned to public health as a method to reduce and pre-vent violence. This public health ap-proach to solving health problems includes four steps: defining the prob-lem, identifying risk factors, develop-ing and evaluatdevelop-ing interventions in defined populations, and applying proven strategies to the whole com-munity (2). With its use of an epidemi-ologic model, public health assumes that the majority of violence does not occur by chance, that violence has causal factors that can be identified
and prevented, and that these factors can vary among different populations and places.
In Latin America, a serious limita-tion to developing intervenlimita-tions to prevent violence has been the lack of information to clearly define the prob-lem among different social groups and to identify risk factors associated with the acquisition, maintenance, and en-actment of violence. With the objective of identifying cultural risk factors as-sociated with violence that could be used to guide policies and develop prevention programs, the Pan Ameri-can Health Organization (PAHO) un-dertook the ACTIVA project (Estudio
1 University of Georgia, Department of Health
Multicéntrico sobre Actitudes y Nor-mas Culturales frente a la Violencia en Ciudades Seleccionadas de América Latina y España, or Multicenter Study: Cultural Norms and Attitudes Toward Violence in Selected Cities of Latin America and Spain). ACTIVA is a comparative study of cultural norms and attitudes associated with aggres-sive behaviors toward children, the partner, and persons outside the fam-ily, in different cities of the Region of the Americas and Spain.
Multiple risk factors are associated with violence. This paper focuses on attitudes and self-efficacy, two risk factors that can influence whether or not a person will choose to behave ag-gressively. Attitudes can be used as a proxy to measure cultural values. Cul-ture has been described as the milieu of attitudes and values that affects all choices (3). Comparisons across coun-tries will yield information to under-stand the relative importance of these risk factors. Measuring attitudes will give a better understanding of cultural support for aggression.
In this study, aggressive behaviors toward three targets were used as the dependent variable: aggression to-ward children in the form of corporal punishment, aggression toward the partner, and aggression toward non-family members. Aggression toward children by parents and caretakers in the form of corporal punishment is of special concern, due to its high preva-lence and its longlasting, deleterious effects. Corporal punishment is de-fined as the infliction of physical pain on a child or adolescent by a caretaker, with the purpose of modifying a be-havior that the caretaker perceives as undesirable. It includes such behav-iors as spanking, slapping, grabbing, shoving, or hitting with objects (4). About 80% of the parents in the United States of America spank their children (5), and a similarly high prevalence was found in Costa Rica (6).
The long-term consequences of cor-poral punishment are of concern. Abu-sive disciplinary methods of children are strong predictors of adolescent and adult violence (7) and of male delin-quency (8). Physical punishment
dur-ing childhood is a risk factor for de-pression, hopelessness, alcohol abuse, suicide, violence against peers, physi-cal abuse of one’s own children, and physical assaults on partners (5, 9, 10). In addition, corporal punishment does not correct antisocial behavior. In fact, longitudinal studies have shown that spanking increases the likelihood of antisocial behavior (11). PAHO has al-ready started a regional effort to re-duce corporal punishment (12).
Aggression toward the partner is the second dependent variable of this study. Of special concern is the vio-lence males commit against female partners. Cross-cultural research has shown that violence against women is an integral part of virtually all cultures. A review of 35 prevalence studies in industrial and developing countries showed that one-quarter to more than one-half of the women reported having been physically abused by a male part-ner. Although some studies were based on convenience samples, most were based on probability samples with large numbers of respondents (13). In a review of the literature in the United States, Plichta (14) found that the prev-alence of men abusing a female partner ranged between 10% and 35%, and that rates of severe abuse ranged between 6% and 11%. It is not possible to obtain one measure of prevalence of abuse. Studies that assess abuse may be indi-vidually valid but they are not directly comparable because they use different questions to evaluate abuse, have dif-ferent time frames, or use difdif-ferent methods to collect the data. For exam-ple, percentages of women reporting being physically abused can range widely: 4% and 6% using a mailed questionnaire (15), 7% using a self-reported questionnaire filled in at the clinic (16), and 26% using a personal interview (17). Finally, experts agree that violence against women is largely underreported.
Aggression toward nonfamily mem-bers is the third dependent variable of this study. In the United States, it was estimated that over 9 million people were assaulted in 1994. Strangers or casual acquaintances committed two-thirds of these assaults. Both victims
and perpetrators were more likely to be young males. Assaults were most frequent in urban areas and among people of low income (18).
The risk factors selected for this study were attitudes toward the envi-ronment, attitudes toward specific be-haviors, self-efficacy, carrying a fire-arm, binge drinking, and the three demographic variables of gender, age, and education. Attitudes are defined as a “relatively constant feeling, pre-disposition, or set of beliefs directed toward an object, person or situation” (19). Perceived self-efficacy is defined as “a judgement of one’s capabilities to accomplish a certain level of perfor-mance” (20, p. 391).
Identifying factors that predict or regulate aggression could provide guidance for intervention strategies and government policies. In the ACTIVA project, the selection of determinants of aggressive behaviors was based on social cognitive theory. According to this theory, factors in the environment where the person lives, personal fac-tors (e.g., attitudes, self-efficacy, etc.), and other behaviors associated with aggression influence and determine each other (20). The specific risk factors for violence can also be organized into three broad phases: 1) the acquisition phase, consisting of early predictors of aggression and factors associated with the learning process of aggression, 2) the maintenance phase, consisting of personal and environmental factors as-sociated with how aggression is main-tained over time, and 3) the perfor-mance phase, consisting of factors that instigate or facilitate aggression in the moment it is performed (21).
To understand the influence of the environment, it is important to differ-entiate between the real and perceived environment. The environment will influence people more strongly ac-cording to their perception of the en-vironment than according to its actual conditions (20). Thus, in this study, the environment was measured through individual attitudes toward aspects of the environment, which do not neces-sarily reflect the “real” environment.
environment provides the opportunity for violence to be observed and learned, both through the observation of real persons who behave aggressively and through the observation of models in the mass media (20, 22).
Developing aggressive behaviors is also influenced by cultural norms that accept and promote violence (23). An important aspect of these norms is the justification of illegal acts, under the assumption that aggressive people, or people who live in communities that accept aggression as a way to solve conflicts, will tend to justify illegality more than will persons who are less aggressive.
The environment also provides legal mechanisms to control and punish ag-gression. Several of the ACTIVA sur-vey questions evaluated the subjective perception of social institutions, which does not necessarily reflect the actual conditions of the institutions but how they are perceived and, therefore, how people will act toward them. The hy-pothesis to be evaluated is that people who trust the social institutions that control violence (such as the police) will be less likely to take justice into their own hands and, therefore, would be less aggressive. People who do not trust the police or the legal system would prefer personal vengeance rather than looking for a legal solution.
The environment also provides a wide range of rewards and punish-ments, as well as the availability of al-ternative means of securing goals, which influence whether or not people will behave aggressively under given circumstances. Social cognitive theory distinguishes three forms of reinforce-ment that control aggression: external reinforcement, vicarious or observed reinforcement, and self-reinforcement. People receive external reinforcement for their aggressive behaviors in a variety of ways. For example, thieves obtain money or possessions, aggres-sive persons may increase their status, and aggressors receive attention. By observing others, we learn what be-havior is rewarded, ignored, or pun-ished. Observed rewards increase the tendency to behave like the model, and observed punishments decrease this
tendency. The absence of anticipated punishment conveys permissiveness and reduces fear; thus, behavioral re-straints are reduced and aggressive ac-tions are performed more readily. Peo-ple also regulate their actions to some extent by self-produced consequences. People learn to evaluate their own be-havior partly on the basis of how oth-ers have reacted to it. Parents and other socialization agents describe norms of what is worthy and what is reprehen-sible. Parents give their children ap-proval when they meet moral stan-dards and reprimand them when they do not meet these standards. As a re-sult, children come to respond to their own actions with approval or self-criticism. Systems of self-reinforcement can also be transmitted through mod-eling (20, 21).
Finally, structural violence, an as-pect of the environment not directly addressed in this study, includes eco-nomic and social inequality, racism and other forms of discrimination, po-lice brutality, corruption of the legal system and government, violation of human rights, and unequal access to education and jobs (24).
Attitudes toward some specific be-haviors, as well as self-efficacy, are as-sociated with aggression. To increase their predictive power, both attitudes and self-efficacy should be measured specifically. Attitudes toward such spe-cific behaviors as insulting, hitting, or killing someone in a specific situation will be more strongly associated with behavior than more-general attitudes (25). For example, a specific attitude to-ward killing in a particular situation, such as “It is OK to kill the rapist of my daughter,” should be more predictive of behavior than a general attitude to-ward killing, such as “It is OK to kill.”
Several studies have shown that ag-gressive adolescents have stronger at-titudes and beliefs supporting violence as a way to solve conflicts and have less ability to solve conflicts in nonvio-lent ways than do nonaggressive ado-lescents (23, 26–29). Perry, Perry, and Rasmussen (30) found a significant dif-ference between aggressive and non-aggressive children in self-efficacy for aggression and for inhibition of
ag-gression. Aggressive children reported that it is easier to perform aggression and more difficult to inhibit aggressive impulses, and these children were also more confident that their aggression would produce tangible rewards.
While biological and genetic risk fac-tors are associated with aggression, they were not included in the ACTIVA project. These factors include attention deficit hyperactivity disorder, learning disabilities, poor motor-skill develop-ment, prenatal and perinatal complica-tions, minor physical anomalies, head injury, and parental criminality (31, 32). Violence is not an isolated event in people’s lives. Other behaviors, such as carrying a weapon, alcohol abuse, and negative arguments or verbal insults, are also risk factors for violence, since they facilitate the performance of ag-gressive behaviors. Two of these risk factors were included in this study, weapon carrying and binge drinking. Weapon carrying or having easy ac-cess to weapons is a strong predictor of violence (33–35). The primary basis for the extremely high death rate from firearms is the lethality of the weapons rather than the characteristics of the people who kill or are killed (36). Al-cohol and drugs are also a major risk factor for being the victim or the per-petrator of violence (37, 38). Weapon carrying, alcohol consumption, and ar-guments facilitate aggression. Argu-ments are the precipitating factor in one-third to one-half of all homicides, especially among teenagers and young adults (36, 39). Most homicides are committed with a firearm, occur dur-ing an argument, and occur among people who are acquainted with one another (40).
neigh-borhoods, and the risk of being the vic-tim of crime increases for people of low socioeconomic status (7, 18).
The main purpose of this paper was to evaluate the strength of the asso-ciation between: 1) attitudes and self-efficacy for alternatives to violence and 2) aggressive behaviors, in differ-ent cities of the Region of the Americas and Spain. Attitudes toward specific behaviors and attitudes toward the en-vironment were evaluated. Also eval-uated were the additional effects of two violence-related behaviors that can fa-cilitate aggression, carrying a firearm and binge drinking. The hypothesis to be evaluated is that people who have attitudes that support violence, who have low self-efficacy for alternatives to violence, who have drunk excessive amounts of alcohol, and who carry or would like to carry firearms will show higher levels of aggression.
METHODOLOGY
The ACTIVA project used a cross-sectional design to survey a sample of
the population between 18 and 70 years old living in the selected cities. The survey was administered face-to-face in the participant’s residence, in eight metropolitan areas of Latin America and Spain. Between July 1996 and March 1997, a representative sam-ple was selected in each city by socio-economic stratum, using a multistage sampling procedure. The sample was stratified by clusters and was propor-tional in terms of socioeconomic con-dition and population density. The sample size was estimated at 1 200 individuals per city. Individuals were selected in households by systematic sampling without substitution. Data were collected using the same ques-tionnaire in all eight cities.
The survey was administered to a sample of adults of eight cities: Sal-vador, Bahia, Brazil (n= 1 384); Rio de Janeiro, Brazil (n = 1 114); Santiago, Chile (n= 1 212); Cali, Colombia (n= 2 288); San José, Costa Rica (n= 1 131); San Salvador, El Salvador (n= 1 290); Caracas, Venezuela (n = 1 297); and Madrid, Spain (n = 1 105). The total sample for these eight cities was 10 821
persons. Due to differences in sam-pling methods, in two cities, Santiago and Cali, the sample had to be ad-justed for socioeconomic status and gender so that the sample would rep-resent the distribution of the popula-tion. The definitions of socioeconomic status by city, as well as a detailed description of the methodology, are discussed in detail elsewhere in this journal issue (45). In all cities, women were slightly overrepresented. A total of 4 736 men (43.8%) and 6 085 women (56.2%) were surveyed (Table 1). In most cities approximately 50% of the sample was obtained from areas de-fined as low socioeconomic status. Nonresponse rates were highest in the high socioeconomic stratum and low-est in the low stratum.
Working together, the principal in-vestigators of each of the cities devel-oped one common survey, with tech-nical support from the Pan American Health Organization and the World Health Organization Collaborating Center at the University of Texas-Houston. The final questionnaire in-cluded a wide range of
sociodemo-TABLE 1. Demographic characteristics of the sample by city, ACTIVA project, 1997
Salvador, Rio de San
Bahia, Cali, Caracas, Madrid, Janeiro, San José, Salvador, Santiago,
Brazil Colombia Venezuela Spain Brazil Costa Rica El Salvador Chile
(n= 1 384) (n= 2 288) (n= 1 297) (n= 1 105) (n= 1 114) (n= 1 131) (n= 1 290) (n= 1 212)
% % % % % % % %
Gender
Men 45.7 46.4 39.0 38.9 43.4 42.4 44.7 46.8
Women 54.3 53.6 61.0 61.1 56.6 57.6 55.3 53.2
Age
18–24 22.5 22.5 21.7 20.0 18.1 20.1 20.8 20.4
25–44 51.5 52.6 49.5 43.4 46.9 43.5 50.1 49.7
45–64 23.3 21.5 24.1 28.8 29.3 29.1 24.7 24.8
65–70 2.7 3.3 4.8 7.9 5.7 7.3 4.5 5.1
Socioeconomic status
High 8.2 9.9 2.3 19.8 14.5 13.6 12.6 13.9
Medium 36.6 41.5 24.2 59.8 27.2 51.0 35.4 28.8
Low 55.2 48.6 73.5 20.4 58.3 35.4 51.9 57.3
Education
Elementary or less 36.2 32.2 18.7 37.1 59.7 29.6 40.4 19.7
Secondary 44.8 53.4 42.3 32.7 21.7 34.3 32.7 51.4
College or technical 19.0 14.4 39.1 30.2 18.6 36.1 26.8 28.9
Living arrangement
No partner, no child 37.5 32.6 36.3 32.4 27.4 30.2 26.3 28.5
Lives with partner, no child 18.1 19.8 20.4 27.5 24.0 24.6 19.2 22.0
Lives with child, no partner 14.0 11.4 11.3 11.7 10.1 11.9 11.6 7.0
graphic characteristics of the inter-viewees and their families, prevalence of aggressive behaviors and of other violence-related behaviors, personal attitudes toward aggressive behaviors, self-efficacy for alternatives to vio-lence, perception of the government and other social institutions, and vic-timization both in the family and in the community.
The three dependent variables of this study were physical aggression against nonfamily members, against the partner, and against one’s chil-dren. Three questions measuring dif-ferent levels of aggression were used to evaluate the frequency of aggressive behaviors against each of these target groups. Aggression against nonfamily members was measured by the follow-ing three items: insulted in connection with some problem, threatened to se-riously harm, and assaulted or hit a nonfamily member. Aggression against the partner was measured by the fol-lowing three items: shouted in anger, struck or slapped, and struck with an object that could have hurt the partner. Aggression against children was mea-sured by the following three items: shouted at the child, spanked the child, and hit the child somewhere on the body other than the buttocks with an object such as a strap or a stick. The time frame for aggression against non-family members and the partner was the prior year, and possible responses ranged from 0 to 6 or more times. The time frame for aggression against chil-dren was the prior month and possible responses were “never,” “less than 4 times in the month,” “1–2 times per week,” and “3 or more times per week.” The questions of corporal pun-ishment were limited to children from 2 to 15 years of age, and included par-ents and other caretakers. Questions were based on Straus’s Conflict Tactics Scales (46).
To evaluate attitudes and self-effi-cacy, seven scales were created. All scales were composed of summated items divided by the total number of items, with possible scores ranging from 1 to 5. Higher scores represented a stronger support for aggression and lower self-efficacy for alternatives to
violence. The specific items of each scale and the internal consistency of the scores, measured by Cronbach’s alpha, are presented in Table 2. While the items were developed specifically for the ACTIVA project, many of them were based on previous national sur-veys, polls, and research studies (45).
Five scales and one item measured attitudes toward these specific behav-iors: killing others, slapping the part-ner, hitting the partner because of un-faithfulness (or hitting a woman who is “stealing the husband”), having a firearm to increase security, accepting some illegal behaviors, and corporal punishment as being necessary to bring up children properly (five scales shown in Table 2).
One scale and four items measured attitudes toward the environment. The scale was a measure of social in-tolerance, that is, whether neighbor-hoods should be composed of persons of similar social class, religion, ethnic group, and political ideas (Table 2). One of the items evaluated respon-dents’ perception of the efficiency of the police, on a 5-point Likert-type scale ranging between “very good” and “very bad.” The second item eval-uated perceptions of democracy. Re-spondents chose among three alterna-tives: “democracy is the best political system under any circumstances,” “in certain circumstances a dictatorship could be good,” and “whether we live in a democracy or in a dictatorship makes no difference to people like me.” The third item was a question measuring beliefs about how condi-tions in the country would be in the next five years. Possible alternatives were “better off than now,” “as well off as now,” and “worse off than now.” The final question measured their perception of current conditions in the country. Possible alternatives were “the social system should be kept as it is,” “some reforms should be made,” and “the system should be to-tally changed.”
Self-efficacy for alternatives to vio-lence was measured by one scale, which combined three items: “when there is a problem, I know how to con-trol my temper and stay out of fights,”
“if I have a serious conflict or disagree-ment with my partner, I can explain my reasons without getting upset,” and “if I need to correct a child, I know how to talk or reason with them and explain why some of the things that they do are wrong.” All items were measured on a 5-point Likert-type scale ranging from “always” to “never.” The scale was composed of summated items divided by the total number of items, with possible scores ranging from 1 to 5. Higher scores rep-resented a lower self-efficacy for alter-natives to violence.
Binge drinking was measured by one question from the U.S. Centers for Disease Control and Prevention’s Be-havioral Risk Factor Surveillance Sys-tem (47). The question measures the frequency of drinking five or more alcoholic beverages on one occasion during the month prior to the survey. Responses could range from 0 to 10 or more times.
Firearm carrying was measured by several questions that were organized into three categories: does not have or want to have a firearm, does not have a firearm but would like to have one, and has a firearm for sport, profession, or personal protection.
Finally, three demographic vari-ables were included in the model: gender, age, and education. Age was measured as a continuous variable. Education was organized into three levels: elementary education or less, high school education (complete or in-complete), and some college or techni-cal education.
depending on the analyses. Approxi-mately one-third of the sample respon-dents reported both taking care of a child and having a partner, and an-other third reported not having a part-ner or a child (Table 1).
The prevalence of physically aggres-sive behaviors was described by type of physical aggression, target of the aggression, and city. In addition,
fre-quency of aggressive behaviors was described by demographic characteris-tics of the sample, binge drinking, firearm carrying, perceived efficiency of the police, support for democracy, perception of the future of the country, and whether a person would like to change the social system. Chi-square was computed to evaluate bivariate association between categorical
vari-ables. In addition, on all seven scales, analysis of variance was used to com-pare mean scores of those who hit someone versus those who did not hit, as well as support for corporal punish-ment. Frequencies and means were de-scribed by target of the aggression and by city.
Finally, the predictive power of the model was examined using linear
re-TABLE 2. Scale items and reliability coefficients by city, ACTIVA project, 1997
Salvador, Bahia, Cali, Caracas, Madrid, Rio de Janeiro, San José, San Salvador, Santiago,
Brazil Colombia Venezuela Spain Brazil Costa Rica El Salvador Chile
(n= 1 384) (n= 2 288) (n= 1 297) (n= 1 105) (n= 1 114) (n= 1 131) (n= 1 290) (n= 1 212)
Scales and items alphaa alpha alpha alpha alpha alpha alpha alpha
Attitudes
Killing others 0.72 0.64 0.64 0.68 0.70 0.68 0.66 0.70
OK to kill rapist of child
OK to kill threat to community NA
Right to kill to defend family Right to kill to defend property
Slapping the partner 0.70 — 0.72 0.89 0.76 0.67 0.70 0.77
Sometimes is justified: men slap wife Sometimes is justified: women slap
husband NA
Hitting because of unfaithfulness 0.59 0.68 0.16 0.67 0.59 0.63 0.56 0.70
Unfaithful woman: deserves to be beaten OK to hit woman who is stealing husband
Carrying weapons 0.73 0.83 0.85 0.75 0.65 0.86 0.81 0.77
Gun in home makes home safer Gun makes the person safer
Illegal behavior 0.42 0.57 0.44 0.56 0.40 0.57 0.55 0.50
OK to take law in your own hands Police has the right to enter a home
without a warrantb
Police can detain young because of appearance
Police can torture suspects to obtain information
Street children should be put in jail NA
Social intolerance 0.73 0.78 0.75 0.90 0.75 0.77 0.83 0.68
Neighborhoods should be of the same social class
Neighborhoods should be of the same religion
Neighborhoods should be of the same ethnic group
Neighborhoods should be of the same political ideas
Self-efficacy
Alternatives to violence 0.56 0.60 0.49 0.38 0.52 0.63 0.56 0.60
Knows how to control temper and stay out of fights
Conflict with partner: can explain reasons calmly
Problem with child: knows how to talk or reason
NA = Not available, item was not included in the survey.
aCronbach’s alpha.
gression. All analyses were done sep-arately for each city and for each tar-get of aggressive behavior. Variables were entered in three blocks. The first block was composed of attitudes to-ward the behaviors, attitudes toto-ward the environment, and self-efficacy. The item evaluating democracy was dichotomized into “democracy is the best system” (lower value) versus all others. The item evaluating the cur-rent conditions of the country was di-chotomized into “the system should be totally changed” (higher value) versus all others. In the second block, binge drinking and firearm carrying were added. Binge drinking was re-coded so that codes would reflect the mid points of the range of the possible response (e.g., “never” was coded as “0,” “1 to 2 times” was coded as “1.5,” etc.). Two dummy variables were cre-ated for firearm carrying: “carried a firearm” versus all other and “would like to carry a firearm” versus all other. The default was “does not have a firearm nor would like to have one.” In the third block, the demographic variables were added. The final stan-dardized beta weights were described for each city, allowing comparison of the relative importance of each vari-able for each city. The percentage of the variance explained for each addi-tional block was also described.
For the dependent variables of the regression analyses, base 10 logarith-mic scales were developed to reduce the skewness of the distributions. Three scales were computed, one for each target of violence (partner, child, nonfamily member). The scales ac-counted for both the frequency of the aggression and the relative serious-ness of the three different aggressive acts. The logarithmic scales were com-puted by taking the log of the sum of the weighted items. To account for the seriousness of the acts, items were weighted by the inverse of their rela-tive frequency. The relarela-tive frequency was calculated by city, giving the same weight to each gender. To avoid ex-treme values, the median of the eight cities was used as the weight. All analyses were done using SPSS-PC software (SPSS Inc., Chicago, IL).
RESULTS
Aggressive behaviors across different targets and behavioral contexts
The association between aggression against the partner and aggression against a nonfamily member was strong. On average among all the eight cities, hitting a nonfamily member in-creased the odds of hitting the partner by 7.2 times (range among cities: 2.7 to 14.8). In six of the eight cities, the asso-ciation between aggression against the partner and aggression against a child was also strong. On average, hitting the partner increased the odds of hit-ting a child by 3.5 times (range among cities: 1.5 to 9.3). The association be-tween hitting the child and hitting a nonfamily member was weaker and statistically nonsignificant for all cities except Rio de Janeiro. All associations were stronger in Rio de Janeiro than in any other city. These results are based on a small sample, since the overall prevalence of having hit two or more persons (child, partner, nonfamily member) was low, less than 5% in half of the cities (Table 3).
Within each target group, aggres-sive behaviors were organized in a clear hierarchy of violence. Highly ag-gressive behaviors were less frequent than less aggressive behaviors, e.g., physical aggression was less frequent than verbal aggression. Those who re-ported the strongest form of aggres-sion (hitting with an object) also re-ported the other forms of aggression, but not all who reported verbal ag-gression reported physical agag-gression. Fewer than 2% of the sample respon-dents reported they never insulted a nonfamily member but did threaten to hit one (range among cities: 0.9% to 2.7%) or that they did hit a stranger but never threatened one (range among cities: 0.9% to 3.7%). Fewer than 1% of the respondents reported they never shouted at the partner but did slap that person (range among cities: 0.1% to 0.9%) or that they did hit the partner but never slapped him or her (range among cities: 0.3% to 3.4%). Fewer than 5% of the sample reported that they
never shouted at a child but did spank the child (range among cities: 1.2% to 7.3%), and approximately 2% of the sample hit the child with an object but did not spank him or her (range among cities: 0.4% to 4.3%).
Physical aggression against nonfamily members
On average, 6.5% of the men and 2.8% of the women hit a nonfamily member during the year prior to the study. The prevalence of hitting a non-family member was higher for men than women in all cities, but this dif-ference did not achieve statistical sig-nificance in Rio de Janeiro or in Santi-ago (Table 3). Among those who did hit a nonfamily member, the mean number of times they hit did not vary significantly by the gender of the hit-ter. The highest reported prevalence of hitting nonfamily members was ob-served among men in Caracas, Cali, and Salvador.
As expected, physical aggression against nonfamily members was sig-nificantly higher among younger than older adults in all cities. The age group between 18 and 24 years old made up 21% of the total sample and accounted for 42% of the hitting of nonfamily members.
The relationship between educa-tional level and aggression was con-founded by age, since those with the lowest education (elementary educa-tion or less) were significantly older than those more educated. Among the youngest group (18–24 years old), prevalence of physical aggression to-ward nonfamily members was higher among those with low education than those with high education in Salvador, Cali, Caracas, and Madrid, but this dif-ference achieved statistical signifi-cance only in Madrid. Among those 25 and older, aggression toward nonfam-ily members was not associated with educational level.
was higher among those who had or wanted to have a firearm, perceived the efficiency of the police as “very bad” or “bad,” and preferred dictator-ship over democracy. Not all differ-ences were statistically significant.
In most cities, respondents who re-ported hitting a nonfamily member were more likely to hold attitudes that support violence and to have low self-efficacy for alternatives to violence. Cities where men expressed the strongest support for taking the law into their own hands also had the highest prevalence of hitting a non-family member (Pearson’s r = 0.55) and the strongest perception that the police were inefficient (Pearson’s r = 0.77). No association was found among the women surveyed.
In the regression model, the vari-ance explained by attitudes and self-efficacy ranged from a low of 7% in Santiago to a high of 19% in Salvador and Cali. The overall model explained
an average of 19% of the total variance (range among cities: 13% to 28%). The variables with a stronger association with aggression toward a nonfamily member in all cities were lack of self-efficacy for alternatives to violence, frequency of binge drinking, being young and male, and holding an atti-tude that killing others was acceptable. In all cities, the lack of self-efficacy was one of the variables most strongly as-sociated with aggression. The addition of behavioral and demographic vari-ables doubled the predictive power of the model in Caracas, Rio de Janeiro, San José, and Santiago, and tripled it in Madrid.
Physical aggression against the partner
On average, 3.8% of the sample re-ported slapping their partner (but not hitting with an object) and 2.4% had
hit their partner with an object during the year prior to the study. Most of those who hit with an object also slapped their partner. No statistically significant differences were observed by gender, except in Santiago, where women reported more frequently than men that they slapped or hit their male partners (Table 3). Among those who did hit their partner, the mean number of times women hit was significantly higher than for men in only one city, Salvador. The prevalence of partner battering was highest in Cali and Sal-vador, for both men and women.
Physical aggression toward the part-ner was more common among younger than older adults. Persons between 18 and 24 years old who had a partner ac-counted for 8% of the total sample but reported 19% of partner battering.
Physical aggression toward the part-ner was higher among respondents who reported binge drinking one or more times during the month prior to
TABLE 3. Prevalence of physically aggressive behaviors by type, gender, target of violence, and city, ACTIVA project, 1997
Salvador, Rio de San
Bahia, Cali, Caracas, Madrid, Janeiro, San José, Salvador, Santiago,
Brazil Colombia Venezuela Spain Brazil Costa Rica El Salvador Chile
% % % % % % % %
Hit nonfamily member
Men 7.4a 9.6b 11.1b 5.8b 3.3 5.9b 5.6c 3.4
Women 4.0 5.1 2.3 2.1 1.9 1.2 3.1 2.5
Total 5.6 7.2 5.7 3.5 2.5 3.2 4.2 2.9
Hit partner
Men—total 10.0 9.0 5.3 3.1 5.0 3.7 7.1 3.6a
Slapped only 6.9 1.8 4.9 3.1 2.8 2.9 5.1 3.3
Hit w/object 3.2 7.1 0.4 0.0 2.2 0.7 2.0 0.3
Women—total 10.2 10.7 5.7 2.1 5.4 3.2 7.4 8.4
Slapped only 5.0 4.6 3.0 2.1 4.9 2.1 3.4 5.0
Hit w/object 5.3 6.1 2.8 0.0 0.5 1.1 3.9 3.4
Total 10.1 9.9 5.6 2.4 5.2 3.4 7.2 6.1
Hit children
Men—total 34.5 27.4b 11.3b 24.8 12.8b 15.7a 25.7b 12.3b
Spanked only 26.6 14.0 6.5 22.0 11.9 12.4 16.1 10.2
Hit w/object 7.9 13.3 4.8 2.6 0.9 3.4 9.6 2.1
Women—total 39.1 49.8 34.5 29.8 39.8 25.5 37.5 27.0
Spanked only 27.3 22.9 19.8 26.9 33.8 18.5 22.1 22.8
Hit w/object 11.8 26.9 14.7 2.9 6.0 7.1 15.4 4.4
Total 37.4 40.6 27.5 28.3 28.4 22.1 32.8 21.2
Hit 2–3 groupsd
Men 9.4 7.7 1.5 0.0 4.2 0.7 6.3 0.0b
Women 8.3 11.1 4.7 2.2 6.5 1.4 5.4 7.0
aP< 0.01.
bP< 0.001 (significant difference between men and women for total hitting). cP< 0.05.
the survey. Physical aggression was also higher among respondents who wanted to have a firearm than among those who did not have a firearm. In most cities, the association between at-titudes toward the environment and reported aggression was nonsignifi-cant. However, in most cities, respon-dents who reported hitting the partner were significantly more likely to hold attitudes that support violence against the partner and to have low self-effi-cacy for alternatives to violence than respondents who did not hit their partner.
In the regression model, the vari-ance explained by attitudes and self-efficacy ranged from 6% in San Sal-vador to 16% in Rio de Janeiro and Santiago. These same cities had the lowest and the highest percentage of variance explained by the overall model, respectively. The overall model explained an average of 15% of the total variance (range among cities: 8% to 21%). The variables with a stronger association with aggression toward the partner in all cities were lack of self-efficacy for alternatives to vio-lence, being young, and holding an at-titude that slapping or hitting the part-ner was acceptable. In all cities, the lack of self-efficacy was one of the variables most strongly associated with aggression. The addition of be-havioral variables that facilitate ag-gression did not improve the model significantly, except for Cali, where binge drinking and wanting to have a firearm improved the model by 36%. In Caracas, Madrid, Rio de Janeiro, and Santiago the addition of demo-graphic variables improved the model by a third.
Physical aggression against children
The prevalence of corporal punish-ment to discipline children was high. Among men, on average, 15% had spanked a child (but did not hit with an object), and 6% had hit a child with an object during the month prior to the survey. Among women, on average, 24% had spanked a child (but did not hit with an object) and 11% had hit a
child with an object during the month prior to the survey. Most of those who hit with an object also spanked their children. No significant differences in corporal punishment were observed by gender except in Salvador and Madrid. In the six other cities, women were more likely than men to use cor-poral punishment with their children (Table 3). Both among men and women, the highest frequency of re-ported corporal punishment was among those who did not work out-side the home. Among respondents who did hit their children, the mean number of times they hit was signifi-cantly higher among women than men in Cali, San José, and San Salvador. Although both men and women re-ported hitting boys more frequently than girls, this difference did not achieve statistical significance in any city. The overall prevalence of corpo-ral punishment was over 30% in Cali, Salvador, and San Salvador. Corporal punishment, however, did vary greatly by the age of the child. In all cities, children 2 to 7 years of age were those most frequently hit by their caretakers, with an average prevalence of 40%. The highest peak was at ages 3 to 5. The prevalence slowly declined as the child got older, being less than 20%
among those aged 13–14 and less than 5% for those aged 15.
Physical aggression against children was more common among younger than older adults but the age differ-ence was not statistically significant in three cities. The age group between 18 and 24 years old who took care of a child accounted for 11% of the total sample and reported doing 13% of the corporal punishment. The age group between 25 and 44 years old who took care of a child made up 66% of the total sample and reported performing 72% of corporal punishment.
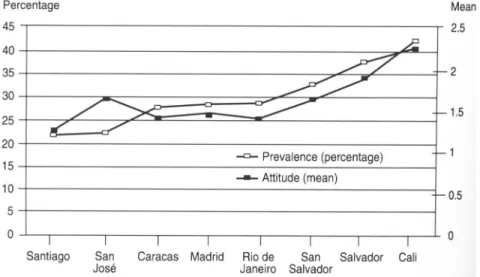
In most cities, respondents who re-ported hitting a child were signifi-cantly more likely to hold attitudes supporting corporal punishment and to have low self-efficacy for alterna-tives to violence than respondents who did not hit their children. Across cities, the mean support for corporal punish-ment was strongly associated with the prevalence of corporal punishment it-self (Pearson’s r= 0.83) (Figure 1).
In the regression model, the variance explained by attitudes and self-efficacy ranged from a low of 7% in Caracas to a high of 21% in Santiago. For most cities, the variance explained was about 9%. The overall model explained an average of 18% of the total variance
FIGURE 1. Prevalence of hitting childrenaand attitudes toward corporal punishment,bby city, ACTIVA project, 1997
aPrevalence of hitting children during the month preceding the survey.
(range among cities: 12% to 25%). The variables with a stronger association with aggression toward children in most cities were being young and fe-male, having limited education, taking care of young children, lacking self-efficacy for alternatives to violence, and holding an attitude that corporal punishment was necessary. The addi-tion of behavioral variables that facili-tate aggression did not improve the model. The demographic variables, however, did increase the predictive power of the model. In Cali, Caracas, Rio de Janeiro, San José, and San Sal-vador, the addition of demographic variables doubled the percentage of variance explained by the model.
A final question that needs to be ad-dressed concerns the characteristics of the people who reported hitting some-one in more than some-one group. Given the small sample size of this group and its uneven distribution across cities, the data should be analyzed with caution. Thus, only some trends are reported. In comparison to those who reported hit-ting only one target, persons who reported hitting two or more groups were younger, less educated, more likely to be inebriated, had stronger at-titudes toward specific behaviors porting violence, showed a higher sup-port for dictatorship, and had less self-efficacy for alternatives to violence.
DISCUSSION
In all cities, lack of self-efficacy for alternatives to violence was strongly associated with all forms of violence, that is, people who reported using ag-gression were less likely to feel confi-dent that they could solve conflicts without violence. In addition and as expected, some attitudes toward spe-cific behaviors were also associated with aggression. For example, the atti-tude that corporal punishment was necessary to rear a child was associ-ated with aggression toward the child, and attitudes that supported slapping the spouse were associated with ag-gression toward the partner.
The overall model explained one-fifth of the variance of aggression
to-ward nonfamily members and some-what less variance of aggression to-ward the family. Given that violence is determined by multiple factors and that this model evaluated only certain psychosocial components, the percent-age of variance explained is good. In addition, the model supports a “dose effect,” that is, those who aggress harder, more frequently, or to more than one target were more likely to hold stronger attitudes supporting violence and to have less self-efficacy to solve conflicts.
It is important to acknowledge some of the limitations of the study. First, the cross-sectional nature of the study does not allow for establishing a causative relationship between at-titudes, self-efficacy, and aggressive behaviors. Second, additional limita-tions arise from the household inter-view methodology employed in this study, which may have increased so-cially desirable responses. Thus, the prevalence of aggressive behaviors and attitudes that support violence may be underreported. The preva-lence found may also be lower than actual levels since the most violent or prejudiced persons may be the least likely to participate in this type of sur-vey. Finally, this study only looked at some determinants of aggression. These results should be viewed in combination with other studies that address aspects of violence not ad-dressed by the ACTIVA project, such as structural violence.
Aggressive behaviors were clearly ordered in a continuum that ranged from verbal aggression to hitting with an object. A large number of people re-ported verbal aggression, while fewer reported physical aggression. Those who did aggress physically also re-ported using milder forms of aggres-sion. This result is consistent with other research that indicates a hierar-chical progression of aggressive be-haviors, in which an individual, over time, can progress from mild to seri-ous forms of aggression (48). The con-cept of early prevention is supported not only by this continuum of aggres-sive behaviors but also by the growing evidence that verbal aggression can
have permanent negative psychologi-cal consequences (49).
The prevalence of violence varied greatly by city. The prevalence of all forms of violence was highest in Cali, Salvador, and San Salvador, and was lowest in Madrid, Santiago, San José, and Rio de Janeiro. Caracas had a high prevalence of violence against non-family members by men, while vio-lence against the family was lower. The cities with the highest reported frequency of violence also had the highest homicide rates. For example in 1996, the homicide rate for Cali was 102 per 100 000 and for San Salvador was 140 per 100 000, while the homi-cide rate for Santiago was only 6 per 100 000 and for Madrid was 2.2 per 100 000. The results from Rio de Janeiro are surprising. This city has a high homicide rate (80 per 100 000), while the reported frequency of hitting non-family members was the lowest of all cities. This result needs further investigation. One hypothesis is that homicides in the city are concentrated among a small group of people in-volved in drug trafficking and other forms of delinquency, rather than the less-aggressive general population.
implica-tions for control of firearms derive from these results. Countries should have strict laws that limit the access to and the availability of guns. Results also indicate the need to evaluate the effect of policies and community edu-cation to reduce and control the con-sumption of alcohol, especially among young people.
The perception of poor police effi-ciency was associated with aggression against nonfamily members in four cities: Salvador, Cali, Rio de Janeiro, and San Salvador. All of them except Rio de Janeiro also had a high preva-lence of reported viopreva-lence. Cities with the highest prevalence of male aggres-sion toward nonfamily members also showed the strongest support for people taking the law into their own hands and the strongest perception that the police system was inefficient. This association was not found among women, possibly because women are less likely to hit nonfamily members or to take the law into their own hands. When people do not trust the police system or perceive that the police will not protect them, they may be more likely to take justice into their own hands. The trust in the police system was not related to family violence. Rather than a criminal act, family vio-lence is still considered by many a pri-vate matter that must be resolved with-out the help of the police. Thus, the police might not be perceived as having an important influence on whether or not violence is committed in the family. The prevalence of violence against women by their male partner and vio-lence against men by their female part-ner was remarkably similar. Similar results have been found in large prev-alence studies in the United States (50). On average, 6% of the ACTIVA re-spondents reported having hit their partner at least once during the year prior to the survey. Although lower than in the United States (50), this esti-mated prevalence leaves little doubt about the high frequency of violence that both men and women commit
against the partner. The fact that women are so violent within the fam-ily is inconsistent with the low rate of assaults by women outside of the family. Thus, the meaning and conse-quences of woman-to-man violence must be understood in the context of the relationship. Given that on average men are bigger and stronger than women and, in general, more aggres-sive, the same act (e.g., hitting with an object) is more likely to inflict pain and more likely to result in injury when it is inflicted by a man. Many of the assaults by women against a partner may be acts of retaliation or self-defense. Supporting this is the fact that women are at higher risk of being killed by their partner than by a stranger (51). In all eight of the cities, physical aggression against the part-ner was associated with being young, having low self-efficacy for alterna-tives to violence, and holding attitudes that support violence. Thus, a possible avenue for prevention is to modify so-cial norms that support violence and to increase skills for alternatives to vio-lence. Future research should include questions about injury due to family violence to assess the seriousness of the problem, as well as questions about the context of the conflict.
Of special concern is the high preva-lence of corporal punishment, espe-cially hitting children with an object, which could be considered a form of child abuse. The highest prevalence was in Cali, where over one-fourth of the women reported hitting children with an object. Hitting children with an object was also high in Salvador, San Salvador, and Caracas, the same cities with high violence against non-family members and with high homi-cide rates. Since violence against chil-dren perpetuates the cycle of violence and may increase antisocial behavior (49), reducing corporal punishment may be an important avenue for vio-lence prevention.
Corporal punishment was most common among young, uneducated
women who held attitudes that corpo-ral punishment was a way to disci-pline children and who had low self-efficacy to solve conflicts without violence. Interestingly, cities with the highest prevalence of aggression to-ward children also had the strongest attitudes supporting corporal punish-ment. Using corporal punishment to discipline children was most common among those who did housework, that is, did not work outside the home. Since 37% of the women and fewer than 2% of the men reported doing housework, the most likely explana-tion for women reporting using corpo-ral punishment more frequently than men is simply that women are more likely to spend more time with their children at home. Although women reported hitting their children more frequently than men, the reported prevalence of men hitting children was still high. In addition, men may be more likely to hit their children harder than women. Thus, both men and women should be the focus of pre-vention programs that increase self-efficacy for disciplining children with-out the use of corporal punishment and that reduce attitudes that support corporal punishment. The high preva-lence of corporal punishment among parents of young children gives some indication of the type of skills that caretakers lack for raising children.
1. Koop CE, Lundberg GD. Violence in America: a public health emergency. JAMA 1992 Jun 10;267(22):3075–3076.
2. Mercy JA, Rosenberg ML, Powell KE, Broome CV, Roper WL. Public health policy for pre-venting violence. Health Aff (Millwood) 1993 Winter;12(4):7–29.
3. Kreps GL, Kunimoto EN. Effective communi-cation in multi-cultural health care settings. Thousand Oaks, CA: Sage; 1994.
4. Straus MA. Discipline and deviance: physical punishment of children and violence and other crime in adulthood. Social Problems 1991;38:133–153.
5. Murray B. Judges, courts get tough on spank-ing. A.P.A. Monitor 1996;27(11):10. 6. Krugman S, Mata L, Krugman R. Sexual
abuse and corporal punishment during child-hood: a pilot retrospective survey of univer-sity students in Costa Rica. Pediatrics 1992; 90:157–161.
7. Farrington DP. Early predictors of adolescent aggression and adult violence. Violence and Victims 1989;4:79–100.
8. Loeber R, Dishion TJ. Early predictors of male delinquency: a review. Psychol Bull 1983;94: 68–99.
9. Straus MA. Beating the devil out of them: cor-poral punishment in American families. New York: Cambridge University Press; 1994. 10. Straus MA. Spanking and the making of a
vio-lent society. Pediatrics 1997;98:837–841. 11. Straus MA, Sugarman DB, Giles-Sims J.
Spanking by parents and subsequent anti-social behavior of children. Arch Pediatr Ado-lescent Med 1997;151:761–767.
12. Levav I, Guerrero R, Phebo L, et al. A regional effort to reduce corporal punishment in chil-dren: the promotion of a community program through primary care. Washington, D.C.: Pan American Health Organization/World Health Organization; 1995. (Document PAHO/WHO/ HPP/45.95).
13. Heise LL, Pitanguy J, Germain A. Violence against women: the hidden health burden. Washington, D.C.: World Bank; 1994. (World Bank Discussion Paper No. 255).
14. Plichta S. The effects of woman abuse on health care utilization and health status: a lit-erature review. Womens Health Issues 1992 Fall;2(3):154–163.
15. Physical violence during the 12 months pre-ceding childbirth—Alaska, Maine, Oklahoma, and West Virginia, 1990–1991. MMWR Morb Mortal Wkly Rep 1994 Mar 4;43(8):132–137. 16. McFarlane J, Christoffel K, Miller V, Bullock
L. Assessing for abuse: self-report versus nurse interview. Public Health Nurs 1991 Dec;8(4):245–250.
17. McFarlane J, Parker B, Soeken K, Bullock L. Assessing abuse during pregnancy: severity and frequency of injuries and associated entry into prenatal care. JAMA 1992;267:3176–3178. 18. Maguire K, Pastore AL. Sourcebook of crimi-nal justice statistics, 1996. Washington, D.C.: U.S. Department of Justice; 1997. (Bureau of
Justice Statistics Overview Report NCJ-165361).
19. Green LW, Kreuter MW. Health promotion planning: an educational and environmental approach. 2nd ed. Mountain View, CA: May-field Publishing Company; 1991. p. 429. 20. Bandura A. Social foundations of thought and
action: a social cognitive theory. Englewood Cliffs, NJ: Prentice-Hall; 1986.
21. Bandura A. Aggression: a social learning analysis. Englewood Cliffs, NJ: Prentice-Hall; 1973.
22. Donnerstein E, Slaby RG, Eron LD. The mass media and youth aggression. In: Eron LD, Gentry JH, Schlegel P, eds. Reasons to hope: a psychosocial perspective on violence and youth. Washington, D.C.: American Psycho-logical Association; 1996. p. 219–250. 23. Nisbett RE. Violence and U.S. regional
cul-ture. Am Psychol 1993;48:441–449.
24. Chassin BH. Inequality and violence in the United States: casualties of capitalism. New Brunswick, NJ: Humanities Press; 1997. 25. Aronson E, Wilson TD, Akert RM. Social
psy-chology: the heart and the mind. New York: HarperCollins College Publishers; 1994. 26. Boldizar JP, Perry DG, Perry LC. Outcome
values and aggression. Child Development 1989;60:571–579.
27. Guerra NG, Slaby RG. Evaluative factors in social problem solving by aggressive boys. J Abnormal Child Psychol 1989;17:277–289. 28. Slaby RG, Guerra NG. Cognitive mediators
of aggression in adolescent offenders: 1. as-sessment. Developmental Psychol 1988;24: 580–588.
29. Neel RS, Jenkins ZN, Meadows N. Social problem-solving behaviors and aggression in young children: a descriptive observa-tional study. Behavioral Disorders 1990;16: 39–51.
30. Perry DG, Perry LC, Rasmussen P. Cognitive social learning mediators of aggression. Child Dev 1986 Jun;57(3):700–711.
31. Buka S, Earls F. Early determinants of delin-quency and violence. Health Affairs 1993;12: 46–64.
32. DiLalla LF, Gottesman II. Biological and ge-netic contributors to violence—Widom’s un-told tale. Psychol Bull 1991;109:435–442. 33. Webster DW, Gainer PS, Champion HR.
Wea-pon carrying among inner-city junior high school students: defensive behavior vs. ag-gressive delinquency. Am J Public Health 1993 Nov;83(11):1604–1608.
34. Callahan CM, Rivara FP. Urban high school youth and handguns. JAMA 1992;267:3038– 3042.
35. Saltzman LE, Mercy JA, O’Carroll PW, Rosen-berg ML, Rhodes PH. Weapon involvement and injury outcomes in family and intimate assaults. JAMA 1992;267:3043–3047. 36. Rice DP, MacKenzie EJ, and Associates. Cost
of injury in the United States: a report to Con-gress. San Francisco, CA: Institute for Age and Aging of the University of California, and
In-jury Prevention Center, The Johns Hopkins University; 1989.
37. Kingery PM, Pruitt BE, Hurley RS. Violence and illegal drug use among adolescents: evi-dence from the U.S. National Adolescent Stu-dent Health Survey. Int J Addictions 1992; 27:1445–1464.
38. U.S. Department of Justice. Drugs and crime facts, 1991. Rockville, MD: Drugs & Crime Data Center & Clearinghouse; 1992. (Publica-tion NCJ-134371.)
39. Centers for Disease Control. Homicide— United States. MMWR Morb Mortal Wkly Rep 1982 Nov 12;31(44):594, 600–602. 40. American Medical Association. Healthy
Youth 2000: national health promotion and disease prevention objectives for adolescents. Chicago, IL: AMA, Department of Adolescent Health; 1990.
41. National Center for Health Statistics. Report of final mortality statistics, 1995. Monthly Vital Stat Rep 1997;45:1–80.
42. U.S. Centers for Disease Control and Preven-tion. Weapon-carrying among high school students—United States, 1990. MMWR Morb Mortal Wkly Rep 1991 Oct 11;40(40):681–684. 43. U.S. Centers for Disease Control and
Preven-tion. Physical fighting among high school stu-dents—United States, 1990. MMWR Morb Mortal Wkly Rep 1992 Feb 14;41(6):91–94. 44. Hyde JS. How large are gender differences in
aggression? A developmental meta-analysis. Dev Psychol 1984;20:722–736.
45. Fournier M, de los Ríos R, Orpinas P, Piquet-Carneiro P. Estudio Multicéntrico sobre Acti-tudes y Normas Culturales frente a la Violen-cia. Proyecto ACTIVA: metodología. Rev Panam Salud Publica 1999;5(4/5):223–232. 46. Straus MA. Measuring intrafamily conflict and
violence: the Conflict Tactics (CT) scales. In: Straus MA, Gelles RJ, eds. Physical violence in American families: risk factors and adaptations to violence in 8,145 families. New Brunswick, NJ: Transaction Publications; 1990. p. 29–47. 47. Powell-Griner E, Anderson JE, Murphy W.
State and sex-specific prevalence of selected characteristics—Behavioral Risk Factor Sur-veillance System, 1994 and 1995. MMWR CDC Surveill Summ 1997 Aug 1;46(3):1–31. 48. Loeber R. Development and risk factors of
ju-venile antisocial behavior and delinquency. Clin Psychol Rev 1990;10:1–41.
49. Gelles RJ, Harrop JW. Verbal aggression by parents and psychosocial problems of chil-dren. Child Abuse Neglect 1991;15:223–238. 50. Straus MA, Gelles RJ. How violent are
Amer-ican families? Estimates from the National Family Violence Resurvey and other studies. In: Hotaling G, Finkelhor D, Kirkpatrick JT, Straus MA, eds. Family abuse and its conse-quences: new directions in research. Newbury Park, CA: Sage Publications; 1988.
51. Bachman R. Violence against women. Wash-ington, D.C.: U.S. Department of Justice, Bu-reau of Justice Statistics; 1994. (Publication NCJ-145325.)
El propósito principal de este trabajo es evaluar la fuerza de la asociación entre: 1) las conductas agresivas y 2) las actitudes y autoeficacia en torno a alternativas a la vio-lencia en diferentes ciudades de la Región de las Américas y España. Los resultados se basaron en una encuesta domiciliaria transversal de una muestra de la población entre los 18 y 70 años de edad. La encuesta se efectuó en ocho áreas metropolitanas de América Latina y España: Río de Janeiro, Brasil; Salvador, Bahía, Brasil; Santiago, Chile; Cali, Colombia; San José, Costa Rica; San Salvador, El Salvador; Caracas, Venezuela y Madrid, España. Cada muestra, que se compuso de alrededor de 1 200 encuestados por ciudad, se estratificó por conglomerados y fue proporcionada en cuanto a posición socioeconómica y densidad poblacional. En todas las ciudades y de todas las personas estudiadas que fueron blancos de agresión, las que notificaron haber sido agresivas fueron menos propensas a sentirse capaces de resolver conflictos sin recurrir a conductas agresivas, y más propensas a adoptar actitudes a favor del uso de la violencia. Las personas jóvenes también se inclinaron más a conducirse de manera agresiva contra todo tipo de persona que fue blanco de agresión. Por aña-didura, la agresión hacia personas ajenas a la familia fue más frecuente entre hombres jóvenes que notificaron tener episodios de consumo excesivo de alcohol, que llevaban un arma de fuego o tenían el deseo de llevarla, o que sentían que la policía era inefi-ciente. Hacen falta estudios adicionales en cada país para describir actitudes más es-pecíficas en relación con la agresión en cada subcultura. Los futuros programas de prevención deberán concentrarse en modificar las actitudes que favorecen la violen-cia, aumentar la autoeficacia para resolver problemas sin recurrir a actos violentos, apoyar el desarrollo de un sistema policiaco que despierte la confianza del público, regular la compra de armas de fuego y el acceso a bebidas alcohólicas y mejorar el nivel educativo de la población.
RESUMEN