Somchai Manopatanakul(a) Narumon Watanawirun(b)
(a)Australasian Board of Orthodontics, Department of Hospital Dentistry, Faculty of Dentistry, Mahidol University, Rajthewe, Bangkok, Thailand.
(b) Department of Hospital Dentistry, Faculty of Dentistry, Mahidol University, Rajthewe, Bangkok, Thailand.
Corresponding author Somchai Manopatanakul Department of Hospital Dentistry, Faculty of Dentistry, Mahidol University Yothi Street, Rajthewe
Bangkok - Thailand ZIP Code: 10400
E-mail: [email protected]
Received for publication on Jul 08, 2010 Accepted for publication on Dec 19, 2010
Comprehensive intermaxillary tooth
width proportion of Bangkok residents
Abstract: Proper occlusion depends on the correct width ratio between upper and lower teeth, known as Bolton’s ratio. In fact, this ratio can be calculated for each pair of teeth from the central incisor to the irst permanent molar. This set of ratios, known as comprehensive cumula-tive percentage ratios (CPRs), can be used not only to determine which tooth or teeth have a tooth width discrepancy, but can also enable the partial graphical analysis of tooth width discrepancy when there is agen-esis of certain permanent teeth. Although CPRs have been calculated for Caucasians, tooth width is known to vary depending on racial origin. Therefore, a test of differences between racial groups should be carried out. If these ratios of the Caucasians and Bangkokians are signiicantly different, the ratio of the Bangkokians is recommended. The objective of this study was to measure tooth size disproportion for Thai patients and to calculate a corresponding set of CPRs. Thirty-seven pairs of den-tal models were made from a group of Bangkok residents with normal occlusion. Mesiodistal tooth width was measured for each model. The intra- and inter-examiner measurement errors were ascertained as insig-niicant (p > 0.05). CPRs were then calculated and compared to those derived from other studies. Ten of thirteen CPRs were signiicantly dif-ferent from corresponding values derived from Caucasians. We conclude that tooth width ratios vary between different racial groups, and there-fore that these should be calculated speciically for each patient racial group.
Descriptors: Odontometry; Orthodontics, Corrective; Dentition, Permanent.
Introduction
Proper intercuspation, overjet, overbite, and alignment, depends on the correct width ratio between pairs of maxillary and mandibular teeth.1-3 Knowledge of the normal tooth width ratio can be used to guide
ex-pressed the opinion that this quotient does not af-fect patient perception,5,6 orthodontists are
nonethe-less required to offer the perfect interdigitation for their patients.
Bolton’s ratio is the most commonly used index of tooth width proportion.1 It is calculated as the
mean of the ratio of the six upper and lower teeth from the permanent central incisor to the irst per-manent molar. The posterior ratio and overall ratio are also used. Although each of these ratios has been studied extensively for a range of different racial7-10
and malocclusion groups,11-16 it is not clear whether
their clinical application in these studies was appro-priate. To clarify this issue, Tonn speciically ana-lyzed the ratio of the upper and lower premolars.17
Similarly, Bowles examined the ratio of the canines
and premolars.18 Ultimately, ratios have been
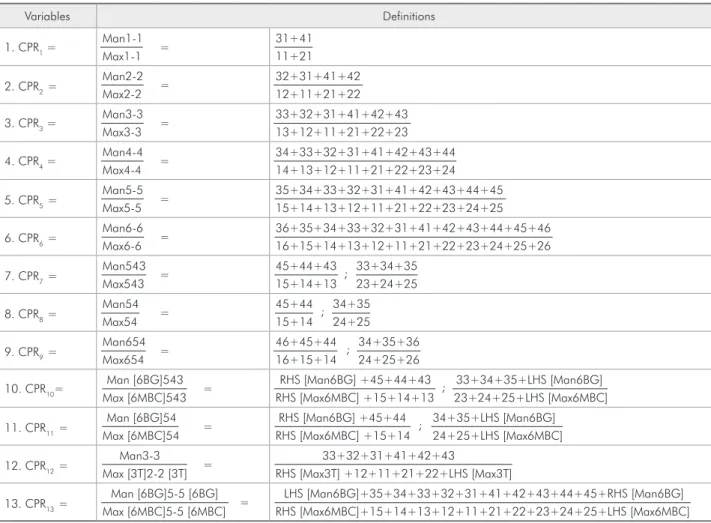
estab-lished for each matching pair of upper and lower teeth. The most comprehensive listing of cumulative percentage ratios (CPRs) was published by Ho and Freer, who listed 13 CPRs that were categorized as six antimere ratios, ive buccal segment ratios, and two additional ratios.19 The deinition of each CPR
is listed in Table 1.
Tooth width is strongly inluenced by genetic factors, and is known to vary signiicantly among different genders and races.20-21 The population of
Bangkok is composed of people with origins from each region of Thailand. Although the majority of Bangkokians are of Thai ethnic background, cen-turies of migration and invasion have resulted in a mixing in of many other ethnicities, as has
subse-Table 1 - Variables of Ho and Freer’s study.19
Variables Definitions
1. CPR1 =
Man1-1 Max1-1 =
31+41 11+21
2. CPR2= Man2-2 Max2-2 =
32+31+41+42 12+11+21+22
3. CPR3 =
Man3-3 Max3-3 =
33+32+31+41+42+43 13+12+11+21+22+23
4. CPR4 =
Man4-4 Max4-4 =
34+33+32+31+41+42+43+44 14+13+12+11+21+22+23+24
5. CPR5=
Man5-5 Max5-5 =
35+34+33+32+31+41+42+43+44+45 15+14+13+12+11+21+22+23+24+25
6. CPR6=
Man6-6 Max6-6 =
36+35+34+33+32+31+41+42+43+44+45+46 16+15+14+13+12+11+21+22+23+24+25+26
7. CPR7=
Man543 Max543 =
45+44+43
; 33+34+35 15+14+13 23+24+25
8. CPR8=
Man54 Max54 =
45+44
; 34+35 15+14 24+25
9. CPR9=
Man654 Max654 =
46+45+44
; 34+35+36 16+15+14 24+25+26
10. CPR10= Man [6BG]543 Max [6MBC]543 =
RHS [Man6BG] +45+44+43
; 33+34+35+LHS [Man6BG] RHS [Max6MBC] +15+14+13 23+24+25+LHS [Max6MBC]
11. CPR11=
Man [6BG]54 Max [6MBC]54 =
RHS [Man6BG] +45+44
; 34+35+LHS [Man6BG] RHS [Max6MBC] +15+14 24+25+LHS [Max6MBC]
12. CPR12=
Man3-3
Max [3T]2-2 [3T] =
33+32+31+41+42+43
RHS [Max3T] +12+11+21+22+LHS [Max3T]
13. CPR13= Man [6BG]5-5 [6BG] Max [6MBC]5-5 [6MBC] =
LHS [Man6BG]+35+34+33+32+31+41+42+43+44+45+RHS [Man6BG] RHS [Max6MBC]+15+14+13+12+11+21+22+23+24+25+LHS [Max6MBC]
quent integration of immigrants and travelers from South and Southeast Asia as well as Europe. More recently, intermarriages of Thais with Caucasian, Japanese, Chinese, and Middle East people have be-come more common. As a result, the ethnic back-ground of Bangkokians is continually evolving.22-23
This circumstance might be expected to affect the normal range of tooth widths in this population.
The aim of this study was to establish a complete set of comprehensive cumulative percentage ratios for Bangkokians, and to determine whether these should supplant the current criteria.
Materials and methods
Impressions were taken from a group of Bang-kok residents with normal occlusion. The inclusion criteria for the study were:
1. full eruption of all permanent teeth, aside from the second and third molars;
2. normal occlusion, with Class I molar relation-ship;
3. normal alignment, with no crowding or spacing;
4. normal tooth size and shape;
5. normal overjet and overbite;
6. no illings, or proximal illings in good condi-tion; and
7. the patient’s signed written consent.
From 495 subjects evaluated, 37 met the criteria for selection. The average age of patients was 18.5 years, ranging from 11 to 30 years.
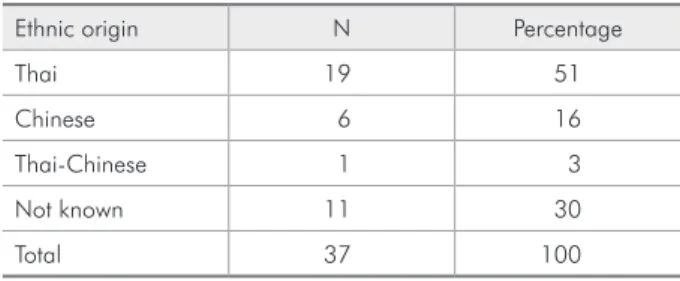
Since tooth size is known to vary among people of different ethnicities, the ethnic origin of each sample was recorded and is shown in Table 2. The most numerous subgroup in the sample was Thai with a mixture of Chinese and Thai-Chinese. The ethnic backgrounds of all patients who reported their ethnicity to be Thai are shown in Table 3.
The impressions were poured with stone and the bases were polished as dental models. Mitu-toyo digimatic calipers were used to measure the mesiodistal width of each tooth to an accuracy of 0.01 mm (Mitutoyo Corporation, Kanagawa, Ja-pan). The parameters for tooth width measurement were as described by Ho and Freer,19 and are
list-ed in Table 1. Two dentists conductlist-ed tooth width
measurement in parallel. All measurements were ad-ditionally reviewed by an orthodontist experienced in tooth width measurement (SM).
We also carried out a literature search to retrieve previous studies to whose results our values could be compared. Previous studies carried out on sys-tematic tooth size discrepancy were reviewed. All studies conducted on Bangkok residents were also reviewed. The criteria included studies that were well documented and peer reviewed. Studies that were original, well known, and reported commonly used ratios and speciic posterior ratios were includ-ed. Six studies met the criteria.
Results
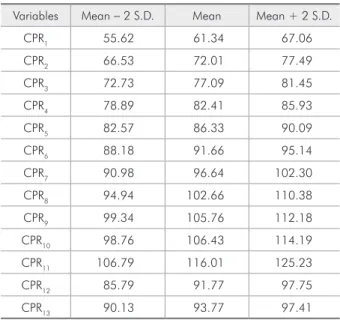
The mean value of every CPR plus or minus 2 standard deviations is shown in Table 4. To assess variability, each examiner made duplicate measure-ments on ten pairs of models. When the irst and replicate measurements were compared using the paired t-test, no signiicant difference in the two sets of measurements were found for either examiner (p > 0.05). A similar comparison was made between the measurements made by 2 examiners on the same set of models, and again no signiicant difference in
Table 2 - Ethnic background of patients.
Ethnic origin N Percentage
Thai 19 51
Chinese 6 16
Thai-Chinese 1 3
Not known 11 30
Total 37 100
Table 3 - Background of patients who reported Thai ethnic origin.
Region of Thailand N Percentage
Northeastern 10 53.0
North 2 10.5
Central 2 10.5
Eastern 1 5.0
Bangkok 4 21.0
of CPR 6, 10, and 11, each of the CPR values we calculated differed signiicantly from those reported by Ho and Freer.19
We extended our comparison to a number of additional previous studies, comparing the sample size, mean, and standard deviation of the ratios re-ported by each one of them (Table 6).1,17-19,24,25
Us-ing the t-test, no signiicant difference was found between the overall ratios we calculated and those reported by other studies. Notably, although Dech-kunakorn et al. studied a patient population from the same area as that of our patients, the anterior ratio they reported was signiicantly different from our result. However, no signiicant difference was found between the corresponding posterior ratios.25
Discussion
In this study, we have produced a comprehensive set of tooth width ratios for a group of Bangkok res-idents with normal occlusion.
Ho and Freer reported CPRs for all teeth required for a proper occlusion.2,19 This provided a valuable
tool for the clinician, as it allowed the individual teeth responsible for malocclusion to be identiied. Bolton proposed that tooth widths more than two standard deviations greater or smaller than the mean be considered out of range.1 In accordance, we
cal-culated these values for Bangkok residents (Table 4). We compared our results to previous studies both of Caucasian and Thai patients. The anterior ratio we derived differed signiicantly from that of all previous studies. The posterior ratio of this study was also statistically different from the posterior ratio of different ethnic groups. Even when the an-terior ratios were compared with those found for a population of the same area nine years earlier, they were signiicantly different. Therefore, we suggest that clinicians use the new values we have reported here.
Although this study might be criticized for hav-ing a small sample size, we emphasize that we ap-plied strict inclusion criteria to a patient pool that was initially much larger (from 495 subjects, only 37 with perfect occlusion were included). We note also that the comprehensive ratio is not the only factor that should be considered when teeth are
re-Table 5 - A comparison of tooth ratios from the present
study and that of Ho and Freer.19
Variables
Mean S.D.
Statistical significance Ho and
Freer’s study
Present study
Ho and Freer’s study
Present study
CPR1 63.69 61.34 2.89 2.86 **
CPR2 74.51 72.01 2.59 2.74 **
CPR3 78.73 77.09 2.10 2.18 **
CPR4 84.04 82.41 1.73 1.76 **
CPR5 88.09 86.33 1.69 1.88 **
CPR6 91.98 91.66 1.58 1.74 NS
CPR7 97.72 96.64 2.63 2.83 *
CPR8 103.71 102.66 3.62 3.86 **
CPR9 104.56 105.76 2.86 3.21 *
CPR10 106.83 106.43 3.10 3.88 NS
CPR11 116.17 116.01 4.32 4.61 NS
CPR12 96.44 91.77 2.93 2.99 **
CPR13 94.37 93.77 1.96 1.82 **
*p < 0.05, **p < 0.01
Table 4 - Mean cumulative percentage ratios plus and mi-nus two standard deviations.
Variables Mean - 2 S.D. Mean Mean + 2 S.D.
CPR1 55.62 61.34 67.06
CPR2 66.53 72.01 77.49
CPR3 72.73 77.09 81.45
CPR4 78.89 82.41 85.93
CPR5 82.57 86.33 90.09
CPR6 88.18 91.66 95.14
CPR7 90.98 96.64 102.30
CPR8 94.94 102.66 110.38
CPR9 99.34 105.76 112.18
CPR10 98.76 106.43 114.19
CPR11 106.79 116.01 125.23
CPR12 85.79 91.77 97.75
CPR13 90.13 93.77 97.41
the measured values was found (p > 0.05).
We used the t-test to compare our results with those reported by Ho and Freer.19 The results of this
quired to it for perfect occlusion; the labio-lingual tooth thickness, inclination, and interincisal angle must also be included.5, 6 These factors require
veri-ication to identify the priority of clinical relevance.
Conclusion
The maxillary and mandibular tooth width ra-tios have been shown to affect occlusal interdigita-tion. However, as these ratios were initially derived by Ho and Freer from Caucasian children, it is ques-tionable whether they can be accurately applied to
patients of other ethnic origin. Here, we have re-calculated tooth width ratios for Bangkok residents with normal occlusion, and determined that the ma-jority of CPRs are different from those derived from Caucasian samples, and from those derived from a similar patient population 9 years earlier.19
Acknowledgements
Dr. Ittigon Law’s assistance with tooth width measurement is gratefully appreciated.
References
1. Bolton WA. Disharmony in tooth size and its relation to the analysis and treatment of malocclusion. Angle Orthod. 1958;28(3):113-30.
2. Ho CT, Freer TJ. Clinical application of the graphical analysis of tooth width discrepancy. Aust Orthod J. 1994 Mar;13(3):137-43.
3. Endo T, Ishida K, Shundo I, Sakaeda K, Shimooka S. Effects of premolar extractions on Bolton overall ratios and
tooth-size discrepancies in a Japanese orthodontic population. Am J Orthod Dentofacial Orthop. 2010 Apr;137(4):508-14. 4. Bayram M, Ozer M. Mandibular incisor extraction treatment
of a Class I malocclusion with Bolton discrepancy: a case report. Eur J Dent. 2007Jan;1(1):54-9.
5. Othman SA, Harradine N W. Tooth-size discrepancy and Bolton’s ratios: a literature review. J Orthod. 2006 Mar;33(1):45-51.
Variables Studies N Mean S.D. Statistical significance
Anterior ratio (Man3-3) (Max3-3)
Bolton (1958)1 55 77.20 1.65 NS
Ho and Freer (1994)19 60 78.70 2.10 ***
Dechkunakorn (1995) 25 100 78.53 2.34 ***
Present study 37 77.09 2.18
Overall ratio (Man6-6) (Max6-6)
Bolton (1958) 1 55 91.30 1.91 NS
Ho and Freer (1994)19 60 92.00 1.58 NS
Dechkunakorn (1995)25 100 92.00 1.68 NS
Present study 37 91.66 1.74
Posterior ratio (Man4,5,6) (Max4,5,6)
Lundstrom (1954)* 24 68 104.90 3.08 NS
Ho and Freer (1994) 19 60 104.60 2.86 **
Dechkunakorn (1995) 25 100 104.90 2.17 NS
Present study 37 105.76 3.21
(Man54) (Max54)
Tonn (1937)* 17 50 104.20 2.30 ***
Ho and Freer (1994) 19 60 103.70 3.63 ***
Present study 37 102.66 3.86
(Man543) (Max543)
Bowles (1970) 18 30 96.60 1.50 NS
Ho and Freer (1994)19 60 97.70 2.60 **
Present study 37 96.64 2.83
*value derived and calculated from this study, **p < 0.05, ***p < 0.01
6. Cordato MA. A simple mathematical study of anterior dental relations: part I. Aust Orthod J. 1995 Mar;13(4):249-52. 7. Endo T, Shundo I, Abe R, Ishida K, Yoshino S, Shimooka
S. Applicability of Bolton’s tooth size ratios to a Japanese orthodontic population. Odontology. 2007 Jul;95(1):57-60. Epub 2007 Jul 25.
8. Paredes V, Gandia JL, Cibrian R. Do Bolton’s ratios apply to a Spanish population? Am J Orthod Dentofacial Orthop. 2006 Mar;129(3):428-30.
9. Uysal T, Sari Z. Intermaxillary tooth size discrepancy and mesiodistal crown dimensions for a Turkish population. Am J Orthod Dentofacial Orthop. 2005 Mar;128(2):226-30. 10. Al-Omari IK, Al-Bitar ZB, Hamdan AM. Tooth size
discrep-ancies among Jordanian school children. Eur J Orthod. 2008 Oct;30(5):527-31. Epub 2008 Jul 5.
11. Araujo E, Souki M. Bolton anterior tooth size discrepan-cies among different malocclusion groups. Angle Orthod. 2003 Jun;73(3):307-13.
12. Nie Q, Lin J. Comparison of intermaxillary tooth size dis-crepancies among different malocclusion groups. Am J Orthod Dentofacial Orthop. 1999 Nov;116(5):539-44.
13. Freeman JE, Maskeroni AJ, Lorton L. Frequency of Bolton tooth-size discrepancies among orthodontic patients. Am J Orthod Dentofacial Orthop. 1996 Jul;110(1):24-7.
14. Sperry TP, Worms FW, Isaacson RJ, Speidel TM. Tooth-size discrepancy in mandibular prognathism. Am J Orthod. 1977 Aug;72(2):183-90.
15. Wedrychowska-Szulc B, Janiszewska-Olszowska J, Stepien P. Overall and anterior Bolton ratio in Class I, II, and III
orthodontic patients. Eur J Orthod. 2010 Jun;32(3):313-8. Epub 2009 Dec 16.
16. Oktay H, Ulukaya E. Intermaxillary tooth size discrepan-cies among different malocclusion groups. Eur J Orthod. 2010 Jun;32(3):307-12. Epub 2009 Sep 3.
17. Tonn P. Uber die mesio-distalen Zahnbreitenrelationen Oberkiefers zu den entsprechenden des Unterkiefers bei nor-malen and anornor-malen Okklusion [dissertation]. Berlin (Ger-many): Humboldt-Universitat; 1937. 46 p.
18. Bowles RM. Evaluation of tooth size relationships in various intradental and interdental arch segments. Am J Orthod. 1970 Apr;57(4):415.
19. Ho CT, Freer TJ. The graphical analysis of tooth width dis-crepancy. Aust Orthod J. 1994 Mar;13(2):64-70.
20. Garn SM. Lewis AB, Kerewsky RS. Sex differences in tooth size. J Dent Res. 1964 Mar;43:306.
21. Barrett MJ, Brown T, Macdonald MR. Dental observations on Australian aborigines: mesiodistal crown diameters of per-manent teeth. Aust Dent J. 1965 Sep;44(5):912-20. 22. Singhakachen W. Demography. Bangkok: Sritongkum
Publish-ing; 2001. 200 p.
23. Jaroontham J, Godfrey K. Mixed dentition space analysis in a Thai population. Eur J Orthod. 2000 Apr;22(2):127-34. 24. Lundstrom A. Intermaxillary tooth width ratio and tooth
alignment and occlusion. Acta Odontol Scand. 1955 Feb;12(3-4):265-92.