ABSTRACT:Objective:To validate Tanaka and Kawasaki’s formulas to calculate the salt intake by the sodium/creatinine ratio in spot of urine. Methods: Two hundred and seventy two adults (20 – 69 years old; 52.6% women) with 24 h urine collection and two urinary spots collected on the same day (while fasting – spot 1 – or not fasting – spot 2). Anthropometry, blood pressure and fasting blood were measured on the same day. The analysis of agreement between salt consumption measured in the 24 h urine test and urinary spots were determined by the Pearson’s correlation (r) and the Bland & Altman method. Results: The mean
salt consumption measured by the 24 h sodium excretion was 10.4 ± 5.3 g/day. The correlation between the measured 24 h sodium excretion and the estimation based on spots 1 and 2, respectively, was only moderated according to Tanaka (r = 0.51 and r = 0.55; p < 0.001) and to Kawasaki (r = 0.52 and r = 0.54; p < 0.001). We
observed an increasing underestimation of salt consumption by Tanaka to increasing salt consumption and conversely, an overestimation of consumption by the Kawasaki formula. The estimation of salt consumption (diference between measured and calculated salt consumption lower than 1 g/day) was adequate only when the consumption was between 9 – 12 g/day (Tanaka) and 12 – 18 g/day (Kawasaki). Conclusion: Spot urine sampling is adequate to estimate salt consumption only among individuals with an actual consumption near the population mean.
Keywords: Sodium Chloride. Sodium. Urine. Sodium Chloride, Dietary.
Validation study of the Tanaka and Kawasaki
equations to estimate the daily sodium
excretion by a spot urine sample
Estudo de validação das equações de Tanaka e de Kawasaki para estimar a
excreção diária de sódio através da coleta da urina casual
José Geraldo MillI, Sérgio Lamêgo RodriguesI, Marcelo Perim BaldoI, Deborah Carvalho MaltaII, Celia Landmann SzwarcwaldIII
IDepartment of Physiological Sciences, Center of Health Sciences, Universidade Federal do Espírito Santo – Vitória (ES) Brazil. IIDepartment of Surveillance of Non-Communicable Diseases and Health Promotion, Ministry of Health – Brasília (DF), Brazil. IIICenter of Scientiic and Technological Information, Fundação Oswaldo Cruz – Rio de Janeiro (RJ), Brazil.
Corresponding author: José Geraldo Mill. Departamento de Ciências Fisiológicas. Centro de Ciências da Saúde da UFES. Avenida Marechal Campos, 1468. Maruípe. CEP 29042770. Vitória, ES, Brasil. Email: [email protected]
Conlict of interests: nothing to declare – Financial support: The project was funded by the Department of Surveillance of Non-Communicable Diseases, Ministry of Health, Brasília, Distrito Federal.
INTRODUCTION
The prevalence of arterial hypertension (AH) in Brazil is high, around 25% among adults1. Population studies show that the mean pressure level and the prevalence of AH are strongly inluenced by the consumption of sodium2-4. AH has been recognized as the factor that most contributes to cardiovascular morbidity and mortality around the world5. As a consequence, the reduction in sodium consumption has been encouraged both to decrease cardiovascular morbidity and mortality and also to facilitate the treatment for AH3-6. However, the control of sodium intake in the population is still precarious, because of the low reliability of some methods constantly used to estimate the sodium consump-tion through quesconsump-tionnaires and also the diicult of using the measurements of 24-hour urinary sodium excretion (NaUr-24h)7-9. To overcome these issues, some protocols have been made, such as urine collection in shorter periods8,10 and the estimation of sodium intake by measuring the sodium/creatinine ratio in casual urine11,12. For that, equations were developed to estimate the 24-hour sodium excretion, and, consequently, the salt con-sumption4,11-13. The accuracy of such an estimation depends on a precisely measurement of the 24-hour creatinine excretion based on weight and height11,12. However, the daily creatinine excretion also depends on other variables, such as muscle mass and diet14-16. So, studies to validate the equations in populations other than those in which they were developed are necessary. Therefore, the objective of this study was to assess the accuracy of the salt consumption estimation by applying the equations proposed by Tanaka et al.12 and Kawazaki et al.11 to parameters measured in a casual urine sample of adults collected in fasting and non fasting conditions.
RESUMO:Objetivo: Validar as fórmulas de Tanaka e Kawasaki para cálculo do consumo de sal pela relação sódio/creatinina na urina casual. Métodos: Foram estudados 272 adultos (20 – 69 anos, 52,6% de mulheres) com coleta urinária de 24 h e duas coletas casuais no mesmo dia (em jejum – casual 1 – e fora do jejum – casual 2). Antropometria, pressão arterial e coleta de sangue foram obtidos no mesmo dia. A concordância entre o consumo de sal estimado pela urina de 24 h e pela urina casual foi feita por Pearson (r) e Bland & Altman. Resultados: O consumo médio de sal medido pela urina de 24 h foi de 10,4 ± 5,3 g/dia. A correlação entre a excreção de sódio na urina de 24 h e a estimada pela urina casual 1 ou 2, respectivamente, foi apenas moderada, tanto por Tanaka (r = 0,51 e r = 0,55; p < 0,001) como por Kawasaki (r = 0,52 e r = 0,54; p < 0,001). Observa-se subestimação crescente dos valores estimados em relação ao medido com o aumento do consumo de sal pela fórmula de Tanaka e, ao contrário, superestimação ao usar a fórmula de Kawasaki. As fórmulas estimam adequadamente o consumo diário de sal (diferença entre sal medido e estimado de, no máximo, 1 g/dia) somente com consumo entre 9 – 12 g/dia (Tanaka) e 12 – 18 g/dia (Kawasaki). Conclusão: A coleta de urina casual estima adequadamente o consumo de sal apenas nos indivíduos próximos à média populacional.
METHODS
Three-hundred ninety six volunteers (living in Vitória, ES) were recruited from a random sample of households, raled from 20 census sectors of the city. The households were vis-ited for the inclusion of one volunteer (20 – 69 years old). The selection was based on quo-tas, with the goal of 50% for each gender and 20% per age decade. Individuals with acute diseases, in bed, with low mobility or diiculties of communication as well as pregnant or breast-feeding women were excluded. The project was approved by the Research Ethics Committee of the Center of Health Sciences at Universidade Federal do Espírito Santo (UFES, Protocol 201.110), and all participants signed the informed consent form.
Research assistants collected sociodemographic data in the household (sex, self-reported race/ethnicity, monthly income and schooling), practice of physical activities, use of medi-cines and life habits (smoking), and scheduled the day for urine collection. On the same day, clinical and laboratory examinations were programmed in the Clinical of Cardiovascular Investigation (CIC), at the University Hospital of UFES. The participants were advised not to interrupt the use of medications and to keep up with their dietary habits until the con-clusion of the tests. The day before collection, they should fast after 8 p.m., not consume alcohol and not perform vigorous physical activities, as well as on the day of the collection. On this day, they should empty their bladder in the morning, when they woke up, and write down the time on the form, starting the 24-hour urine collection. Still fasting, they should go to CIC to undergo examinations and draw a blood sample.
CLINICAL AND LABORATORY EXAMINATIONS
When they arrived at CIC, the time of morning vesical emptying was checked, and par-ticipants were given a sterile bottle for the irst collection in the 24-hour period. After that, the anthropometric (weight and height) and blood pressure (oscillometric method, Onrom 765CP, Japan) measurements were obtained. Tetrapolar bioimpedance (InBody 320, Korea) was also performed to obtain lean mass and body fat. Three blood pressure and heart rate measurements were taken (one minute interval between measurements), in the seated position and after a ive-minute rest. Still fasting, blood sample was drawn to establish bio-chemical parameters.
24-HOUR URINE COLLECTION
the last collection on the next day, 24 hours after the vesical emptying from the morning before. A second 5 mL sample was required to be collected in the afternoon (casual urine 2), using the same procedure of the previous casual collection. For that, they received the necessary material (cup, disposable Pasteur pipette and Falcon tube, previously labeled). The training for sample aliquoting with water was carried out at CIC by an instructor. The time of the last collection should be written down on the form, and the 24-hour urine and the tube containing the casual urine 2 were collected in the household by a research assistant, after checking for possible losses.
Valid 24-hour collections were those with no report of urine loss and with collection time between 23 and 25 hours. Volume was measured in beaker (precision of 10 mL) and adjusted for 24 hours. 24-hour and casual 1 and 2 urine aliquots were stored at -80°C until they were sent to a central laboratory to determine sodium and potassium (selective electrode) and creatinine concentrations (Jafé method). Urinary volumes < 500 mL in 24 hours were not considered, as well as those presenting creatinine excretion corrected for body weight outside the intervals of 14.4 – 33.6 mg/kg for men and 10.8 – 25.2 mg/kg for women17,18. Out of the 396 individuals recruited from the households, 330 underwent the 24-hour collection and 272 had a validated collection. The non-validation occurred for report of loss (n = 8), volume < 500 mL (n = 4), col-lection > 25 h (n = 2) or creatinine outside the established interval (n = 44)17,18.
PREDICTIVE EQUATIONS FOR 24-HOUR CREATININE AND SODIUM EXCRETION
Tanaka et al.12 estimated the 24-hour creatinine excretion (CrPr-24h) based on age, weight and height, using the same equation for both genders. Kawasaki et al.14 developed gender-spe-ciic equations. After establishing the CrPr-24 h and the sodium/creatinine ratio in casual urine (Na/CrUr), it is possible to estimate the total sodium content in the 24-hour urine (Na-24h).
TANAKA METHOD
CrPr24h (mg) = [(14.89 x weight, kg) + (16.14 x height, cm) (2.04 x age, years)] – 2,244,45
NaUr (mEq) = [Na casual urine, mEq/L/(Cr casual urine, mg/dL x 10)] x CrPr24 h (mg)
Estimation of Na24h (mEq) excretion = 21.98 x NaUr0,392
KAWASAKI METHOD
Men
Women
CrPr24h (mg) = [(8.58 x weight, kg) + (5.09 x height, cm) (4.72 x age, years) – 74.95
NaUr (mEq) = [Na casual urine (mEq/L)/(Cr casual urine mg/dL X 10)] x CrPr24h (mg)
Estimation of Na24h (mEq) excretion = 16.3 X (√[(NaUr) x (CrPr24h)]
The daily intake of salt was calculated from the sodium excretion in 24-uring, consider-ing that the sodium came from only NaCl intake.
STATISTICAL ANALYSIS
The data are described as mean, standard deviation (SD) and median for continuous variables or as proportions and percentages. The adjustment to normal distribution was assessed by the Kolmogorov-Smirnov test. The comparison of two means was made with the Student’s t-test (normal data) or by the Mann-Whitney test (asymmetric distributions). Proportions were compared by χ2. The comparison of creatinine medians excreted in 24-hour urine and that predicted by the equations was analyzed by one-way ANOVA with the post-hoc Tukey. The associations between sodium, salt and creatinine excretions measured and estimated by the formulas were determined by Pearson or Spearman correlation coei-cient, when necessary. The analysis of agreement between 24-hour urine sodium and the value estimated by the formulas applied to casual urine 1 and 2 was assessed by the Bland and Altman method19. The percentage of error in the estimation of salt excretion was cal-culated using the formula: Error (%) = 1.96 x [(SD (24h measured Na – estimated Na) / mean of 24-hour measured Na)] X 10020. Accuracy was considered to be acceptable when the diference between the measured and estimated salt consumption was lower than 1 g/ day. The statistical analysis was made with SPSS 13.0 (Chicago, IL, USA), and statistical sig-niicance was established in p < 0.05.
RESULTS
Table 1 shows the sodium excretion measured in the 24 h urine and that estimated by the formulas. The Kawasaki formula overestimates sodium excretion and salt consumption in men and women when using casual urine 1 and 2. The Tanaka formula underestimates the consumption among men and establishes a small overestimation among women. The errors between the measured and estimated values tend to be higher with data from casual urine 2, except for men using the Tanaka formula.
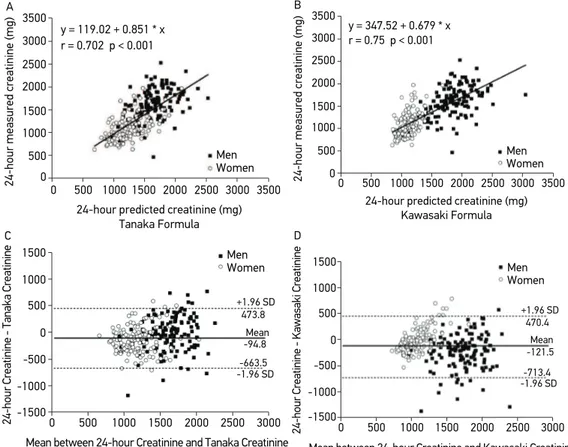
Figure 1 shows the correlation between the creatinine excreted in the 24 hours and that predicted by both formulas. It is possible to observe (upper panels) good correlation (r ≥
Table 1. Characteristics of sodium excretion and salt consumption based on 24-hour urine measurements and calculations made with the Tanaka and Kawasaki formulas based on casual urine collection 1 (fasting) and 2 (not fasting).
Variable 24-h urine (Measured)
Men Women
NaUr (mEq/day) 204.00 (187.00)± 73.00 152.00 (143.00)± 59.00
Salt (g/day) 11.90 (10.90)± 4.20 8.80 (8.40)± 3.40
Δ salt (g/day) – –
Casual Urine 1 (Estimated)
Tanaka Kawasaki
Men Women Men Women
NaUr (mEq/day) 168.00 (168.00)± 34.00 156.00 (155.00)± 37.00 223.00 (235.00)± 59.00 190.00 (189.00)± 54.00
Salt (g/day) 9.80 (9.80)± 1.90 9.10 (9.00)± 2.10 13.10 (13.80)± 3.50 11.10 (11.00)± 3.10
Δ salt (g/day) 2.10 0.30 1.20 2.30
Casual Urine 2 (Estimated)
Tanaka Kawasaki
Men Women Men Women
NaUr (mEq/day) 180.00 ± 34.00 (177.00)
167.00 ± 32.00 (169.00)
255.00 ± 60.00 (250.00)
206.00 ± 47.00 (206.00)
Salt (g/day) 10.50 (10.40)± 1.92 9.80 (9.90)± 1.80 14.90 (14.60)± 3.50 12.00 (12.10)± 2.70
Δ salt (g/day) 1.40 1.00 3.00 3.20
Data presented as mean ± standard deviation and (median). NaUr: Urinary sodium; Δ salt: diference between
0.70) with both formulas. The correlation, however, was strongly inl uenced by the inclu-sion of men and women on the same plot, which is questionable due to the lower muscle mass in women. Bland and Altman diagrams (lower panels) indicate agreement in the accep-tance limits (95 and 95% of individuals within limits ± 1.96 SD; respectively). The Tanaka formula, however, is slightly more accurate due to the dif erence between means is lower (measured and estimated), and fewer individuals were outside the agreement limits. It is important to observe that most individuals outside the agreement limits are men. Besides, it is also possible to see the occurrence of estimation bias regarding the creatinine predicted for women in the Kawasaki formula.
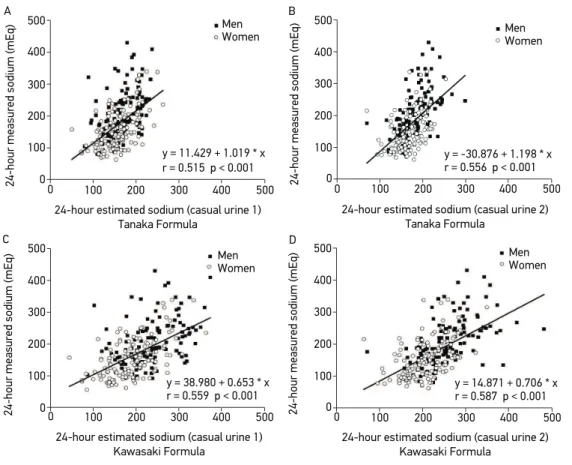
Figure 2 presents the correlation plots between the sodium measured in the 24-hour urine and that estimated by casual urine 1 and 2. Correlations were moderate (r between 0.51 and 0.55). The Tanaka formula underestimates the sodium in individuals with higher excretion within 24 hours, regardless of casual urine. On the other hand, the Kawasaki
A
y = 119.02 + 0.851 * x 3500
r = 0.702 p < 0.001 3000 2500 2000 1500 1000 500 0 3500 3000 2500 2000 1500 1000 500 0
24-hour measured creatinine (mg)
24-hour predicted creatinine (mg) Tanaka Formula
Men Women
B
y = 347.52 + 0.679 * x 3500
r = 0.75 p < 0.001 3000 2500 2000 1500 1000 500 0 3500 3000 2500 2000 1500 1000 500 0
24-hour measured creatinine (mg)
24-hour predicted creatinine (mg) Kawasaki Formula Men Women C +1.96 SD 1500 473.8 1000 500 0 -500 -1000 -1500 0
24-hour Creatinine - Tanaka Creatinine
Mean between 24-hour Creatinine and Tanaka Creatinine 1500
1000
500 2000 2500 3000
Mean -94.8 -1.96 SD -663.5 Men Women D +1.96 SD 1500 470.4 1000 500 0 -500 -1000 -1500 0
24-hour Creatinine - Kawasaki Creatinine
Mean between 24-hour Creatinine and Kawasaki Creatinine 1500
1000
500 2000 2500 3000
Mean -121.5 -1.96 SD -713.4 Men Women
r: Pearson’s correlation coeffi cient; SD: standard deviation
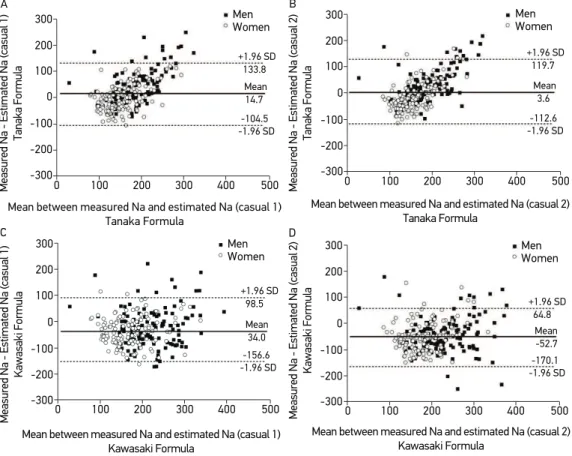
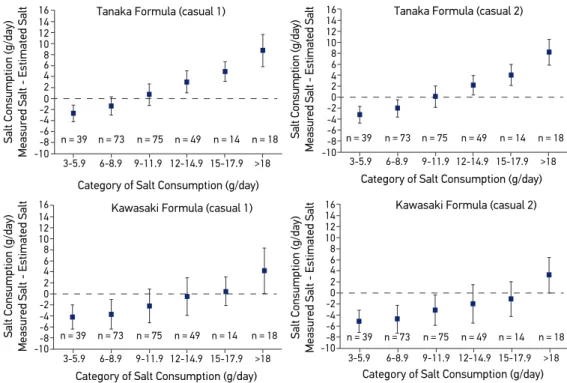
formula tends to overestimate the sodium regarding urine with lower sodium excretion in both collected samples. Figure 3 presents the Bland and Altman diagrams to assess the agreement between the methods estimating the sodium excretion. It is possible to observe that, even though the Tanaka formula has a lower dif erence between means, especially in casual urine 2, there is estimation bias, with increasing underestimation of excretion val-ues when the intake of this nutrient increases. The Kawasaki formula has the higher dif er-ence between means, and the value estimated by the formula is about 50 mEq/day higher than the measured value (corresponding to an estimation error of about 3 g of salt a day). Figure 4 shows the dif erence between the measured salt (24-hour urine) and that estimated by the formulas applied to casual urine 1 and 2 as a function of the daily intake of salt measured in the 24-hour urine. It is observed that the Tanaka formula estimates, with accuracy of 1 g of salt/ day, only those individuals with salt intake between 9 and 12 g/day. The Tanaka formula tends to overestimate categories with lower intake and to underestimate categories with higher intake.
A 500 400 300 0 200 100 0
24-hour measured sodium (mEq)
24-hour estimated sodium (casual urine 1) Tanaka Formula 500 400 300 200 100
y = 11.429 + 1.019 * x r = 0.515 p < 0.001
Men Women B 500 400 300 0 200 100 0
24-hour measured sodium (mEq)
24-hour estimated sodium (casual urine 2) Tanaka Formula 500 400 300 200 100
y = -30.876 + 1.198 * x r = 0.556 p < 0.001
Men Women C 500 400 300 0 200 100 0
24-hour measured sodium (mEq)
24-hour estimated sodium (casual urine 1) Kawasaki Formula 500 400 300 200 100
y = 38.980 + 0.653 * x r = 0.559 p < 0.001
Men Women D 500 400 300 0 200 100 0
24-hour measured sodium (mEq)
24-hour estimated sodium (casual urine 2) Kawasaki Formula 500 400 300 200 100
y = 14.871 + 0.706 * x r = 0.587 p < 0.001
Men Women
r: Pearson correlation coeffi cient.
The Kawasaki formula properly estimates the salt intake between 12 and 18 g/day by casual 1, and tends to overestimate the intake in categories with low salt consumption.
DISCUSSION
The 24-hour urine collection has been used as gold-standard to estimate the sodium con-sumption among individuals and populations8. However, it is dii cult to conduct this pro-cedure considering the need to collect outside the household, sometimes in work places. Therefore, there have been ef orts to standardize more practical methods of collection8,10,21. The accuracy of these methods, however, has been questioned21-24, and that is why it is neces-sary to conduct validation studies in dif erent populations than that they were developed11-13,25. The accuracy of the estimation of sodium excretion in casual urine mostly depends on the estimated accuracy of the 24-hour creatinine excretion, based on gender, weight and height.
A +1.96 SD 300 133.8 200 100 0 -100 -200 -300 0
Measured Na - Estimated Na (casual 1)
Tanaka Formula
300 200
100 400 500
Mean 14.7
-1.96 SD -104.5
Mean between measured Na and estimated Na (casual 1) Tanaka Formula Men Women B +1.96 SD 300 119.7 200 100 0 -100 -200 -300 0
Measured Na - Estimated Na (casual 2)
Tanaka Formula
300 200
100 400 500
Mean 3.6
-1.96 SD -112.6
Mean between measured Na and estimated Na (casual 2) Tanaka Formula Men Women C +1.96 SD 300 98.5 200 100 0 -100 -200 -300 0
Measured Na - Estimated Na (casual 1)
Kawasaki Formula
300 200
100 400 500
Mean 34.0
-1.96 SD -156.6
Mean between measured Na and estimated Na (casual 1) Kawasaki Formula Men Women D +1.96 SD 300 64.8 200 100 0 -100 -200 -300 0
Measured Na - Estimated Na (casual 2)
Kawasaki Formula
300 200
100 400 500
Mean -52.7
-1.96 SD -170.1
Mean between measured Na and estimated Na (casual 2) Kawasaki Formula
Men Women
Figure 3. Analysis of agreement (Bland and Altman) between 24-hour measured urine sodium and that estimated with the Tanaka and Kawasaki formulas applied to the parameters measured in casual urine 1 and 2.
n = 39 16
n = 73 14 10 0 -2 -6 -10 3-5.9
Salt Consumption (g/day)
Measured Salt - Estimated Salt
Tanaka Formula (casual 1)
12-14.9 9-11.9
6-8.9 15-17.9 >18 n = 75 n = 49 n = 14 n = 18
Category of Salt Consumption (g/day) 12 2 4 6 8 -4
-8 n = 39
16
n = 73 14 10 0 -2 -6 -10 3-5.9
Salt Consumption (g/day)
Measured Salt - Estimated Salt
Tanaka Formula (casual 2)
12-14.9 9-11.9
6-8.9 15-17.9 >18 n = 75 n = 49 n = 14 n = 18
Category of Salt Consumption (g/day) 12 2 4 6 8 -4 -8
n = 39 16
n = 73 14 10 0 -2 -6 -10 3-5.9
Salt Consumption (g/day)
Measured Salt - Estimated Salt
Kawasaki Formula (casual 1)
12-14.9 9-11.9
6-8.9 15-17.9 >18 n = 75 n = 49 n = 14 n = 18
Category of Salt Consumption (g/day)
12 2 4 6 8 -4
-8 n = 39
16
n = 73 14 10 0 -2 -6 -10 3-5.9
Salt Consumption (g/day)
Measured Salt - Estimated Salt
Kawasaki Formula (casual 2)
12-14.9 9-11.9
6-8.9 15-17.9 >18 n = 75 n = 49 n = 14 n = 18
Category of Salt Consumption (g/day) 12 2 4 6 8 -4 -8
Figure 4. Diferences between the salt measured in 24 h and the salt estimated by the Tanaka and Kawasaki formulas based on data obtained in casual urine 1 and 2, related to the categories of salt consumption.
However, diet and lean mass also inluence this parameter15,16, so it is important to validate these formulas in our population.
The sample used can be considered to be representative of the adult population in Vitória based in other studies26-28. The initial loss (n = 66) happened because the 24-hour urine collec-tion was not conducted properly. Among those who collected the urine (n = 330), there was a rigorous veriication of the time of beginning and end of collection, using strict criteria to consider the collection as “valid”. The criterion that led to most losses was creatinine excreted per kilo of body weight16,17. Calculations were based on 272 adults, with distribution balanced by gender and age group. Despite being suicient for agreement studies, it was insuicient to analyze subgroups. One diferential of this study was to include two samples of casual urine to verify if the time of collection would inluence the agreement and the accuracy.
sodium excretion and salt consumption. Based on this fact, we inferred it is not possible to estimate the sodium consumption using these formulas with errors lower than 10%, which would be equal to 1 g of salt a day. Another fact was the presence of systematic error when estimating creatinine excretion among women using the Kawasaki formula. Therefore, the data suggest that the Tanaka formula would have better performance to estimate the 24-hour creatinine excretion in our population. So, it would be important to create speciic formulas for our population, possibly based on the lean mass, to reduce the bias resulting from obesity16. The increasing mean BMI in the Brazilian population in the past decades is inaccurate in this area.
Our data showed that the salt consumption estimated by the gold-standard is higher in comparison to other populations9,21,25, being higher than twice the current recommenda-tion of 5 g of salt a day29. The impact of salt consumption on blood pressure of the study participants was described in another publication30. It is possible to observe that the current consumption seems to be decreasing in relation to previous studies conducted in the same population of Vitória10,27,28. However, this inding should be carefully analyzed, because the method for urine collection was diferent in previous studies. It is worth to mention that the subgroups that mostly beneitted from the reduction in salt consumption, such as hyperten-sive people, still consume much more than the recommended amount29,31.
Another bias observed in our study results from the inal formulas used in the calculation of total sodium excretion in 24 hours. The use of potency lower than 1 (0.392 in the Tanaka formula and 0.5 in the Kawasaki formula) reduces the consumption extremes, going towards the group average. The wanted efect is exactly that of improving the accuracy of the esti-mation regarding the mean consumption of the studied population. However, it makes it more diicult to conduct a subgroup analysis, and completely distorts the estimation of individual consumption, as observed in Figure 4. Since the mean salt intake was about 10 g/ day, and given the great variability of this item in the diet, we considered the error of up to 1 g a day to be tolerable. If this parameter is used, the Tanaka formula would only be ade-quate to estimate the intake of salt in individuals consuming between 9 to 12 g/day. With the Kawasaki formula, the same accuracy will only be reached for individuals with intake ranging from 12 to 18 g/day. This conclusion is in agreement with recent reviews21-24, but diferent from other studies that considered the estimations of salt consumption based on casual urine to be adequate for epidemiological analyses or for follow-up of individual con-sumption8,9,11,12,32,33. The acceptance of methods, however, was based on analyses of agree-ment. The introduction of a potency that reduces consumption extremes was mentioned by Tanaka et al.12, in their initial study, highlighting the inadequacy of the method for esti-mations of individual consumption. High correlation coeicients are not suicient to show the equivalence between methods34.
Our study has strong aspects and limitations. The strong items are the data from the general population and the methodological rigor to determine the time of urine collec-tion for 24 hours. Besides, it was possible to compare the performance of formulas in two casual urine collections. Finally, we used robust tests of validation. Our greatest limitation is that we have an insuicient sample to analyze subgroups, and the fact that it is not pos-sible to assess sodium loss by swearing, which is an important factor in a tropical country.
CONCLUSION
Considering the data and the limitations, it is possible to conclude that the application of the Tanaka formula with parameters measured in the casual urine collected outside the fasting period would lead to lower error to estimate the daily sodium excretion and salt con-sumption in our population. The 1 g/day precision, however, is only reached for a narrow consumption group, around the population mean.
ACKNOWLEDGMENTS
1. Picon RV, Fuchs FD, Moreira LB, Riegel G, Fuchs SC. Trends in prevalence of hypertension in Brazil: a systematic review with meta-analysis. PloS One 2012; 7(10): e48255.
2. O’Donnell MJ, Xavier D, Liu L, Zhang H, Chin SL, Rao-Melacini P, et al. Risk factors for ischaemic and intracerebral haemorrhagic stroke in 22 countries (the INTERSTROKE study): a case-control study. Lancet 2010; 376: 112-23.
3. Yusuf S, Hawken S, Ounpuu S, Dans T, Avezum A, Lanas F, et al. Efect of potentially modiiable risk factors associated with myocardial infarction in 52 countries (The INTERHEART Study): case-control study. Lancet 2004; 364(9438): 937-52.
4. Brown IJ, Dyer AR, Chan Q, Cogswell ME, Ueshima H, Stamler J, et al. Estimating 24-h urinary sodium excretion from casual urinary sodium concentrations in western populations: The Intersalt Study. Am J Epidemiol 2013; 177(11): 1180-92.
5. Lewington S, Clarke R, Qizilbash N, Peto R, Collins R; Prospective Studies Collaboration. Age-specific relevance of usual blood pressure to vascular mortality: a meta-analysis of individual data for one million adults in 61 prospective studies. Lancet 2002; 360(9349): 1903-13.
6. Aaron KJ, Sanders PW. Role of dietary salt and potassium intake in cardiovascular health and disease: a review of the evidence. Mayo Clinic Proc 2013; 88(9): 987-95.
7. Schachter J, Harper PH, Radin ME, Caggiula AW, McDonald RH, Diven WF. Comparison of sodium and potassium intake with excretion. Hypertension 1980; 2(5): 695-9.
8. Bentley B. A review of methods to measure dietary sodium intake. J Cardiovasc Nurs 2006; 21: 63-7.
9. Mozaffarian D, Fahimi S, Singh GM, Micha R, Khatibzadeh S, Engell RE, et al. Global sodium consumption and death from cardiovascular causes. N Engl J Med 2014: 371(7): 624-34.
10. Mill JG, Silva AB, Baldo MP, Molina MC, Rodrigues SL. Correlation between sodium and potassium excretion in 24- and 12-h urine samples. Braz J Med Biol Res 2012; 45(9): 799-805.
11. Kawasaki T, Itoh K, Uezono K, Sasaki H. A simple method for estimating 24 h urinary sodium and potassium excretion from second morning voiding urine specimen in adults. Clin Exp Pharmacol Physiol 1993; 20(1): 7-14.
12. Tanaka T, Okamura T, Miura K, Kadowaki T, Ueshima H, Nakagawa H, et al. A simple method to estimate populational 24-h urinary sodium and potassium
excretion using a casual urine specimen. J Hum Hypertens 2002; 16(2): 97-103.
13. Mann SJ, Gerber LM. Estimation of 24-hour sodium excretion from spot urine samples. J Clin Hypertens (Greenwich) 2010; 12(3): 174-80.
14. Kawasaki T, Uezono K, Itoh K, Ueno M. Prediction of 24-hour urinary creatinine excretion from age, body weight and height of an individual and its application. Nippon Koshu Eisei Zasshi 1991; 38(8): 567-74.
15. Kesteloot HE, Joossens JV. Relationship between dietary protein intake and serum urea, uric acid and creatinine, and 24-hour urinary creatinine excretion: the BIRNH Study. J Am Coll Nutr 1993; 12(1): 42-6.
16. Forbes GB, Bruining GJ. Urinary creatinine excretion and lean body mass. Am J Clin Nutr 1976; 29(12): 1359-66.
17. Polónia J, Maldonado J, Ramos R, Bertoquini S, Duro M, Almeida C, et al. Estimation of salt intake by urinary sodium excretion in a Portuguese adult population and its relationship to arterial stifness. Rev Port Cardiol 2006: 25(9): 801-17.
18. Bingham SA, Cummings JH. The use of creatinine output as a check on the completeness of 24-h urine collections. Hum Nutr Clin Nutr 1985; 39(5): 343-53.
19. Bland JM, Altman DG. Statistical methods for assessing agreement between two methods of clinical measurement. Lancet 1986; 1(8476): 307-10.
20. Hanneman SK. Design, analysis, and interpretation of method-comparison studies. AACN Adv Crit Care 2008: 19: 223-34.
21. Ji C, Sykes L, Paul C, Dary O, Legetic B, Campbell NRC, Cappuccio FP, et al. Systematic review of studies comparing 24-hour and spot urine collections for estimating population salt intake. Rev Panam Salud Publica 2012; 32(4): 307-15.
22. McLean RM. Measuring population sodium intake: A review of methods. Nutrients 2014; 6(11): 4651-62.
23. Toft U, Cerqueira C, Andreasen AH, Thuesen BH, Laurberg P, Ovesen L, et al. Estimating salt intake in a Caucasian population: can spot urine substitute 24-hour urine samples? Eur J Prev Cardiol 2014; 21(10): 1300-7.
24. Cogswell ME, Wang CY, Chen TC, Pfeifer CM, Elliott P, Gillespie CD, et al. Validity of predictive equations for 24-h urinary sodium excretion in adults aged 18-39 y. Am J Clin Nutr 2013; 98(6): 1502-13.
25. Ji C, Miller MA, Venezia A, Strazzullo P, Cappuccio FP. Comparisons of spot vs 24-h urine samples for estimating population salt intake: validation study in two independent samples of adults in Britain and Italy. Nutr Metab Cardiovasc Dis 2014; 24(2): 140-7.
26. Pires de Sousa AG, Pereira AC, Marquezine GF, Marques do Nascimento-Neto R, Freitas SN, de C Nicolato RL, et al. Derivation and external validation of a simple prediction model for the diagnosis of type 2 diabetes mellitus in the Brazilian urban population. Eur J Epidemiol 2009; 24(2): 101-9.
27. Bisi Molina M del C, Cunha R de S, Herkenhof LF, Mill JG. Hypertension and salt intake in an urban population. Rev Saúde Publica 2003; 37(6): 743-50.
28. Rodrigues SL, Baldo MP, Machado RC, Forechi L, Molina M del C, Mill JG. High potassium intake blunts the efect of elevated sodium intake on blood pressure levels. J Am Soc Hypertens 2014; 8(4): 232-8
29. Whelton PK, Appel LJ, Sacco RL, Anderson CA, Antman EM, Campbell N, et al. Sodium, blood pressure, and cardiovascular disease: further evidence supporting the American Heart Association sodium reduction recommendations. Circulation 2012; 126(24): 2880-9.
30. Rodrigues SL, Souza-Júnior PR, Pimentel EB, Baldo MP, Malta DC, Mill JG, et al. Relationship between salt consumption measured by 24-h urine collection
and blood pressure in the adult population of Vitória (Brazil). Braz J Med Biol Res 2015 ;48(8): 728-35.
31. Kawamura M, Kusano Y, Takahashi T, Owada M, Sugawara T. Efectiveness of a spot urine method in evaluating daily salt intake in hypertensive patients taking oral antihypertensive drugs. Hypertens Res 2006; 29(6): 397-402.
32. Imai E, Yasuda Y, Horio M, Shibata K, Kato S, Mizutani Y, et al. Validation of the equations for estimating daily sodium excretion from spot urine in patients with chronic kidney disease. Clin Exp Nephrol 2011; 15(6): 861-7.
33. Rhee MY, Kim JH, Shin SJ, Gu N, Nah DY, Hong KS, et al. Estimation of 24-hour urinary sodium excretion using spot urine samples. Nutrients 2014; 6(6): 2360-75.
34. Bland JM, Altman DG. Comparing methods of measurement: Why plotting diference against standard method is misleading. Lancet 1995; 346(8982): 1085-87.
Received on: 05/28/2015