Netflix Inc.
Equity Valuation
José Pedro Alves
Dissertation written under the supervision of José Tudela Martins
Dissertation submitted in partial fulfilment of requirements for the MSc in Finance, at the Universidade Católica Portuguesa, 24th of May 2018.
Equity Research Report
Internet & Media 15th of May 2018 Price Target: $239,35 Price (15-05-2018): $328,53 Recommendation: SELL Ticker: NFLX Company Data
Market Cap. ($ million): 141.910 Shares Outstanding (million): 448,1 Free Float (%): 440,32
Price % Change YTD: 68,88% 52-week Range: $144,25 – $338, 82
Morgan Stanley’s Valuation
Recommendation: BUY
Price Target: $275
Price (22-01-2018): $227,58 Stock Price Performance
Netflix Inc.
Netflix is the number one streaming content provider in the world, having over 117,5 million subscribers worldwide. The firm has been able to systematically increase the price of its streaming packages without compromising subscriber growth and has yielded its investors remarkable returns in 2018, with its price per share increasing 68,88% YTD.
A simultaneous growth in price and subscriber base of this order is only possible in a market with minimal competition, which is a consequence of Netflix’s first mover advantage. Naturally, this growth didn’t go unnoticed by the media and technology giants, such as Amazon, Apple, Google, Facebook or Disney, which have shown their interest in expanding their operations into the streaming content business.
Being so, one critical question that poses is whether the market is accurately pricing the threat of competition into Netflix’s stock price or whether it is overvalued as a consequence of this risk being overlooked.
The conclusion of this dissertation is that the market is overlooking this risk and that the Netflix’s stock is overpriced. As a result, the underlying recommendation is that investors should sell this stock.
Abstract
Title: Netflix Inc. Equity Valuation Author: José Pedro Alves
Keywords: Valuation, Discounted Cash-Flow, Multiples
The aim of this dissertation is estimating the fair value of one unit of Netflix’s common stock, at the end of the year 2018. Two valuation methodologies are utilized, the first being the Discounted Cash-Flow (DCF) approach and the second being the relative valuation methodology, being the multiples used the P/E, EV/EBITDA and EV/Sales. The valuation output is then compared to the equity research report of Morgan Stanley on Netflix.
The valuation output is that Netflix is overvalued in the market, being the fair value of one unit of common stock estimated to be $239,35 at the end of 2018, while the stock is trading at $328,53 on the 15th of May 2018. Hence, the recommendation produced in this dissertation is a sell
recommendation. This recommendation is only a function of the DCF approach, since the relative valuation outputs were not consistent across the different multiples used nor with the value computed through the DCF approach. Morgan Stanley estimates the value of one unit of common stock at the end of 2018 to be $275, which is a higher valuation than the one estimated in this dissertation and also yields an opposite recommendation, as Netflix’s stock was trading at $227,58 at the time of valuation. This difference is mainly explained by different assumptions regarding the evolution of Netflix’s FCFFs, as the WACC in both valuations differs only 12 basis points and the perpetual growth rate differs only 17 basis points.
-
Esta dissertação pretende estimar o justo-valor de uma ação da Netflix no final de 2018. Para tal, dois métodos de avaliação são utilizados, sendo o primeiro o método de Discounted Cash-Flow (DCF) e o segundo o método de relative valuation, sendo os múltiplos utilizados o P/E, EV/EBITDA e o EV/Sales. O resultado obtido nesta avaliação é posteriormente comparado com o equity research report produzido pela Morgan Stanley sobre a Netflix.
A avaliação realizada estima que as ações da Netflix estão sobreavaliadas no mercado. O justo-valor de uma ação é estimado ser $239,35 no final de 2018, no entanto, as mesmas estão a ser transacionadas no mercado a 15 de Maio de 2018 por $328,53. Assim, a recomendação produzida é de que os investidores devem vender as ações em questão. Esta recomendação é feita apenas em função do método DCF, dado que os resultados obtidos através da relative valuation são inconsistentes entre os diferentes múltiplos usados e inconsistentes com o resultado obtido através do método DCF. A Morgan Stanley estima o justo-valor de uma ação da Netflix no final de 2018 em $275. Este valor é superior ao estimado nesta dissertação e resulta numa recomendação oposta, dado que, à data da avaliação realizada pela Morgan Stanley, as ações da Netflix transacionavam a $227,58. A diferença entre as avaliações é essencialmente explicada por diferentes pressupostos relativos à evolução dos FCFFs, visto que o WACC e a taxa de crescimento em perpetuidade diferem apenas 12 e 17 pontos base entre as avaliações, respetivamente.
Acknowledgments
The conclusion of this dissertation represents the end of a five-year journey at Católica-Lisbon, in which I completed my BSc in Business Administration and now my MSc in Finance. It is my belief that joining this prestigious school was the right choice for me, as I feel the rigor, hard-work and integrity culture taught during this process has prepared me to face the upcoming challenges of my professional career.
I would like to thank my parents for their unconditional support, not only during the past months, during which this dissertation was completed, but also during the past five years in which I was granted the opportunity to study at a top-tier business school with no concern other than focusing on my studies. I was provided every condition needed to walk this path, for which I am extremely grateful.
Gratitude is also owed to the Dunas Capital investment team, Pedro Fernandes, Pedro Alves and Bernardo Moreira, for the valuable lessons they have taught me during the time I spent interning at the firm, as well as the advice related to the completion of this dissertation.
To my girlfriend and friends I also express my gratitude for helping me maintain a healthy work-life balance during the period of completion of this dissertation, as well as for your support and kind words during the difficult times faced.
At last, I would like to thank Professor José Tudela Martins for his availability and valuable advice.
Table of Contents
1. Introduction ... 1
2. Literature Review ... 2
2.1. Cash-Flow Based Models ... 2
2.2. Discounted Cash-Flow Model (DCF) ... 2
2.2.1. Enterprise Value Methods ... 2
2.2.2. DCF – Weighted Average Cost of Capital (WACC) ... 2
2.2.2.1. Free-Cash Flow to Firm (FCFF) ... 3
2.2.2.2. Weighted Average Cost of Capital (WACC) ... 3
2.2.2.2.1. Cost of Debt (Kd) ... 4
2.2.2.2.2. Cost of Equity (Ke) ... 4
2.2.2.2.2.1. Capital Asset Pricing Model (CAPM) ... 4
2.2.2.3. Terminal Value (TV) ... 5
2.3. Adjusted Present Value Model (APV) ... 5
3. Equity Valuation Models ... 7
3.1. Free Cash-Flow to Equity ... 7
3.2. Dividend Discount Model (DDM) ... 8
3.2.1. Gordon Growth Model ... 8
3.2.2. Two-stage Growth Model ... 8
4. Profitability Models ... 9
4.1. Economic Value Added (EVA) ... 9
4.2. Dynamic Return on Equity Methodology (RoE) ... 10
5. Relative Valuation ... 10
5.1. Peer Group ... 11
5.2. Multiples ... 11
6. Option Pricing Theory ... 13
7. Conclusion ... 13
8. Business Overview ... 15
8.1. Content Sources ... 16
8.3. Consolidated Operating Results ... 18
8.4. Strengths & Opportunities ... 19
8.4.1. Subscriber Base Evolution ... 19
8.4.2. Platform Quality ... 20
8.5. Risks & Threats ... 21
8.5.1. Competition ... 21
8.5.1.1. Pricing Power ... 25
8.5.1.2. Disney-Fox Merge ... 25
9. Net Neutrality ... 26
10. Valuation ... 27
10.1. Discounted Cash-Flow Model - Assumptions ... 27
10.2. Earnings Before Interest and Taxes (EBIT) ... 27
10.2.1.1. Average Monthly Revenue per Paid Subscriber ... 28
10.2.1.2. Market Size ... 29
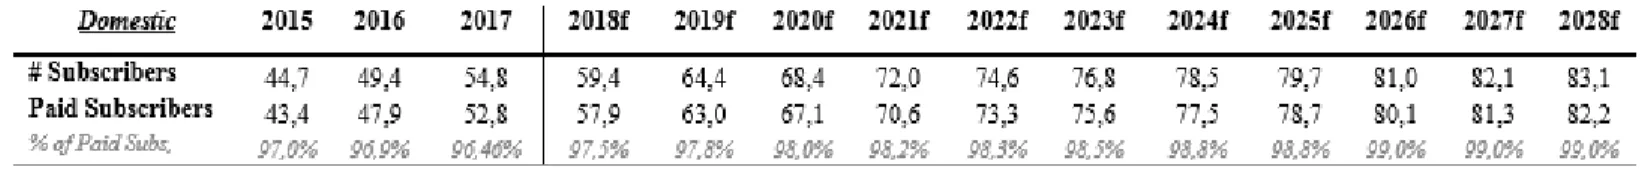
10.2.1.3. Market Penetration ... 29
10.3. Revenue ... 31
10.4 Cost of Revenue ... 31
10.5. Other Operating Costs ... 34
10.5.1. Marketing ... 34
10.5.2. General & Administrative Costs ... 34
10.5.3. Technology & Development ... 35
10.6. Taxes ... 35
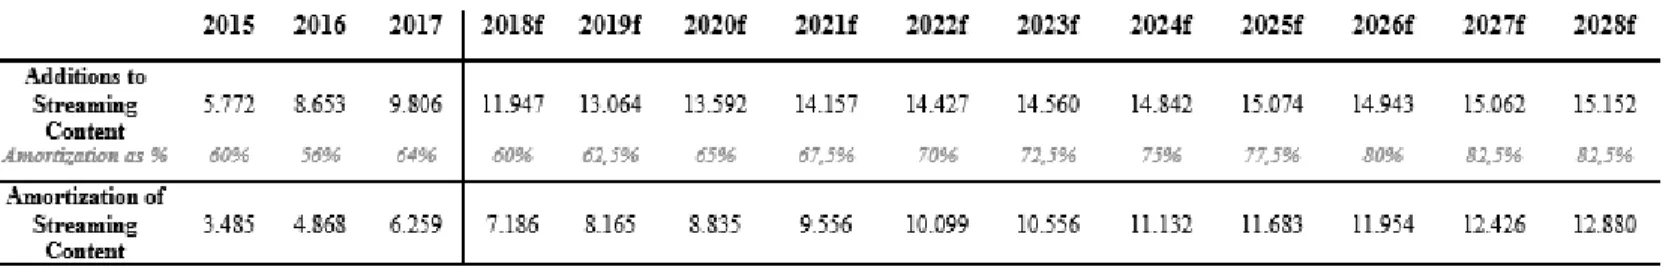
10.7. Streaming Content Expenses ... 36
10.8. Non-Cash Charges ... 36
10.9. Capital Expenditures (CAPEX) ... 36
10.10. Changes in Working Capital ... 37
11. Discounted Cash-Flow – Valuation ... 37
11.1. Free Cash-Flow to the Firm (FCFF) ... 37
11.2. Weighted Average Cost of Capital (WACC) ... 38
11.3. Net Debt ... 38
12. Sensitivity Analysis ... 39
13. Relative Valuation ... 41
13.1. Peer Group Selection ... 41
13.2. Multiples Valuation ... 44
14. Valuation Comparison ... 45
15. Conclusion ... 47
Appendixes ... 48
Appendix 1 – Subscribers and Contribution Profit Evolution per Segment ... 48
Appendix 4 - World Economy Outlook ... 54
Appendix 5 - Subscriber Evolution per Geography and Segment ... 55
Appendix 6 – Revenue and Paid Subscribers * Monthly Revenue per Paid Subscriber * 12 Comparison ... 57
Appendix 7 – Corporate Tax Rate ... 58
Appendix 8 – Equity Risk Premium ... 59
Appendix 9 – Levered Beta Calculation ... 61
Appendix 10 – Cost of Debt and Market Value of Debt ... 63
Appendix 11 – Perpetual Growth Rate ... 65
Appendix 12 – Forecasted Financial Statements ... 67
Table of Figures
Figure 1 – Relative Valuation Multiples………...……….…11
Figure 2 – Business Model……….…………15
Figure 3 – Streaming Packages……….………….……15
Figure 4 – DVD Packages……….……….16
Figure 5 – Revenues per Business Segment (in $ millions) ………...………17
Figure 6 – Netflix Subscriber Evolution and Operating Results (in millions, except Avg. Revenue per subscriber) ………...18
Figure 7 – Gross Margin and Operating Margin Historical Evolution……….………..19
Figure 8 – Netflix Subscriber Base Evolution (in millions) ………..…19
Figure 9 – Subscriber Base Comparison (in millions) ……….……….…22
Figure 10 – Content Expenditure (in $ billions) ………23
Figure 11 – Netflix vs Amazon: Content Expenditure (in $ billions) ……….…..23
Figure 12 – US Monthly Prices Comparison………..…………24
Figure 13 – Average Monthly Revenue per Paid Subscriber ($)………..……….…28
Figure 14 – Forecasted Subscriber Evolution per Operating Segment (in $ million) …..……….30
Figure 15 – Forecasted Revenue per Operating Segment (in $ million) ………..…….31
Figure 16 – Forecasted Additions to Streaming Content (in $ million) ………..……..32
Figure 17 – Forecasted Amortization of Streaming Content (in $ million)…………. …….……33
Figure 18 – Forecasted Cost of Revenue (in $ million) ……….………...33
Figure 19 – Forecasted Marketing Expenditures (in $ million) ……….………...34
Figure 20 – Forecasted General & Administrative Costs (in $ million) ……….……..34
Figure 21 – Forecasted Technology & Development Expenditures (in $ million) ……….……..35
Figure 22 – Forecasted Streaming Content Expenses (in $ million) ……….……….…...35
Figure 23 – Forecasted Corporate Tax Rate (in $ million) ……….……….……..……36
Figure 24 – Forecasted Non-Cash Charges (in $ million) ………..………...36
Figure 25 – Forecasted Capital Expenditures (in $ million) ……….……....36
Figure 26 – Changes in Working Capital (in $ million) ………....37
Figure 28 – Forecasted Weighted Average Cost of Capital (WACC) ……….……….38
Figure 29 – Estimated Net Debt (in $ million) ………..………38
Figure 30 – Estimated Fair Value of Equity………..….…38
Figure 31 – Beta across different periods of analysis………..……...39
Figure 32 – Sensitivity Analysis of WACC and Perpetual Growth Rate (in $, except WACC and Perpetual Growth Rate) ……….40
Figure 33 – Sensitivity Analysis of the main drivers of FCFF……….……..40
Figure 34 – Broad Peer Group………..……..42
Figure 35 – Final Peer Group……….……44
Figure 36 – Multiples Valuation………..……...44
Figure 37 – FCFF Comparison………..….45
Figure 38 – DCF Assumptions Comparison………..………….46
Figure 39 – Recommendations Comparison……….……….46
Figure 40 – Netflix Subscribers and Contribution Profit in the US (in millions, except Avg. Revenue per Paid Sub.) ……….………48
Figure 41 – Netflix Subscribers and Contribution Profit outside the US (in millions, except Avg. Revenue per Paid Sub.) ……….…….…………...49
Figure 42 – Netflix Subscribers and Contribution Profit for DVDs (in millions, except Avg. Revenue per Paid Sub.) ……….……50
Figure 43 – Broadband Homes Evolution (in millions) ………...…….52
Figure 44 – Penetration of Broadband Homes Evolution (in %)……….………..53
Figure 45 – Subscriber Evolution per Geography and Segment (in millions) ……….……….…55
Figure 46 – Revenue and Paid Subscribers*Monthly Revenue per Paid Subscriber*12 Comparison………...57
Figure 47 – Corporate Tax Rate per Country……….…58
Figure 48 – Equity Risk Premium per Country………..…59
Figure 49 – Estimated 5Y Beta………...62
Figure 50 – Interest Coverage Ratios and Ratings: High Market Capitalization Firms…..……...63
Figure 51 – Market Value of Debt Computation……….……...64
Figure 52 – Perpetual Growth Rate………..……..65
Figure 54 – Forecasted Balance Sheet………..……..68 Figure 55 – Forecasted Cash-Flow Statement………....69
1
1. Introduction
Every rational investor’s aim is to maximize the value of its investments. In order to do so, investors attempt to make informed, wise decisions, based on unbiased and thrust worthy data and studies. The objective of this dissertation is to provide such a study, specifically, an equity valuation on a well-known firm for every teenager and young adult, Netflix Inc. Therefore, the research question this thesis aims to answer is: what is the fair value of one unit of Netflix’s common stock, at the end of the year 2018?
This study is of the highest importance as the whole stock market system is based upon equity valuation. From an investor’s point of view, since stock prices fluctuate every minute, especially with the development of information channels, it is more important than ever to understand which price movements are associated with the firm’s potential to create value and the ones that are speculative or market over reactions. From a firm point of view, a proper equity valuation enables firms with sound business models to command a premium in the market, while those with weak fundamentals see their prices dropping over the long-term.
This dissertation starts with the Literature Review, in which the most relevant equity valuation models are presented, alongside with an explanation of their applicability, advantages and drawbacks. The second stage consists of an overview of Netflix’s business, highlighting its business model and operating performance over the recent past as well as its strengths and the risks it faces. On the third stage the methods that are considered the most suitable to evaluate the company are applied and the last stage consists of the comparison of the valuation built on this dissertation with the equity research report produced by Morgan Stanley on Netflix.
This project is not, however, free of limitations, as equity valuation is not an exact science. The process of valuing a firm is long, subjective and there is no recipe or pre-defined standard process generally accepted by all for valuing a firm. Furthermore, during this dissertation it was not possible to contact anyone from Netflix to access any additional information, which also consists of a limitation to this study.
2
2. Literature Review
2.1. Cash-Flow Based Models
Cash-flow based models are widely used and perceived as accurate and trustworthy. This dissertation will follow with a description of what cash-flows are and how they can be used to value an asset.
2.2. Discounted Cash-Flow Model (DCF)
The DCF valuation model, invented in the 1970’s, came to be used in any corporate asset
valuation process (Luehrman, 1997). It is the most commonly used method among investment banks when evaluating firms and projects, as it is considered a precise and flexible method (Koller, et al., 2005).The premise behind this model is that the value of a firm derives from free cash-flows. As a result, cash movements are key in this type of valuation (Goedhart, et al., 2010).
In order to perform this valuation, we need to estimate, as precisely as possible, three variables:
future cash-flows, the discount rate and the terminal value. By doing so, we can then determine the value of an asset, in our case, a firm, by the present value of the future expected cash-flows, discounted at a risk-adjusted rate (Damodaran, 2005)
The Discounted Cash-Flow methodology allows us to either estimate the value of the whole firm, known as Enterprise Valuation Methods, or to estimate the value of a firm’s equity.
2.2.1. Enterprise Value Methods
There are two cash-flow based methods that allow investors to evaluate entire enterprises: the Discounted Cash-Flow method, using the WACC as the discount rate and the Adjusted Present Value (APV) method.
2.2.2. DCF – Weighted Average Cost of Capital (WACC)
𝐸𝑛𝑡𝑒𝑟𝑝𝑟𝑖𝑠𝑒 𝑉𝑎𝑙𝑢𝑒 = ∑ 𝐹𝐶𝐹𝐹𝑡 (1 + 𝑊𝐴𝐶𝐶)𝑡 𝑡=𝑛 𝑡=1 + 𝑇𝑒𝑟𝑚𝑖𝑛𝑎𝑙 𝑉𝑎𝑙𝑢𝑒 (1 + 𝑊𝐴𝐶𝐶)𝑡
3 In this valuation method, the value of the firm is computed by discounting the future expected cash-flows at the risk-adjusted rate, which, in this case, is the WACC. However, since it is impossible to estimate all cash-flows ad infinitum, computing the Terminal Value is also necessary. The explanation of each parameter of the formula above follows.
2.2.2.1. Free-Cash Flow to Firm (FCFF)
𝐹𝐶𝐹𝐹 = 𝐸𝐵𝐼𝑇(1 − 𝑇) + 𝑁𝑜𝑛 𝐶𝑎𝑠ℎ 𝐶ℎ𝑎𝑟𝑔𝑒𝑠 − 𝐶𝐴𝑃𝐸𝑋 − ∆𝑁𝑊𝐶 (Pinto, 2010) defines FCFF as “the part of the cash-flow generated by the company’s operations that can be withdrawn by bondholders and stockholders without economically impairing the company”. It is formally defined as a measure of performance, based on the net amount of cash generated by a company, including expenses, taxes, investments for the year and variations in working capital, as shown above. FCFF reflects all the cash-flows available for all financial parties.
2.2.2.2. Weighted Average Cost of Capital (WACC)
𝑊𝐴𝐶𝐶 = 𝐷
𝐷 + 𝐸∗ 𝐾𝑑 ∗ (1 − 𝑇) + 𝐸
𝐷 + 𝐸 ∗ 𝐾𝒆
(Gilbert, 1990) defines a discount rate as “the rate of return an investor would require to be induced to invest in the cash-flow stream being discounted”, meaning, the rate that fairly compensates the cash-flow risk taken by the investor. In this approach, that discount rate is the WACC, which combines the required return by the company’s debt and equity holders (Goedhart, et al., 2010).
The WACC is a weighted average of two different variables, the first being the cost of debt (Kd) and the second being the cost of equity (Ke). What produces the weights is the underlying firm capital structure. The tax rate is included in the formula to allow the WACC to measure the impact of leveraging a firm, the tax shields (Luehrman, 1997). (Fernandez, 2010) thus defines the WACC as being neither a cost nor a required return, but a weighted average of both.
4
2.2.2.2.1. Cost of Debt (Kd)
Cost of debt measures the effective rate that a firm has to pay for its current debt. On the WACC computation it is considered the after-tax cost of debt. The reason for this lies on the fact that interest payments are a tax-deductible expense. (Goedhart, et al., 2010) states that analysts should compute this cost in different ways, depending on the different types of firms being analyzed. The author suggests that, for firms with publicly traded debt, analysts should consider the cost of debt to be equal to the Yield to Maturity (YTM), computed by the present value of the bond price and the promised cash-flows. However, if the firm’s debt is not traded often, the author suggests that the firm’s debt rating is used instead, as to produce a more accurate estimation of the YTM, using the firm’s marginal tax rate to keep the cost of debt on an after-tax basis. (Damodaran, 2001) states that, for firms without rating, a good estimate of their cost of debt would be computing the firms’ interest coverage ratio, since it puts more emphasis on the borrowings incurred in a recent past.
2.2.2.2.2. Cost of Equity (Ke)
According to (Goedhart, et al., 2010), the cost of equity can be derived from the Fama & French 3 Factor Model, the Arbitrage Pricing Theory (APT) and Capital Asset Pricing Model (CAPM) (Sharpe, 1964). (Damodaran, 2001) argues that the CAPM is the most commonly used method in the industry to reach the cost of equity.
2.2.2.2.2.1. Capital Asset Pricing Model (CAPM)
𝐸(𝑅𝑖) = 𝑟𝑓 + 𝛽𝑖 ∗ [𝐸(𝑅𝑚) − 𝑟𝑓]
In this model, first proposed by (Sharpe, 1964), the cost of capital can be seen as a function of risk determined by three variables: the risk-free rate (rf), beta (β) and the market risk-premium, which is the difference between the market return (Rm) and the risk-free rate (rf). Beta is the only firm specific factor within the model, as it determines the degree of correlation of a firm with the market itself (Goedhart, et al., 2010). Beta cannot be reduced by diversification.
5
2.2.2.3. Terminal Value (TV)
It is not possible to estimate all cash-flows ad infinitum. As a result, analysts must decide on the forecasted timeline, also known as explicit period, which is understood by the time a firm takes to reach a steady growth rate. Analysts’ explicit period tends to range between six and ten years, but this value can vary a lot depending on firm specificities. The next step consists of calculating the firm’s terminal value, i.e., calculating the firm value, in perpetuity, beyond the explicit period. (Damodaran, 2012) suggests three different approaches to estimate terminal value: liquidation value, multiples and stable growth model. The liquidation value approach estimates that the terminal value equals the estimated value of the sale of all the firm’s assets after repaying the debt. The multiples methodology considers that the value of the firm will be a multiple of its future earnings or book value. The third, and by far the most commonly used, the stable growth model, assumes that, after the explicit period, the firm will be growing at a stable growth rate which should be lower than the growth rate of the economy in which the firm operates. According to this last model, the terminal value of a firm goes by:
𝑇𝑒𝑟𝑚𝑖𝑛𝑎𝑙 𝑉𝑎𝑙𝑢𝑒𝑡 = 𝐹𝑟𝑒𝑒 𝐶𝑎𝑠ℎ 𝐹𝑙𝑜𝑤𝑡+1
𝐶𝑜𝑠𝑡 𝑜𝑓 𝐶𝑎𝑝𝑖𝑡𝑎𝑙 − 𝑃𝑒𝑟𝑝𝑒𝑡𝑢𝑎𝑙 𝐺𝑟𝑜𝑤𝑡ℎ 𝑅𝑎𝑡𝑒
Finally, it is vital to refer the importance of the Terminal Value. (Schill, 2013) states that it is usually the largest component of value of a firm, representing, on average, between fifty and eighty percent of the total firm value, depending on how many years we have in annual forecasts.
2.3. Adjusted Present Value Model (APV)
Even though the WACC is highly practical, keeping the calculations required to a minimum, it comes with drawbacks. The most common criticism to the WACC, presented by (Luehrman, 1997), is that it is applicable only to simple and static capital structures and that its application requires not only project by project, but also period by period adjustments, even within each project.
Given the drawbacks regarding the DCF-WACC methodology, another method emerges that also has acceptance among the literature: the Adjust Present Value Model.
𝐸𝑛𝑡𝑒𝑟𝑝𝑟𝑖𝑠𝑒 𝑉𝑎𝑙𝑢𝑒 = ∑ 𝐹𝐶𝐹𝐹𝑡 (1 + 𝑅𝑒)𝑡 𝑡=𝑛
𝑡=1
6 According to this methodology, as shown on the formula above, the value of a firm is computed discounting its FCFF at the Cost of Equity (Re), adding the present value of the expected tax benefit of debt financing, also known as Tax Shield (TS), and subtracting the expected costs of bankruptcy associated with debt financing, also known as financial distress costs (FD costs).
The first step of this methodology is, therefore, the calculation of the Unlevered Firm Value, i.e., valuing the firm as if it was financed exclusively using equity (Damodaran, 2012).
The second step consists of measuring the benefit resulting from debt financing.
𝑃𝑉 (𝑇𝑎𝑥 𝑆ℎ𝑖𝑒𝑙𝑑𝑠) = ∑𝐼𝑛𝑡𝑒𝑟𝑒𝑠𝑡 ∗ 𝑇𝑎𝑥 𝑅𝑎𝑡𝑒 (1 + 𝑅𝑑)𝑡 + 𝑇𝑒𝑟𝑚𝑖𝑛𝑎𝑙 𝑉𝑎𝑙𝑢𝑒 (1 + 𝑅𝑑)𝑡 𝑡=𝑛 𝑡=1
Finally, regarding the third step, the expected costs of bankruptcy, (Damodaran, 2005) suggests that it is computed as follows:
𝐸(𝐵𝑎𝑛𝑘𝑟𝑢𝑝𝑡𝑐𝑦 𝐶𝑜𝑠𝑡𝑠) = 𝑃𝑟𝑜𝑏𝑎𝑏𝑖𝑙𝑖𝑡𝑦 𝑜𝑓 𝐷𝑒𝑓𝑎𝑢𝑙𝑡 ∗ 𝐵𝑎𝑛𝑘𝑟𝑢𝑝𝑡𝑐𝑦 𝐶𝑜𝑠𝑡𝑠
(Graham, 2001) states that the optimal amount of debt varies from firm to firm. According to the author a firm should issue debt as long as the benefits of this issuance outweigh its costs. The third equation of this process estimates the costs associated with financial distress, which occurs when payment promises to creditors are broken or honored with difficulty (Brealey, et al., 2011). This equation is the one there is the most lack of consensus about. (Damodaran, 2005) argues that it is the larger issue with the APV methodology, as bankruptcy costs represent a vast portion of the valuation and they are difficult to quantify. Regarding the first term, probability of default, (Damodaran, 2012) suggests using publicly traded bond ratings as a proxy for the probability of default. In respect to the second term, the bankruptcy costs, (Damodaran, 2005) splits these costs into direct costs, composed by legal and administrative costs, and indirect costs, such as brand damage, loss of key employees of costumers or loss of investment opportunities. (Branch, 2002) suggests that these costs should be about 28% of the pre-distressed company’s value.
7
3. Equity Valuation Models
There are two cash-flow based methods that allow investors to measure the value of equity of enterprises: discounting the Free Cash-Flow to Equity (FCFE) at the Cost of Equity method and the Dividend Discount Model (DDM).
3.1. Free Cash-Flow to Equity
𝑉𝑎𝑙𝑢𝑒 𝑜𝑓 𝐸𝑞𝑢𝑖𝑡𝑦 = ∑ 𝐹𝐶𝐹𝐸𝑡 (1 + 𝑅𝑒)𝑡+ 𝑇𝑒𝑟𝑚𝑖𝑛𝑎𝑙 𝑉𝑎𝑙𝑢𝑒 (1 + 𝑅𝑒)𝑡 𝑡=𝑛 𝑡=1
The reasoning behind this method is exactly the same as the one of the FCFF. The expected
future cash-flows are being discounted at the risk-adjusted discount rate. In this case, the discount rate is the cost of equity, since it is the required return investors demand for bearing the risk associated with the firm’s equity. Just as previously explained, since the estimation of the future cash-flows is impossible ad infinitum, calculating the terminal value is once again necessary.
𝐹𝐶𝐹𝐸 = 𝐹𝐶𝐹𝐹 − 𝐼𝑛𝑡𝑒𝑟𝑒𝑠𝑡 ∗ (1 − 𝑡) + ∆𝑁𝑒𝑡 𝐷𝑒𝑏𝑡
One way to compute the FCFE is by, following the steps in the formula, converting the FCFF into the FCFE. In theory, due to the direct relations between the two methods, the equity value of a firm should be the same applying either method. In reality, however, the values usually marginally differ from one another.
Alternatively, one may compute the FCFE directly by applying the following formula: 𝐹𝐶𝐹𝐸 = 𝑁𝑒𝑡 𝐼𝑛𝑐𝑜𝑚𝑒 + 𝑁𝑜𝑛 𝐶𝑎𝑠ℎ 𝐶ℎ𝑎𝑟𝑔𝑒𝑠 − 𝐶𝐴𝑃𝐸𝑋 − ∆𝑁𝑊𝐶 + ∆𝑁𝑒𝑡 𝐷𝑒𝑏𝑡 (Pinto, 2010) argues that an analyst should choose the FCFF approach if a firm is levered, has a negative FCFE or a changing capital structure, due to the fact that the cost of equity is more sensible to changes in the capital structure.
8
3.2. Dividend Discount Model (DDM)
The Dividend Discount Model (DDM) is the oldest of all valuation methods. (Damodaran, 2012) describes this method as one that evaluates a business such that the value of a stock is the present value of the expected dividends on it.
The price per share of a company is simply the value of the expected future dividend payments discounted at the cost of equity (Re). The complexities of this model come from the need to estimate the future dividends the firm will pay as well as the rate at which these will grow. In order to tackle this problem, one of two paths is usually taken: the Gordon Growth Model or the Two-stage Growth Model.
3.2.1. Gordon Growth Model
𝑃𝑟𝑖𝑐𝑒 𝑝𝑒𝑟 𝑆ℎ𝑎𝑟𝑒 = 𝐸(𝐷𝑖𝑣𝑖𝑑𝑒𝑛𝑑 𝑝𝑒𝑟 𝑆ℎ𝑎𝑟𝑒𝑡+1) 𝑅𝑒 − 𝑃𝑒𝑟𝑝𝑒𝑡𝑢𝑎𝑙 𝐺𝑟𝑜𝑤𝑡ℎ 𝑅𝑎𝑡𝑒
The underlying assumption of this model is that the dividend a firm pays will grow at a fixed rate in perpetuity. (Damodaran, 2012) states that the usage of this model only makes sense for firms that are growing at a stable pace. Furthermore, (Pinto, 2010) notes that this method is extremely sensitive to the inputs for the discount rate (the cost of equity and the growth rate), making this method extremely exposed to valuation errors.
3.2.2. Two-stage Growth Model
𝑃𝑟𝑖𝑐𝑒 𝑝𝑒𝑟 𝑆ℎ𝑎𝑟𝑒 = ∑𝐸(𝐷𝑖𝑣𝑖𝑑𝑒𝑛𝑑 𝑝𝑒𝑟 𝑆ℎ𝑎𝑟𝑒𝑡) (1 + 𝑅𝑒)𝑡 𝑡=𝑛 𝑡=1 + 𝑇𝑒𝑟𝑚𝑖𝑛𝑎𝑙 𝑉𝑎𝑙𝑢𝑒 (1 + 𝑅𝑒)𝑡
Alternatively, the two-stage growth model allows analysts to incorporate two different “stages” of dividend growth forecasts in the model, i.e., one may estimate a dividend growth rate for the near future and another the growth rate for the dividends to grow at in perpetuity. This model is an improvement from the Gordon Growth Model in the sense that it allows analysts to adapt it to shocks that may occur before the firm becomes stable.
9
4. Profitability Models
The line of thought behind these models is that the value created by a firm does not come from
the fact that it generates positive earnings, but rather from the fact that it generates earnings that are superior to the required return on the capital invested. As a result, cash-flows are split into two categories: normal cash-flows, those the investor expects and requires upon making an investment, and excess cash-flows, those that surpass the required return on capital. As a result, (Damodaran, 2012) states that the value of a firm can be expressed by the sum of the capital invested today and the present value of excess returns from existing and future projects. The two models that follow, the Economic Value Added Model (EVA) and the Dynamic Return of Equity (ROE) are the most popular within this category.
4.1. Economic Value Added (EVA)
The EVA methodology is an enterprise value methodology. The first step towards the usage of this model consists of defining EVA.
𝐸𝑉𝐴 = (𝑅𝑒𝑡𝑢𝑟𝑛 𝑜𝑛 𝐼𝑛𝑣𝑒𝑠𝑡𝑒𝑑 𝐶𝑎𝑝𝑖𝑡𝑎𝑙 − 𝑊𝐴𝐶𝐶) ∗ 𝐼𝑛𝑣𝑒𝑠𝑡𝑒𝑑 𝐶𝑎𝑝𝑖𝑡𝑎𝑙
As depicted above, EVA consists of the excess return on invested capital over the required return on capital (the WACC). In order to generate economic profit, the Return on Invest Capital (ROIC) should be higher than the WACC.
𝐸𝑛𝑡𝑒𝑟𝑝𝑟𝑖𝑠𝑒 𝑉𝑎𝑙𝑢𝑒 = 𝐼𝑛𝑣𝑒𝑠𝑡𝑒𝑑 𝐶𝑎𝑝𝑖𝑡𝑎𝑙 + ∑𝐸𝑉𝐴𝑡 𝑎𝑠𝑠𝑒𝑡𝑠 𝑖𝑛 𝑝𝑙𝑎𝑐𝑒 (1 + 𝑊𝐴𝐶𝐶)𝑡 𝑡=𝑛 𝑡=1 + ∑𝐸𝑉𝐴𝑡 𝑓𝑢𝑡𝑢𝑟𝑒 𝑝𝑟𝑜𝑗𝑒𝑐𝑡𝑠 (1 + 𝑊𝐴𝐶𝐶)𝑡 𝑡=𝑛 𝑡=1
In order to compute the enterprise value of the firm, one must follow the formula above, suggested by (Damodaran, 2012). As shown, the value of the firm derives from the sum of the invested capital in assets, the present value of the EVA of these same assets and the EVA of future projects.
10
4.2. Dynamic Return on Equity Methodology (RoE)
The Dynamic RoE methodology is similar to the EVA methodology, being the major difference regarding the interpretation of the output. While the first method provides an enterprise value of the firm, the second provides the value of equity.
𝐸𝑞𝑢𝑖𝑡𝑦 𝑉𝑎𝑙𝑢𝑒 = 𝐸0∗ ∑𝐸𝑡−1∗ (𝑅𝑜𝐸𝑡− 𝑅𝑒) (1 + 𝑅𝑒)𝑡 𝑡=𝑛
𝑡=1
As we can see from the formula above, the underlying logic here is similar to the one explained in the EVA methodology: there will be value creation if the return on equity is higher than the cost of equity.
Both profitability models analyzed are essentially built on accounting-based data. If the inputs of the model are not accurately reported, the underlying valuations will be poor and misleading. Furthermore, these models are more often used for short-term forecasting horizons, opposite to the cash-flow based methods.
5. Relative Valuation
The objective in this type of valuation is not to determine a firm’s intrinsic value, but rather to comprehend its position in relation to its peers. (Damodaran, 2012) states that it is a simple approach and its results are easier to interpret for all stakeholders than the ones from a DCF analysis.
“Properly executed, such an analysis can help a company to stress-test its cash-flow forecasts, to understand mismatches between its performance and that of its competitors, and to hold useful discussions about whether it is strategically positioned to create more value than other industry players are” (Goedhart, et al., 2010).
A relative, or multiples valuation, consists essentially of a two steps process, the first one being the selection of a peer group and the second deciding which multiples to use.
11
5.1. Peer Group
The selection of a proper peer group is not an easy task, as it is not clear at which point should a company be considered “similar” to another.
(Damodaran, 2005) suggests that the firms from the peer group should belong to the same industry. The underlying assumption is that firms in the same sector are exposed to the same risks, growth and cash-flows. Finding such firms is not easy, therefore, there are other variables that could be considered, such as betas, earnings per share (EPS) or return on equity.
(Koller, et al., 2005) argues that the selection of the peers should lie essentially on statistics, such as Return on Invested Capital (ROIC) and long-term growth rates. Sometimes, however, such information is not available. According to the author, the process of selecting the right peer group is the one that distinguishes veteran analysts from newcomers. In order to do so successfully the author recommends that, after getting a preliminary list of the firms that operate in the industry, the analyst should proceed to study what are the reasons that explain the different multiples across the peer group. The analyst should fully understand the firm’s operations and financial specificities and only then will he be able to create an adequate peer group, which will provide a much better valuation than the simple average of many firms within the industry would.
5.2. Multiples
In respect to the second point, the multiples to use, (Fernandez, 2002) offers a wide range of multiples that can be used to value a firm on a relative basis.
Among the multiples above, according to the author, the most popular are the Price to Earnings Ratio (P/E) and the EV/EBITDA. The popularity of the first comes from its simplicity on relative
Source: (Fernandez, 2002)
12 valuation or even on pricing Initial Public Offerings (IPO) (Damodaran, 2012). Other advantages are the fact that the P/E ratio links the firm value to profits and it also takes into account risk and EPS growth. (Koller, et al., 2005) identifies two drawbacks to the usage of this ratio. The first is the fact that it is dependent on capital structure. Managers can intentionally increase the P/E ratio by replacing debt with equity. The second is the fact that it is earnings based, meaning that it may include one-time events such as write-offs, and other non-operating items. Moreover, many firms have negative EPS, making the ratio useless to them.As a result, this ratio should be used for stable firms, with small growth and where big changes are not expected.
Enterprise value multiplies, such as EV/EBITDA or EV/EBIT, are very popular as well since they measure the corporation capacity to have a positive cash-flow. Both ratios perform an asset valuation, therefore, to find equity value net debt must be deducted. With the assumption that the market value of debt can be priced with reliability, one can even assess the correct value for equity by this multiple (Pinto, 2010). (Liu, et al., 2002) states that enterprise value multiples yield more precise pricing than the P/E ratio since the first minimizes the problem related to the different capital structures. However, enterprise multiples have flaws of their own, by not including or reflecting variations that can happen either by changes in working capital requirements or capital expenditures (Fernandez, 2002).
Multiples can be divided into three groups: current, trailing and forward. (Liu, et al., 2002) and (Kim & Ritter, 1999) recommend the usage of forward-looking multiples, due to increased valuation accuracy. (Koller, et al., 2005) also recommends the usage of forward multiples, rather than historical multiples. The author suggests that only if there are no reliable forecasts available should one use historical data and, if doing so, the data used should be as recent as possible and one-time events should be eliminated.
At last, it is important to notice that multiples can be misleading. Managers and CEO’s are aware that multiples are a very important tool used by the market to value their businesses, for which it is in their interest to manipulate the numbers.
13
6. Option Pricing Theory
(Damodaran, 2012) states that option pricing theory can be useful to evaluate assets whose value varies depending on the intrinsic characteristics of options, such as a finite lifetime and value dependence on an underlying, and cannot be reached conventionally. As a result, it is used essentially to value oil, gas or mining companies, as their value is based upon the decision of drilling, or mining.
There are two models to value assets within this methodology: the Black & Scholes model and the binomial model. (Luehrman, 1997) defends the usage of the Black & Scholes model rather than the binomial as it shares more inputs with the DCF methodology, which allows for a more logic comparison between the two. (Goedhart, et al., 2010) states that option pricing theory can be useful as a complement to other methodologies and that it should not be used in isolation.
7. Conclusion
Equity valuation is not an exact science. Resulting, there are several methods to evaluate the value of a business and no consensus among analysts as to which is the best. After the overview presented, regarding the different methods used across the industry, it is now time to select those that best fit Netflix’s specificities.
The first method presented, the DCF-WACC, will be the main method used to evaluate Netflix. As previously mentioned, (Luehrman, 1997) states that this method is ideally applicable for firms with static capital structures, which is the case of Netflix. The firm’s investor relations department stated that it will continue to finance its growth thought debt, as it is more efficient than issuing equity, given the low market interest rates and the tax deductibility of debt. Moreover, the company’s debt to equity ratio, in market values, is extremely low, 5,85% in 2017, for which the company does not expect to face financial distress costs even with some increase in its leverage. The dividend discount model will not be used as Netflix does not pay nor ever paid a dividend to its shareholders.
The returns based models described will also not be used to value Netflix as they are essentially accounting based and their acceptance is not universal.
14 Option Pricing Theory also does not apply to Netflix as its assets do not have the intrinsic characteristics of options, such as a finite lifetime and value dependence on an underlying.
At last, relative valuation will be used as a complement to the DCF methodology. Three multiples will be used. The first being the P/E multiple, the most widely used multiple according to (Fernandez, 2002). Despite the fact that this multiple yields the best results when applied to stable firms, with small growth and where big changes are not expected, this is a straightforward multiple to use, which is easy to understand by every party. Moreover, as the firm’s capital structure is not expected to change significantly in the future, the results from this multiple are expected to be reasonable. The two other multiples to be used will be enterprise value multiples: EV/EBITDA and EV/Sales. The EV/EBITDA is considered appropriate to measure Netflix’s value as the costs added back to the firm’s earnings, depreciations, amortizations, taxes and interest, do not truly reflect the costs of operating the business. Taxes are a function of tax rule and therefore unrelated to the profitability of the business. Interest payments are based on the firm’s financing rather than how it is managed and depreciations and amortizations are based on the management D&A policies, hence subjective. Moreover, using EV multiples allow the comparison of businesses with different capital structures, which is important given that Netflix’s peer group has companies that are very different from one another both in terms of business models and leverage policies. At last, the EV/Sales multiple will be also used. Unlike earnings, which are heavily influenced by accounting decisions on depreciation and amortization, R&D and extraordinary charges, revenue is relatively difficult to manipulate. Moreover, sales multiples are not as volatile as earnings multiples, making this multiple reliable for usage in valuation. The multiples used in this valuation will be forward multiples, as suggested by (Liu, et al., 2002), (Kim & Ritter, 1999) and (Koller, et al., 2005).
15
Fig. 3 – Streaming Packages 8. Business Overview
Netflix is a provider of streaming media services through which subscribers can access a wide range of television shows and movies over the internet. As depicted above, Netflix generates revenue from two sources, video content streaming services and DVD-by-mail services.
Both are subscription based businesses. Using the first, subscribers pay a fixed monthly fee to access and stream as much content as they would like to watch. The content is available on a multitude of screens, among which smartphones, PCs, MACs, tablets, TV set-top boxes and Smart TVs are the most popular. Netflix offers three possible packages for this service.
These packages are the same across all the markets Netflix operates at. The price does change, ranging from $7,99 to $13,99 in the US and from the US dollar equivalent of approximately $4 to $20 outside the US. The standard package is the most popular choice for new memberships.
Using the second, DVD-by-mail, subscribers pay a monthly fee to be able to rent DVDs and Blu-Rays online and have them delivered to their place. Despite being one single firm, the DVD segment a totally separated from the streaming business: it has its own website, management team, benefits package for employees and headquarters.
Source: Netflix Annual Report 2017 Source: revenuesandprofits
16 This service is only available on the US, being the prices on the table are the only ones practiced.
8.1. Content Sources
Netflix gets content from two sources, licensing agreements and development of original content. A licensing agreement consists of a written agreement under which the creator of the content gives Netflix permission to use that property under specified parameters. Through this source of content, Netflix has been both acquiring long-tail content, from studios, at relatively cheap prices to build the size of its content offering and more expensive content to attract mainstream costumers from traditional entertainment sources. Historically, this was the model Netflix based its business upon. It was advantageous for studios given that it allowed them to have an alternative revenue stream to the traditional windows. However, with the increasing popularity of streaming services, studios have started noticing cannibalization of their standard revenue streams. As a consequence, studios started being less willing to license content to Netflix at reasonable prices. Furthermore, by only using content from third parties, Netflix would find itself with no chance of having more valuable content than its competitors, as content developers can license their content to plenty of distributors.
Faced with these issues, Netflix has recently shifted its strategy towards the development of original content, in place of further investing into increasingly expensive licensing deals. In this field, its strategy can be broken down into three pieces. The first being the creation of content based on prior intellectual property, such as developments or continuations of old stories beloved by the public, which is a low risk investment in original content. The second being betting on brand new original content to clearly distinguish itself from its competition and the third the creation of
Source: Netflix Annual Report 2017 Fig. 4 – DVD Packages
17 original content specific to a certain geography, to capture that audience and further expand their influence abroad.
This recent focus of Netflix on the development of original content has issues of its own. Filmmakers usually desire to see their productions debut on “the big screen”, which has not been the destination of Netflix’s originals. Furthermore, Netflix does not share with the actors and producers the upside of a hit the same way a traditional studio does, as there are no box office revenues nor syndication revenues to share, i.e., whether the show is watched by 50 million people of 50 people, the staff does not get their share of the proceeds. This policy makes it very difficult for Netflix to capture talent in the competitive cinematographic industry.
8.2. Business Segment Evolution
Netflix has three revenue streams: Domestic Streaming, referring to the content streaming service in the US market; International Streaming, referring to the content streaming service outside the US market and Domestic DVD, referring to the DVD-by-mail services in the US.
Figure 5 illustrates Netflix’s revenue per business segment from 2015 to 2017. Netflix’s Domestic Streaming segment contributed to 53% of the firm’s revenue in 2017, therefore being the largest source of revenue. This segment has, however, been decreasing in relative importance. It corresponded to 62% of total revenue in 2015 and, in 2017, it only amounted to 53%. Regarding
Source: Netflix Annual Report 2017
4.180 5.077 6.153 1.953 3.211 5.089 645 542 451 3.000 6.000 9.000 12.000 2015 2016 2017
Domestic Streaming International Streaming Domestic DVD
18 International Streaming, it is the sector with the largest growth, increasing its weight on Netflix’s revenues from 29% in 2015 to 44% in 2017. At last, the Domestic DVD is the only sector whose revenue has been decreasing in both absolute and relative terms. Its weight was of about 9% in 2015 and it fell to 4% in 2017.
8.3. Consolidated Operating Results
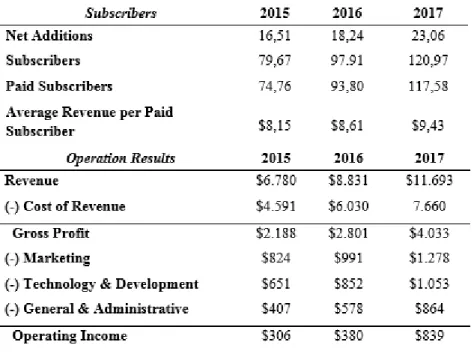
Global subscribers to Netflix’s services, streaming and DVD-by-mail, has achieved over 117,5 million in the end of 2017. This growth has been driven by the acquisition of domestic and international subscribers, having Netflix acquired over 18 million international subscribers and over 5 million subscribers in the US in 2017 alone. The growth in the average revenue charged is explained by changes in plan mix and prices both in the US and abroad. Both these effects have been negatively affected by the DVD segment, in which the subscriber base and the average revenue charged per client have decreased.
Consolidated revenues increased by 32% from 2016 to 2017, driven by the growth in revenues registered in both the domestic and international segments.
Fig. 6 – Netflix Subscriber Evolution and Operating Results (in millions, except Avg. Revenue per subscriber)
19 Figure 7 depicts that, despite the great increase in revenues from 2015 to 2016, both the gross margin and the operating margin decreased year-on-year, as a consequence of the aggressive expansion plan of Netflix and all its inherent costs. In 2017, both metrics have increased as revenue growth outpaced the growth in costs. The analysis of each individual segment, domestic, international and DVD-by-mail can be found in Appendix 1.
8.4. Strengths & Opportunities 8.4.1. Subscriber Base Evolution Fig. 8 – Netflix Subscriber Base Evolution (in millions)
Sources: Business Insider
34,5% 31,7% 32,3% 7,2% 4,3% 4,5% 00% 10% 20% 30% 40% 2017 2016 2015
Gross Margin Operating Margin
Source: Netflix Annual Report 2017
20 Netflix’s most valuable asset is its subscriber base, as it is the driver that allows the firm to generate revenues. The subscriber growth rate has been particularly impressive in the International segment, boosted by Netflix’s aggressive growth strategy, its investment in creating content in languages other than English, having content in over 24 languages, and its free first month subscription policy. Moreover, the company believes it will continue adding more subscribers as the trend for binge watching grows in popularity.
Chasing its goal of being the world leader content provider, Netflix is working not only on increasing its subscriber base but also on having a widely diverse one. To do so, the firm is undertaking initiatives such as creating more kids and family-oriented content. Moreover, in order to tackle the talent acquisition issues previously mentioned, in late 2016, Netflix stroke a deal with iPic Entertainment. According to the deal, Netflix originals will debut on iPic Entertainment theaters at the same time the movies are released online (Roettgers, 2017). The underlying logic is that this exposure improves Netflix’s ability to capture talent, as the movies will now appear on the big screen as it is the filmmakers’ wish. Most importantly, it will increase the visibility of the brand as well as opening these movies up for Oscar and Emmy nominations, which will ultimately boost subscriptions. Following this deal, Netflix went from 9 awards and 54 nominations in 2016 to 20 awards and 91 nominations in 2017. Furthermore, Netflix hired Scott Stuber, a veteran Hollywood producer to be the head of its movie division (Netflix Media Center, 2018). Capitalizing on the success of its content, the firm has also developed show related games. It is not clear whether the firm will continue developing those nor how successful they were.
8.4.2. Platform Quality
Netflix considers providing excellent accessibility to be vital. Unlike any of its competitors, Netflix collects and utilizes extensive amounts of data to, based on its costumers search profiles, suggest other content it considers appropriate for the user. Out of about 6.000 titles that constitute the firm’s portfolio, each costumer is shown the 50 to 75 titles that Netflix’s algorithm forecasts to be those the costumer is most likely to enjoy. Moreover, once one logs into the platform, it will never automatically log-off. These facts are particularly remarkable given that competitor platforms, like HBO Now, log users out frequently and require user authentication through the computer or smartphone, involving missing passwords and troubles that will not be found with Netflix. Moreover, none of Netflix’s competitor platforms uses any sort of data collection or
21 analysis either to measure user preferences or study the type of shows that should be developed (Ekanadham, 2018).
8.5. Risks & Threats 8.5.1. Competition
Netflix Media Center defines its competition, in a broad sense, as any vehicle through which an individual can spend time relaxing or getting any sort of stimuli, which may include “linear networks, pay-per-view content, DVD watching, other internet networks, video gaming, web browsing, magazine reading, video piracy, and much more.” The firm also acknowledges that, in respect to the source of entertainment they offer, the competition is rapidly increasing, with players such as Facebook, Snapchat, Apple and Twitter working on improving video quality on their platforms. Netflix’s investor relations department distinguishes the firm from these other sources of entertainment, claiming the firm “not to be a generic video company that streams all types of video such as news, user-generated, sports, porn, music video, gaming, and reality but rather as being a movie and TV series entertainment network”. Upon questioned regarding what it considers to be a concrete competitor of their business, the same department responds HBO. This answer is surprising, given that there are many other players in the market that may be considered to be much more of a threat to Netflix, however, it does signal the long-term vision of Netflix as premium content creator rather than a distributor of third party content.
The firm’s vision for the future is that the market will be highly segmented. Costumers will not purchase access to one single service where all the content is available, but rather purchase access to various providers in order to be able to watch the original shows from each provider. This is not a convincing arguments, as having everything in one single place rather than having to access different platforms to watch different shows sounds like a simpler, more attractive approach. Furthermore, this market segmentation is what opens space for a substantial issue the industry faces: piracy. Video piracy is free, offers a very broad selection of content and, as a result, is a threat to Netflix.
Piracy is a great issue that the industry faces, but Netflix’s competition does not consist of HBO and piracy alone. There are other players that, for their ability to offer enjoyable and relaxing time to individuals are in a position of being a real threat to Netflix. The most obvious competitors
22 to Netflix are those who offer products that are direct substitutes to the company’s product. In this category are Amazon, offering Amazon Prime Video, Hulu, a joint venture from 21st Century Fox,
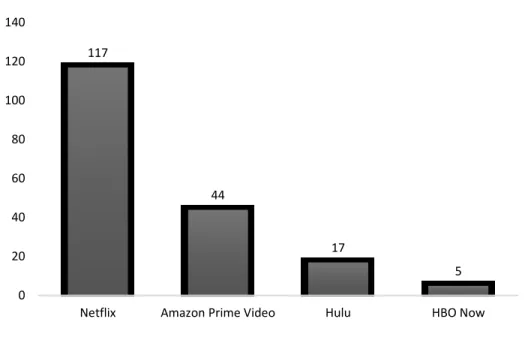
Walt Disney, Comcast and Time Warner, and HBO, also a Timer Warner company, offering HBO Now, which is extremely similar to Netflix. It should be pointed out that only Amazon Prime Video is available both inside and outside the US, being present in over 200 countries. The dissertation will proceed with a brief comparison between Netflix’s subscriber base, content expenditure and pricing with that of its most direct competitors.
Figure 9 highlights Netflix’s superiority regarding subscriber amounts. Amazon Prime Video, coming in second with 44 million subscribers, is the most immediate threat to Netflix. However, the amount of Amazon Prime Video subscribers is different from its actual viewers. By subscribing to the Amazon Prime services, which offers a wide range of benefits, such as free shipping on
Amazon products, a streaming-music library and cloud storage, consumers are automatically
subscribing to Amazon Prime Video as well. It is not clear, however, how many of these subscribers actually use or value this service as it is part of a larger package.
Sources: Companies Websites
Fig. 9 – Subscriber Base Comparison (in millions)
117 44 17 5 0 20 40 60 80 100 120 140
23 In respect to content expenditure, in 2017, Netflix was the firm that registered the largest expenditure, spending over $6 billion, closely followed by Amazon Prime Video, who spent $4,5 billion. Hulu and HBO had an expenditure of $2,5 billion, less than half of Netflix’s investment.
6 4,5 2,5 2,5 0 1 2 3 4 5 6 7
Netflix Amazon Prime Video Hulu HBO Now
Fig. 10 – Content Expenditure (in $ billions)
Sources: Companies Websites
Source: Business Insider
24 Figure 11 compares the video content budget of Netflix and Amazon, the two largest players on the video streaming industry, both in respect to number of subscribers and content expenditure. The graph shows that Netflix has been spending more than Amazon on each of the year of analysis, however, the gap has been closing on a relative basis. In 2013 Netflix spent twice as much on content than Amazon Prime Video but in 2017 it only spent 33% more.
Pricing is one of the most important characteristics for products that are as similar as the ones described. The comparison below only applies to the US, as Hulu and HBO Now only operate in that market.
Amazon Prime offers unlimited streaming of tens of thousands of movies and TV shows. Unlike its main competitors, Amazon Prime also allows the rental of individual items. One can also choose to subscribe to Prime Video only for $8,99 a month or, for $99 a year, one can have access to the whole Amazon Prime package. Amazon’s 50%-off student discount, making the Amazon Prime service $49,50, has been a huge success, being by far the best option for students.
Hulu’s service is priced at $7,99 for the basic package and $11,99 for the premium package, which is exactly the same of as the basic package, but advertisement free. HBO Now’s package costs almost two times more than Netflix’s basic package and the advantages do not seem obvious. HBO is known as being a premium content provider, having created some of the best shows around, like Game of Thrones, The Sopranos or Silicon Valley. However, Netflix’s content is renowned itself, with names like House of Cards, Orange is the New Black and Stanger Things.
From the analysis of the three points above, subscriber base, content expenditure and pricing, Netflix seems to hold the leading position on the video streaming market regarding the first two, having been able to capture a wider subscriber base and highly invest to produce quality content.
Fig. 12 – US Monthly Prices Comparison
25 In respect to pricing, Netflix’s packages also appear to be priced competitively. Is there room for the firm to further increase its prices?
8.5.1.1. Pricing Power
Upon the start of Netflix’s streaming service there was no benchmark as to which price would be reasonable for its services, other than linear TV services, which are often sold as a bundle. Resulting, Netflix’s pricing power over the past years has been remarkable, with the company raising the price on its standard package by over 35% in three years for new subscribers and, simultaneously, witnessing a 143% growth in its subscriber base, according to the firm’s annual report.
It is expected that, as other products are launched in the following years, at lower or comparable prices, some potentially supported by ads (as is the case of Hulu), that Netflix’s price elasticity is unlikely to remain static. Moreover, Netflix’s service is dependent on its users having good internet connection. Lack of control over broadband prices is a limitation to Netflix’s ability to increase its prices. This should not apply to some countries where Netflix has only recently started operating, in which it is priced as a luxury product, for which price elasticity shouldn’t be as strong. At last, one more risk that Netflix is subject to regarding its pricing ability is bundling risk. Currently, Netflix is aligned in terms of pricing with services like Hulu, Amazon Prime Video or HBO Now, however, if it is to continue increasing its prices, it risks having to compete with bundles of services, which may include television access plus a streaming service for a similar price of Netflix’s streaming service alone. This is already the case with Amazon Prime, in which the streaming video platform comes as an extra to the accelerated delivery, music and cloud platforms, and the threat is expected to increase with the merge of Disney and Fox.
8.5.1.2. Disney-Fox Merge
The Disney-Fox merge is expected to affect Netflix in several aspects, potentially being its biggest present threat. Disney is the number one provider of Netflix’s content for kids, content Disney has announced to be withdrawing in 2019. Moreover, through this deal, Disney will be the majority shareholder in Hulu. Fox is also the owner of the largest media network platform in India, Star Entertainment, therefore extending Disney’s influence to this large emerging market Netflix has just recently penetrated. Beyond this, this merge may include Fox’s 40% stake of Sky, which
26 would allow Disney access to over 22 million customers in the UK, Ireland, Germany and Italy (Garrahan, 2017). This is, however, not certain yet, as Comcast has made a counter-offer to acquire Sky as a whole (Khan, 2018). Given the direct consequences of this merge, Disney is in an ideal position to either expand Hulu globally or to launch its own streaming content platform, leveraging on Fox’s distribution assets, or bundling this platform with a paid television subscription. In either scenario it is clear that this merge poses an eminent threat to Netflix’s business and it is unclear what the firm may do to respond.
9. Net Neutrality
Competition is, without a doubt, Netflix’s most clear source of risk. As to net neutrality, it is not clear whether it is an opportunity or a risk for Netflix. Net neutrality is defined as “the principle that Internet service providers should enable access to all content and applications regardless of the source, and without favoring or blocking particular products or websites” (Oxford Dictionary, 2018) This has been the situation in most countries in Europe and the US, one with net neutrality, meaning that, by purchasing access to the internet one has access to everything within the internet without having to pay anything extra to access any website. Moreover, net neutrality ensures that internet speed for all websites is the same, being impossible for Internet Service Providers (ISPs) to negotiate with companies tariffs in which consumers would experience faster internet speed when accessing to certain websites. In the US, the Federal Communication Commission (FCC) has, on the 14th of December 2017, approved a law to repeal net neutrality. What are the
implications for Netflix? In the past, the major internet companies have been extremely vocal regarding their opposition to a net neutrality repeal, as this repeal as seen as a great risk to their business. The argument was that repealing net neutrality would give unfair advantages to ISPs own content and offer a narrower range of options for consumers to access in the internet (Kastrenakes, 2017). An example of how this repeal could adversely impact Netflix would be in the event of a merge between AT&T and Time Warner, which is in discussion. In a world without net neutrality this would mean that an extremely large ISP would own a streaming service provider, HBO, and would have the option to either block or highly slow down the streaming speed of Netflix, making HBO much more appealing to individuals who have access to the internet from them. Recently however, Netflix and the other very large internet companies, like Alphabet or Amazon do not seem to be as worried about this net neutrality repeal as they have been in the past. The underlying
27 logic seems to be that they do not think ISPs have the bargaining power to negotiate harmful terms with them anymore given the size that they have reached. Moreover, given their current bargaining power, they perceive it as an opportunity to establish dominance over the smaller players in the market. Given the risks mentioned and Netflix’s current attitude regarding the issue, it is not clear whether the company regards this change in regulation as a risk of an opportunity nor is it clear how will this impact the firm’s operations.
10. Valuation
Netflix was valued in this dissertation using, as the main valuation methodology, the Discounted Cash-Flow Model, being the discount rate the WACC. Relative valuation was used as a complementary method to test the consistency of the DCF valuation. This dissertation will proceed with the explanation of each of the methods used, as well as the underlying assumptions of the models. At last, the valuation produced will be compared with the equity valuation on Netflix produced by Morgan Stanley on the 22nd of January 2018.
10.1. Discounted Cash-Flow Model - Assumptions 10.2. Earnings Before Interest and Taxes (EBIT)
EBIT, or operating income, consists of the firm’s revenues minus all of its operating expenses. These operating expenses are classified as cost of revenue, marketing expenses, technology & development expenses and general & administrative expenses. The dissertation will follow with the underlying assumptions for the evolution of each variable into the future.
10.2.1. Drivers of Revenue
Netflix’s future revenue was estimated as is the sum of the revenues from its three business segments. The revenue for each of the segments consists, with minor variations, of the product of the average revenue charged from each paid subscriber and the number of subscribers. The assumptions for the forecasts of the future revenue charged from each paid subscriber and the number of subscribers follows.
28
10.2.1.1. Average Monthly Revenue per Paid Subscriber
As previously mentioned, Netflix has had tremendous pricing power, having been able to historically increase its prices without compromising subscriber growth. As depicted above, the Domestic and International segments’ monthly revenue per paid subscriber are have evolved similarly from 2015 to 2017, while the DVD segment revenue per paid subscriber is slowly decreasing
In respect to the Domestic and International segments, the main driver of growth in the revenue per paid subscriber in 2018 is the $1 increase in Netflix’s Standard package from $10,99 to $11,99 and the $2 increase in the Premier package from $11,99 to $13,99, which was applied in the US and in most of the International segment on the beginning of 2018. In respect to both segments, the assumption for the future is that Netflix will be able to continue to increase the prices for its service at an ever smaller rate. The company is expected to increase its price once again in the end of 2018, most likely in its two cheapest packages, and then the growth rate is expected to severely decrease after 2019, given that it is the year in which Disney’s content will no longer be available in Netflix’s platform and that it is assumed that the firm’s competitors will start applying pricing pressure. From 2024 onwards it is assumed that Netflix’s prices will be increasing at a rate smaller than the inflation for both segments. In respect to the DVD-by-mail segment, it is expected that the average monthly revenue per paid subscriber will continue to decrease, following the historical trend.
As mentioned, the firm’s revenue is a function of how much it charges from its subscribers and the number of subscribers it has. The number of subscribers is defined as the product of the size of the market in which Netflix operates or plans to operate in the future and Netflix’s ability to penetrate these markets. The forecast for each driver follows.
Fig. 13 – Average Monthly Revenue per Paid Subscriber ($)