PLANTS TREATED WITH KINETIN AND POTASSIUM NITRATE
Produção por planta e outras características de plantas de soja tratadas com cinetina e nitrato de potássio1
Alexandre Martins Abdão dos Passos2, Pedro Milanez de Rezende3, Amauri Alves de Alvarenga4,
Danielle Pereira Baliza3, Everson Reis Carvalho3, Hélio Perez de Alcântara3
ABSTRACT
The study aimed to evaluate the effect of kinetin and potassium nitrate applied to leaves, at the R3 phenological phase, on some agronomic characteristicsof soybean plants and their yield per plant in the field. The experiment was carried out in Itutinga, MG, using five kinetin concentrations (0, 250, 500, 750 and 1.000 mg kinetin ha-1) combined with four potassium nitrate concentrations (0, 5, 10 and 15 kg ha-1)in a factorial scheme using a randomized block experimental design, with three replications. The positioning of numbers of pods per plant was evaluated in three positions in the canopy: lower, middle and upper. The application of potassium nitrate did not influence the studied characteristics. Kinetin increased the total set pod number by 27.4% in contrast to the control, mainly in the lower and middle thirds of the canopy. The kinetin increased the pod set number up to 20.7%, in the middle third. The yield per plant was increased up to 27.1% using the highest kinetin concentration. The increases were attributed to an increase in the endogenous cytokinin levels that contribute to the higher production and better redistribution of assimilates to the pods and seeds.
Index terms:Glycine max, cytokinin, plant growth substances, plant nutrition.
RESUMO
Objetivou-se, neste trabalho, avaliar o efeito de diferentes doses do regulador vegetal do grupo das citocininas, cinetina, e de nitrato de potássio aplicados via foliar na fase fenológica R3 (início da frutificação) na produtividade e características agronômicas da soja em condições de campo. O experimento foi conduzido em Itutinga, MG, utilizando-se 0, 250, 500, 750 e 1.000 mg de cinetina ha-1 combinadas com as doses de 0, 5, 10 e 15 kg de nitrato de potássio ha-1 em esquema fatorial, num delineamento de blocos casualizados, com três repetições. Avaliou-se o posicionamento dos legumes nas plantas em três posições do dossel, dividido em inferior, médio e superior. A aplicação de nitrato de potássio não influenciou nenhuma das características avaliadas. A cinetina aumentou o número total de legumes fixados em até 27,4%, principalmente, os do terço inferior e mediano do dossel. Observaram-se aumentos dos legumes no terço médio de até 20,7%, perante a testemunha. A produção por planta foi incrementada em até 27,1%, utilizando a maior dose. Atribui-se a causa dos efeitos da cinetina ao aumento dos níveis endógenos de citocininas que contribuíram para uma maior produção e melhor redistribuição de fotoassimilados para os legumes e sementes.
Termos para indexação:Glycine max, citocininas, fitorreguladores, nutrição mineral.
(Received in august 12, 2011 and approved in december 21, 2011)
1Trabalho extraído da dissertação do primeiro autor do curso de pós-graduação em Agronomia/Fitotecnia
2Empresa Brasileira de Pesquisa Agropecuária/Embrapa Rondônia – Cx. P. 127 – 76815-000 – Porto Velho, RO – [email protected] 3Universidade Federal de Lavras/UFLA – Departamento de Agricultura – Lavras, MG
4Universidade Federal de Lavras/UFLA – Departamento de Biologia – Lavras, MG
INTRODUCTION
Soybean [Glycine max (L.) Merril] is considered
the most important food legume in the world. Brazil, the second biggest world producer, has an outstanding level of productivity compared to other countries. However, there are still some factors that could boost crop yield beyond established levels. Several promising studies have indicated that the application of plant growth regulators to the leaf could increase crop yield levels (LIU et al., 2004; YASHIMA et al., 2005; NONOKAWA et al., 2007; PASSOS et al., 2008). The potential yield of the soybean crop is mainly influenced by the production, fixing and transformation of
the reproductive structures into pods with the grains, thus the spatial dynamics of these structures need to be studied and correlated with yield (PIRES et al., 2000).
crop yield (YASHIMA et al., 2005; NONOKAWA et al., 2007).
In spite of positive results regarding the isolated use of exogenous cytokinin, in terms of increasing grain yield in soybean crops, there are few studies concerning its effects under Brazilian conditions and few studies have been carried out in the field.
Various factors, such as the concentration of the plant growth regulator (NASCIMENTO; MOSQUIM, 2004); cultivar (CHO et al., 2002); and plant nutrition (CUQUEL et al., 2002) can interfere on the effects of the cytokinin and their exogenous analogues when applied to soybean plants.
Nelson et al. (2005) tested several concentrations and application times of potassium on soybean leaves for two years and concluded that foliar spraying can be an excellent method of supplementary fertilization when edaphoclimatic conditions do not favor the satisfactory uptake of potassium from soil, thus resulting in yield increases.
The study aimed to observe the effects of applying kinetin (associated - or not - with potassium nitrate) to the leaf during the reproductive phase, on crop yield and on some agronomic characteristics of the soybean plant.
MATERIAL AND METHODS
The experiment was carried out at Milanez Farm, located in the municipality of Itutinga, latitude 21º23’29,8" S, longitude 044º39’13,2", mean altitude 958 m, in the State of Minas Gerais, Brazil. The study was carried out in a Cambissol type soil, with a clay texture (53% clay) corrected, with two years cropping and was therefore considered a medium to high fertility soil, as shown in the data in Table 1.
Sowing fertilization was made according to soil analysis and interpretations according to Ribeiro et al. (1999), using 400 kg ha-1 of the 0-30-10 formula. The soybean seeds were inoculated before sowing with
Bradyrhizobium japonicum, using the minimum
proportion of 1,200,000 bacteriaS per seeds. Sowing took place on 2005/11, the start of the growing season, using 18 seeds per linear meter, that were later thinned and the first stand standardized to 15 plants per linear meter, aiming for an ideal population of 300,000 plant per hectare.
A randomized block experimental design was used, in a 4 x 5 factorial scheme with three replications, consisting of five kinetin concentrations (0, 250, 500, 750 and 1,000 mg ha-1) and four potassium nitrate concentrations (0, 5, 10 and 15 kg ha-1) applied to the leaf at the R3 phenological stage of pod formation using a carbon dioxide pressure spray at constant 2.8 kgf cm-² pressure and a 200 L ha-1 solution volume. At zero concentration, water was applied as the control.
The kinetin used was manufactured by the Sigma-Aldrich Corporation. A stock solution was prepared, diluted in 0.5 normal HCl and the volume was completed with demin er alized water and kept refrigerated at 0°C until the application in the field. For the potassium salts, potassium nitrate was used, manufactured by Merck, Darmstadt, Germany and as an adjuvant, Natur’l Óleo at 0.5% v/v.
The BRSGO Luziânia cultivar was used because of its high productive potential in the national and Minas Gerais State soybean cropping scenarios. The cultivar belongs to the medium maturation group, demands high soil fertility, has determined growth and is resistant to lodging.
The plots in the field consisted of four 0.5m rows with 0.5 m between-row spacing and the two external rows and 0.5 m from the end of each of the central rows were removed as border, corresponding to an area of 4 m² useful plot.
The plants were mapped, assessing the pod distribution on the profile of the plant, dividing it into upper, middle and lower parts. At the R8 phase (maturation), the plant yield was estimated by sampling ten plants from the useful rows.
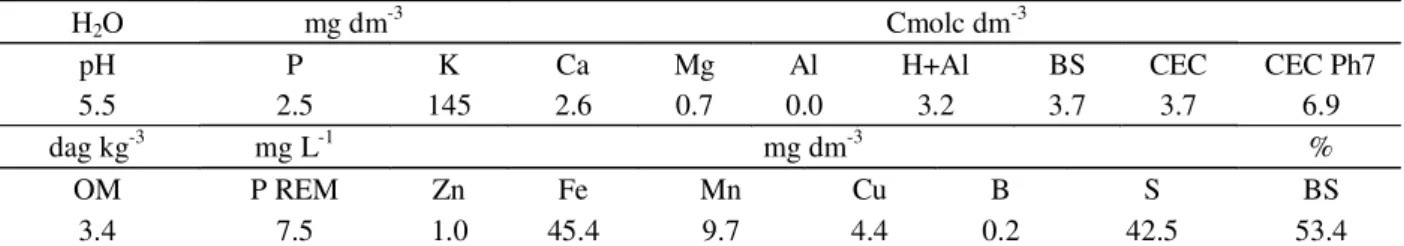
Table 1 – Chemical characteristics of the soil samples of the experimental area.
Soil analyses carried out at the “John Wheelock” Chemical Institute and the Soil Science Department of the Federal University of Lavras, MG.
H2O mg dm-3 Cmolc dm-3
pH P K Ca Mg Al H+Al BS CEC CEC Ph7
5.5 2.5 145 2.6 0.7 0.0 3.2 3.7 3.7 6.9
dag kg-3 mg L-1 mg dm-3 %
OM P REM Zn Fe Mn Cu B S BS
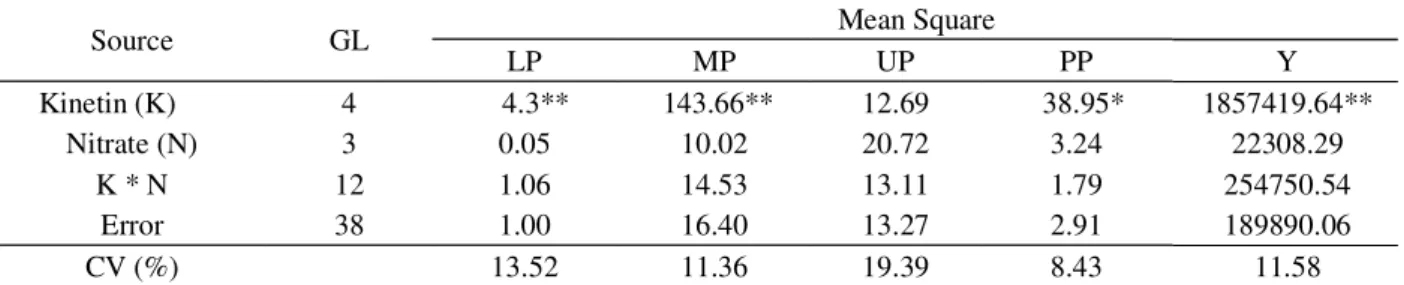
Significant at 5 and 1%, respectively, by the F test.
The data obtained in the different assessments was submitted to the F test using the SISVAR® program (FERREIRA, 2008). Significant effects were submitted to regression analysis.
Correlation analysis was made for various components and agronomic characteristics, including yield to infer the main aspects of its determining factors. In the correlation analysis, the t test was used among the several response variables assessed, using the SAS® program.
RESULTS AND DISCUSSION
The analysis of variance (Table 2) shows that kinetin application resulted in a significant effect on some characteristics assessed, such as the number of pods on the lower third (LI) and the mid-third of the canopy (LM) and seed production per plant (PP).
Unlike the kinetin, the potassium nitrate, when applied to the leaf at the reproductive stage (R3), did not present a significant effect on the characteristics assessed in the crop. The same was observed regarding the interaction with kinetin.
Potassium fertilization on soybean has shown, over the years and in several locations, inconsistent results in yield increase and there have often been no increases (MASCARENHAS et al., 1994). Several factors can explain the absence of a response from soybean plants to the application of potassium to the leaf. Sacramento e Rosolem (1998), in studies in nutritive solution, showed that factors such as age, cultivar and the nutritional levels of potassium in the plant in can affect the efficiency and the use index of this element.
Nelson et al. (2005) reported that the use of potassium applied to the leaf could be a good option for supplementary fertilization but only when the edaphoclimatic conditions were not favorable as it was more efficient in earlier application periods, between V4
Table 2 – Summary of the analyses of variance of the data for the number of lower pods per plant (LP), number of middle pods per plant (MP), number of upper pods per plant (UP), seed production per plant (PP) and, grain yield (Y) obtained in the kinetin and potassium nitrate concentration experiment on soybean plants.
and R2, and they observed that application in R3-R4 presented the least productivity.
Kinetin applied to the leaf resulted in significant gains in the number of set pods on the plants, with increases mainly from the effect of the kinetin on the pods positioned on the lower (LP) and middle (MP) thirds of the canopy (Table 2).
It is inferred from these results that applying synthetic cytokinins to the soybean crop is a way of increasing pod setting and consequently the yield, that is corroborated by the literature (CARLSON et al., 1987; DYER et al., 1987; MOSJIDIS et al., 1993; NAGEL et al., 2001; CHO et al., 2002; LIU et al., 2004; YASHIMA et al., 2005; NONOKAWA et al., 2007; PASSOS et al., 2008).
The main hypotheses by which the pods abort result from a deficiency of photoassimilates or cytokinins in the pods (LIU et al., 2004) and exogenous kinetin application increases the endogenous levels, generating an increase in the sink force on the organs treated, possibly because of an increase in the cell division rate (MOSJIDIS et al., 1993). Productivity losses in the soybean crop are mainly due to the increase in the pod abortion rate of the plants, resulting in lower grain yield per area unit (PIRES et al., 2000; LIU et al., 2004).
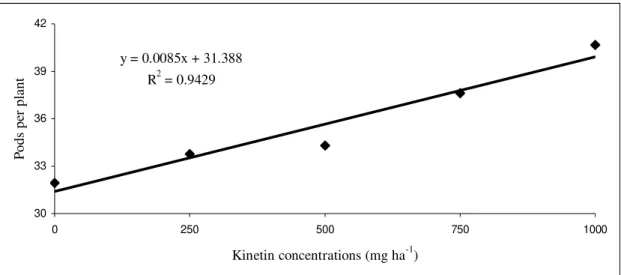
The regression of the data of middle pods per plant showed a positive linear effect of the different kinetin concentrations used (Figure 1). On average, kinetin application resulted in an increase of 14.6% (4.7 pods per plant) reaching maximum values of 8.8 pods per plant (increase of 27.4%) when the highest concentration, 1.000 mg ha-1 kinetin, was used.
There was no significant effect of applying kinetin on the number of pods in the upper third of the canopy of the crop, as shown in the data in Table 2. This absence of effect may have occurred because the pod on the upper third is a natural strong sink in the plants and thus their
Source GL Mean Square
LP MP UP PP Y
Kinetin (K) 4 4.3** 143.66** 12.69 38.95* 1857419.64**
Nitrate (N) 3 0.05 10.02 20.72 3.24 22308.29
K * N 12 1.06 14.53 13.11 1.79 254750.54
Error 38 1.00 16.40 13.27 2.91 189890.06
Figure 2 – Number of lower pods per plant, in function of the kinetin concentrations applied. Figure 1 – Number of middle pods per plant, in function of kinetin concentrations applied.
y = 0.0085x + 31.388 R2 = 0.9429
30 33 36 39 42
0 250 500 750 1000
Kinetin concentrations (mg ha-1)
Po
ds
p
er
p
la
nt
y = -0.000004x2 + 0.0041x + 6.7499 R2 = 0.6282
6.4 6.6 6.8 7 7.2 7.4 7.6 7.8 8 8.2 8.4
0 250 500 750 1000
Kinetin concentrations (mg ha-1)
P
od
s
pe
r
pl
an
t
sink force is not increased by kinetin application (NELSON et al., 1961).
Another point to consider is that the upper third is the most exposed part of the plants to climatic and biotic disturbances that may have negatively influenced the obtaining of beneficial results from kinetin application. Taiz end Zeiger (2004) reported that transgenic plants that had higher endogenous cytokinin concentrations had shortened internodes and roots possibly because of an excess of cytokinins resulting in ethylene production. Being a gas, the ethylene may have percolated into the plant canopy and affected the upper third of the plant, negatively influencing pod setting in this region.
A quadratic response model to the kinetin concentrations applied to the leaf fitted the data of pod number on the lower third of the canopy, presenting a point of maximum number of pod in the lower third of the canopy (7.8 pods plant-1) with the use of the 508.9 mg ha-1 kinetin concentration (Figure 2). In the results found, increases were observed of up to 17.6% in the number of pods, compared to the control treatment. On average, kinetin application resulted in increases of 7.9% compared to the control.
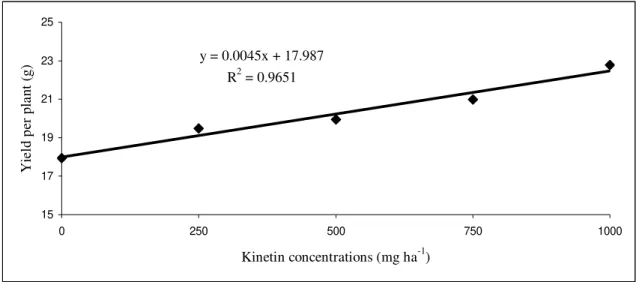
Figure 3 – Variation in production per plant (grams plant-1) in function of kinetin concentrations applied.
y = 0.0045x + 17.987 R2 = 0.9651
15 17 19 21 23 25
0 250 500 750 1000
Kinetin concentrations (mg ha-1)
Y
ie
ld p
er
pl
ant
(
g)
oxidase enzyme due at least in part to the increase in RNA levels in a gene subgroup (TAIZ; ZEIGER, 2004). Dividing up the applications could be a way to diminish this effect. These results were similar to those obtained by Nagel et al. (2001) who studied the variation in the cytokinin concentration applied on the number of pods per plant, total number of seeds per plant and total weight of seeds per plant, and reported a negative quadratic curve as response, that showed that high concentrations had a negative effect on these variables.
There was increase in yield per plant when treated with kinetin (Table 2), and an average increase of 16% (2.9 g plant-1). The use of higher concentrations resulted in an increase of 27.1% in seed production per plant (4.9 g plant-1) (Figure 3).
These increases were consistent with data in the literature, observed in soybean plants by various authors, under protected and field cropping conditions (CARLSON et al., 1987; DYER et al., 1987; MOSJIDIS et al., 1993; NAGEL et al., 2001; CHO et al., 2002; LIU et al., 2004; YASHIMA et al., 2005; NONOKAWA et al., 2007; PASSOS et al., 2008).
The highest kinetin concentrations resulted in the highest yields. A possible explanation for these results may be the fact that the cytokinins become divided inside the leaf and are therefore unavailable for activity, as occurs with inactive glucoside cytokinins from the roots that accumulate themselves in leaves and seeds (TAIZ; ZEIGER, 2004), and higher cytokinin concentrations need to be used for this to be free and active after certain concentrations.
An important role of cytokinins is promoting leaf expansion. Thus any positive variation in the leaf area increases the formation of photoassimilates necessary for grain swelling, giving significant increases in the yield.
Another point to consider is that cytokinins regulate, among other factors, photosynthesis pigment and protein synthesis. This fact may directly influence the balance of the net photosynthesis, resulting in a greater photoassimilate production, expressed in a greater grain yield.
In addition to the greater photoassimilate production due to the higher photosynthesis rate (because of the increase in leaf area and the chlorophyll contents) the use of these reserves is important in the parts of economic interest, which in the case of soybeans, are the grains. In this sense, the capacity of the cytokinins to regulate the source sink ratio may play an important role in the increase in productivity of the plants, by setting pods and increasing dry matter accumulation in the grains during the R3 phase, as was observed in the present study.
The linear correlation coefficient is the most recommended way to measure the ratio between independent variables, such as agronomic characteristics and yield.
PASSOS, A. M. A. dos et al. 970
Ciênc. agrotec., Lavras, v. 35, n. 5, p. 965 -972, set./out., 2011 *, ns significant at 5% and not significant (t-test).
* and ** significant at 1 and 5%, respectively, by the t-test.
Agronomic characteristics Yield (r=) Yield per plant (r=)
Plants height 0.42 0.47
Height of insertion of the first pod 0.71 0.77
Number of seeds per pod 0.50 0.40
Weight of 1,000 seeds 0.74 0.88*
Total of pods per plant 0.96 ** 0.99 **
Lower pods per plant 0.37 0.13
Middle pods per plant 0.92* 0.98**
Upper pods per plant 0.94* 0.98**
Yield per plant 0.97**
Table 3 – Coefficients of linear correlation among some agronomic characteristics with the productivity of the soybean crop, obtained in the experiment of kinetin and potassium nitrate concentrations on soybean.
Increases in yield per area or per plant occurred specifically because of the increase in the number of total pods per plant, as a result of the application of kinetin, as shown in Table 3 and Figure 4.
The middle and upper thirds of the soybean canopy contributed most to the soybean grain yield, because of the greater presence of reproductive structures (pods) in the plants in R8. The middle third represented about 57.6% of the total number of pods produced on the plants, and under the influence of the kinetin, correlated highly with the total of pods produced and, consequently, on yield (Table 2 and 3 and Figure 4).
The weight of 1,000 seeds did not correlate with the increase in yield, possibly because of the low levels of increase provided by kinetin (1% on average). However, significant correlation was observed for production per plant for weight of 1,000 seeds (Table 3).
Photoassimilates were probably most used to set the majority of pods and consequently in the greater seed production per plant, indicating that the plant reserves were not sufficient to permit the grain weight to be correlated significantly with productivity.
Figure 4 shows that even though the number of pods on the lower third of the plant experienced a positive
y = 0.0005x + 5.3939 ns R2= 0.1334 y = 0.0081x + 5.0779 *
R2= 0.8467
y = 0.0024x + 9.6104 * R2= 0.8779
0 5 10 15 20 25 30 35 40 45
3100 3300 3500 3700 3900 4100
P
Yield (kg ha-1)MP
LP UP
effect from kinetin application (Table 2), its contribution to the increase in productivity was low (r=36.47%), possibly because it represented only 12% of the total of pods set on the plant. On the other hand, although it was not significantly influenced by the kinetin, the number of upper pods presented a high and significant correlation with plant productivity.
CONCLUSIONS
Kinetin application is a promising production technology for soybean crops, because it results in significant increases in the number of pods on the lower third per plant, middle third per plant and on seed production per plant.
The increase in productivity from kinetin application mainly occurs due to the increase in the number of pods per plant, and this was driven mainly by the increase in the number of pods set on the middle third of the canopy of the plant.
Potassium nitrate applied to the leaf at the R3 phase is not recommended as an efficient practice, because it did not affect any of the characteristics evaluated.
REFERENCES
CARLSON, D.R.et al. The physiological basis for cytokinin induced increases in pod set in 1X93-100 soybeans. Plant Physiology, Rockville, v.84, n.2, p.233-239, 1987.
CHO, Y.et al. Impact of 2,4-DP and BAP upon pod set and seed yield in soybean treated at reproductive stages. Plant Growth Regulation, Dordrecht, v.36, n.3, p.215-221, 2002.
CUQUEL, F.L.; CLARK, D.; MINAMI, K. Horticultural performance of transgenic Petunia x hybrida plants containing the PSAG12-ipt gene grown under nutritional deficiency. Revista Brasileira de Horticultura
Ornamental, Campinas, v.7, n.1, p.41-48, 2002. DYER, D.J.et al. Soybean pod set enhancement with synthetic cytokinin analogs. Plant Physiology, Rockville, v.84, p.240-243, 1987.
FERREIRA, D.F. SISVAR: um programa para análises e ensino de estatística. Revista Symposium, Lavras, v.6, p.36-41, 2008.
KOKUBUN, M.; HONDA, I. Intra-raceme variation in pod-set probability is associated with cytokinin content in soybeans. Plant Production Science, Tokyo, v.3, n.4, p.354-359, 2000.
LIU, F.; JENSEN, C.R.; ANDERSEN, M.N. Drought stress effect on carbohydrate concentration in soybean leaves and pods during early reproductive development: its implication in altering pod set. Field Crops Research, Maricopa, v.86, n.1, p.1-13, 2004.
MASCARENHAS, H.A.A.et al. Efeito de adubos potássicos na produção de soja. Scientia Agricola, Piracicaba, v.51, n.1, p.82-89, 1994.
MOSJIDIS, C.O.H.et al. Stimulation of pod and ovule growth of soybean, Glycine max (L.) Merr. by
6-Benzylaminopurine. Annals of Botany, Oxford, v.71, n.3, p.193-199, 1993.
NAGEL, L.et al. Cytokinin regulation of flower and pod set in soybeans. Annals of Botany, Oxford, v.88, n.1, p.27-31, 2001.
NASCIMENTO, R.; MOSQUIM, P.R. Crescimento e teor de proteínas em sementes de soja sob
influência de hormônios vegetais. Revista
Brasileira de Botânica, São Paulo, v.27, n.3, p.573-579, 2004.
NELSON, C.D.et al. Select translocation of products of photosyntesis on the soybean. Plant Physiology, Rockville,v.36, n.35, p.581-588, 1961.
NELSON, K.A.; MOTAVALLI, P.P.; NATHAN, M. Response of No-Till soybean [Glycine max (L.) Merr.] to
timing of pre-plant and foliar potassium applications in a claypan soil. Agronomy Journal, Madison, v.97, n.3, p.832-838, 2005.
NONOKAWA, K.et al. Roles of auxin and cytokinin in soybean pod setting. Plant Production Science, Tokyo, v.10, n.2, p.199-206, 2007.
PASSOS, A.M.A.et al. Cinetina e nitrato de potássio em características agronômicas de soja. Pesquisa
Agropecuária Brasileira, Brasília, v.43, n.7, p.925-928, jul. 2008.
RIBEIRO, A.C.; GUIMARÃES, P.T.G.; ALVARES, V.H. (Eds.). Recomendações para o uso de corretivos e fertilizantes em Minas Gerais: 5ª aproximação. Viçosa, MG: UFV, 1999. 302p. SACRAMENTO, L.V.S. do; ROSOLEM, C.A. Eficiência de absorção e utilização de potássio por plantas de soja em solução nutritiva. Bragantia, Campinas, v.57, n.2, p.355-365, 1998.
TAIZ, L.; ZEIGER, E. Fisiologia vegetal. 3.ed. Porto Alegre: Artmed, 2004. 719p.