Journal of Food Engineering 34 (1997) 213-224 0 1998 Elsevier Science Limited. All rights reserved Printed in Great Britain PII: SO260-8774(97)00082-4 0260.8774/98 $19.00 + 0.00 ELSEVIER
Modelling of Dissolved Oxygen Concentration
Storage of Packaged Liquid Doods
During
L. M. AhrnC”, F. A. R. Oliyeira’“, M. C. Manso’, M. C. Drumond”,
R. Osted & V.Gekas”
aTetra Pak Processing Systems AB, S-221 86 Lund, Sweden “Institute Inter-Universitario de Macau, R. Central no. 111, Macau
‘Escola Superior de Biotecnologia, Universidade Catolica Portuguesa, R. Dr. Antonio Bernardino de Almeida, 4200 Porto, Portugal
“Department of Applied Nutrition and Food Chemistry, Centre for Chemistry and Chemical Engineering, PO Box 124, S-221 00 Lund, Sweden
(Received 1.5 September 1995; revised 15 November 1996; accepted 28 September 1997)
ABSTRACT
A mathematical model that combines oxygen uptake from the outside environment with oxygen consumption by oxidative reactions, in a liquid packed food during storage, was developed. The model was applied to orange juice aseptically packaged in Tetra Brik Aseptic cartons, during storage of up to 5 months at 4, 8, 20, 30, 40 and 50°C. The parameters of the model, the oxygen mass transfer coeficient and the rate constant of consumption reactions, were estimated by fitting the model to the experimental data. The value of the rate constant estimated for the system tested in this work, was three orders of magnitude greater than the value of the oXygen mass transfer coeficient. The influence of temperature on the reaction rate was well described by an Arrhenius type equation, with an activation energy of 46 Wlmole. This model was further tested with data reported in literature and it was found that it adequately describes the dissolved oxygen concentration changes during storage. 0 1998 Elsevier Science Limited. All rights reserved
NOMENCLATURE
A Package surface area (m2) CO
o:t Concentration of dissolved oxygen in the juice at time t (ppm) C 02 Concentration of oxygen in the storage atmosphere (ppm) *Author to whom correspondence should be addressed.
214 c initial 02 ceq 02 : & K KR KO KD K out Kint GJ kP’ M MassTransfer MKinetics t V L. M. Ahmt et al.
Initial concentration of dissolved oxygen in the juice (ppm)
Concentration of dissolved oxygen in the juice for t&cc (ppm)
Diffusion coefficient of oxygen in the packaging material (m2/day) Thickness of the packaging material (m)
Activation energy (kJ/mole) Rate constant (day-‘)
Reaction rate constant (day-‘)
Pre-exponential factor of the Arrhenius equation (day-‘)
Oxygen mass transfer coefficient (day-‘) defined in eqn (3) and eqn (5)
Mass transfer coefficient outside the package (m/day) Mass transfer coefficient inside the package (m/day) Overall mass transfer coefficient (m/day)
Oxygen partition coefficient of the package material at the outside
wall
Oxygen partition coefficient of the package material at the inside
wall
Ratio of the oxygen partition coefficients (k:lkb) The mass transfer rate
The reaction rate Storage time (days) Package volume (m”)
INTRODUCTION
For the purpose of package design and optimisation, it is important to consider the
deteriorative reactions that take place in the food product. In many food products,
these reactions are dependent on oxygen concentration, which directly affects the
rate of oxidation of vitamins, lipids, pigments and proteins (Quast & Karel, 1972).
Oxygen permeates through many package materials and its concentration inside
the package changes during storage. A mathematical model to describe the concen-
tration of dissolved oxygen is therefore important for both food and packaging
producers. For the food producer, because oxygen influences product shelf-life, and for the packaging industry because the oxygen barrier of packaging materials can be optimised.
The mathematical modelling of oxygen uptake by packaged foods has been mainly
applied to dried and fatty foods (Quast & Karel, 1971, 1972; Quast et al., 1972;
Ragnarsson & Labuza, 1977). For liquid foods, several studies report the effect of
oxygen on quality degradation during storage, but few of them report changes of
oxygen concentration. More scarce are studies where the changes are mathematic-
ally modelled. Roig et al. (1994) studied the effects of some additives in single
strength orange juice stored in Tetra Brik Aseptic packages and dissolved oxygen
concentration was measured as a function of time for several temperatures; how-
ever, no mathematical model was applied. Mack et al. (1976), Singh et al. (1976) and
Hsieh and Harris (1993) studied the kinetics of oxygen uptake by liquid foods
during storage considering the kinetics of ascorbic acid degradation. These studies
Modelling of dissolved oxygen concentration during storage of packaged liquid foods 215
model to describe ascorbic acid and dissolved oxygen concentration changes in an
infant formula packaged in glass bottles and stored at 7°C; this model was based on
Fickian diffusion of oxygen accompanied by a second-order chemical reaction in the
liquid food. Sadler (1984) using a similar model, made a comprehensive study on
the prediction of quality losses in a liquid food, considering various polymeric
packaging materials; methods for determination of oxygen solubility in the food and
polymers, diffusion coefficients of oxygen in the food and polymers, as well as the
oxygen permeation rate and the oxidation rate of the food, were also presented.
Barron et al. (1993) reported a study where a finite element method was applied to
the modelling of simultaneous oxygen diffusion and chemical reaction in packaged
apple juice, stored at 25°C using a cylindrical high-density polyethylene package
(top and bottom insulated). No works were found on modelling of oxygen changes in liquid products packaged in aseptic cartons.
The objectives of this study were: (1) to develop a mathematical model to
describe the concentration of dissolved oxygen during storage in a packaged liquid
food, considering both oxygen transfer through the package and oxygen consump-
tion by deteriorative reactions; and (2) to assess the validity of the model for
aseptically packaged orange juice stored at different temperatures. Data reported in
literature were also used to further test the model.
MATHEMATICAL MODELLING
The oxygen concentration inside a packaged liquid food without headspace depends
on (i) the initial concentration upon packaging; (ii) oxygen permeation through the
package, including the seam; and (iii) oxygen consumption by deteriorative reac-
tions. A mass balance leads to:
(1)
where I/ is the package or liquid volume, Co, is the dissolved oxygen concentration
in the juice at a time t, MMassTransfer is the mass transfer rate and Mkinctics is the
reaction rate. The mass transport of oxygen from the atmosphere into the packaged
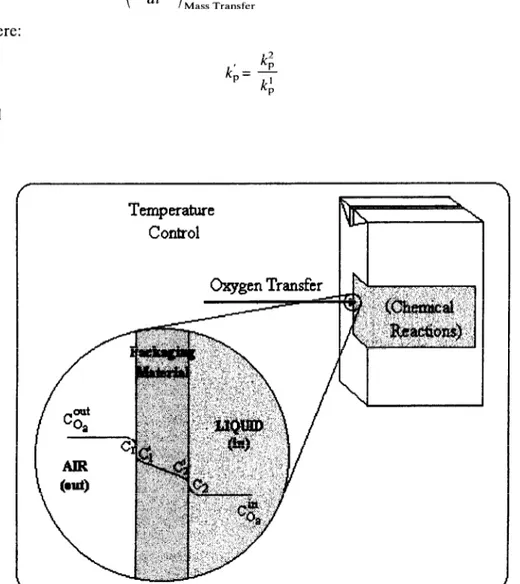
food product may be described as a three-step process (Fig. 1): in the first step the
molecules of oxygen are transported from the atmosphere to and dissolved in the
packaging material; in the second step the oxygen diffuses through the packaging
material moving towards the food; and the last step consists on the desorption of
the molecules from the package and their solubilisation in the food. The partition
coefficients at the outside and inside wall of the material (k; and k& respectively)
may be different from the unity and depend on the system characteristics; for
instance, when k; is smaller than unity, the concentration at the package surface is
smaller than the one at the contacting gas layer, as shown in the example sketched in Fig. 1.
Using the concept of resistances connected in series, an overall mass transfer
coefficient (Kovrrall) can be defined:
1 k;l Id 1
-=- -+- -+-
216 L. M. Ahmt et al.
where D is the diffusion coefficient of oxygen in the packaging material, d is the
thickness of the material, Kint and K,,, are the mass transfer coefficients inside and
outside the package, respectively. It is important to note that the barrier properties
of the package will influence the magnitude of D, Ki,, and K,,, values. When dealing
with a high barrier material, the permeability properties of the package seam should
be considered. The mass transfer rate through the package may then be described
by: = Ko(Cgzt -
k$o,)
Mass Transfer where: k;,=$
P and Temperature Control(3)
(4)
Fig. 1. Schematic representation of the mass transport of oxygen from the atmosphere into
Modelling of dissolved oxygen concentration during storage of packaged liquid foods 217
KD = t Koverza.
Cgzt stands for oxygen concentration in the storage atmosphere, K,, is the oxygen
mass transfer coefficient and A is the package surface area.
For simplicity sake, the consumption of oxygen may be assumed to follow a first-
order kinetic reaction with respect to oxygen (Barron et al., 1993)
= -KR~o,
Kinetics
where & is the reaction rate constant. Substituting eqn (3) and eqn, (6) into eqn
(l), rearranging and integrating the equation between time 0 (Co, = Cgr”‘) and time
t, the concentration of dissolved oxygen in the food inside the package at time t,
Co,, is given by the following equation:
Co2 = C~2+[C?j~i”‘- Cz!]exp[ - Kt]
where the equilibrium concentration, Cz*, and the rate constant, K, are given by:
0”t fy’ = K&o, 02 K,+k,K, and K = K,+k;K,
(9)
MATERIALS AND METHODS
Processing and packaging
Single Strength Valencia Orange Juice (12 “Brix) was obtained from Cargill Citro-
America, Inc. The juice was analysed for ascorbic acid, browning, “Brix, titrable
acidity and pH (Table 1). Browning was measured as light absorbance at 420 nm
(Meydav ef al., 1977). L-ascorbic acid was measured using an enzymatic method
TABLE 1
Characteristics of the Juice after Pasteurisation (Day 0 of Storage)
Juice oxygen @Pm)
Ascorbic Browning acid (mgil) (Abs.420 nm)
“Bti Titrable acidity
(g citric acid/l 00 g OJ) PH
A 10.25 + 0.01 333 0.149f0.008 12.7fO.l 2.36 f 0.05 3.86+0.01 B 6.47 f 0.02 362 0.142+0.009 12.6fO.l 2.34 + 0.05 3.85 kO.01 C 2.08f0.01 396 0.135+0.006 12.6AO.l 2.35 f 0.05 3.84kO.01 D 1.42f0.01 427 0.134+0.007 12.6AO.l 2.36 f 0.05 3.82f0.01 E 1.04 * 0.00 437 0.132kO.004 12.6+0.1 2.36 + 0.05 3.82f0.01
218 L. M. Ah& et al.
(Boehringer Mannheim kit). Titrable acidity and pH were measured according to
the AAOC methods. Two replicates were always analysed.
At Tetra Pak pilot plant (Lund, Sweden) the juice was homogenised, pasteurised
at 95°C for 15 s and aseptically packaged into 11 Tetra Brik Aseptic (TBA) cartons,
without headspace. The orange juice was stirred and/or deaerated prior to aseptic
filling, in order to obtain batches with five different initial oxygen concentrations
(10.3, 6.5, 2.1, 1.4 and l.Oppm).
TBA cartons are made of a multilayer packaging material: low density poly-
ethylene/paper board/aluminium foil/low density polyethylene (from the outside to
the inside). The permeability of the package to air is very low due to the presence
of the aluminium layer (high oxygen barrier package), with exchange of gas occur- ring mainly through the seam.
Package permeability measurements
The OXTRAN MH-2120 was used to measure the oxygen transmission rate of the
entire Tetra Brik Aseptic package. To test the package permeability, a Package
Environmental Chamber (PEC) was used in order to obtain humidity and tempera-
ture control inside and outside the package. Nitrogen was circulated continuously
through the package that was exposed to an atmosphere with 21% oxygen and 50%
RH. Permeability data at 10, 20, 30 and 40°C are reported in Table 2.
Storage experiments
Storage experiments were conducted in temperature-controlled walk-in rooms at 4,
8, 20, 30, 40 and 50°C (&0.5”C). A total of 5 x 120 TBA cartons were randomly distributed into six storage rooms. Ten (2 x 5) TBA cartons were randomly collected
from each storage room at different time intervals depending on temperature and
analysed for dissolved oxygen concentration.
Dissolved oxygen concentration measurement
A WTW Trioxmatic EO 200 oxygen electrode in combination with a WTW OXI 200
microprocessor was used to measure the dissolved oxygen concentration in the juice.
TABLE 2
Permeability of the Package, Measured with the OXTRAN Temperature
(“C)
Permeability as measured with OXTRAN
(cm3/(package.day) at 0.2 atm, 50% RH) converted to KD values (day-‘) 10 0.009 4.29 x 1O-5 20 0.014 6.67 x lop5 30 0.023 1.10 x lop4 40 0.038 1.81 x 1O-4
Modelling of dissolved o-tygen concentration during storage of packaged liquid foods 219
The electrode was calibrated with an one-point calibration using water-vapour satu-
rated air (WTW-Quick-Calibration) and equipped with a stirring device that allows
a representative sample flow at the oxygen electrode. Before measurement, the
packages were shaken. A small opening was made just large enough to fit the
oxygen probe, which was immersed in the juice immediately after opening. The
concentration of dissolved oxygen (ppm) was recorded when a steady value was
displayed (approximately 60 s).
Data for validation of the model
In order to further validate the mathematical model, data from Roig et al. (1994)
and Barron et al. (1993) were used. Roig et al. (1994) reported a storage experiment
with a similar package material, and studied the effects of some additives on dis-
solved oxygen content changes during storage of reconstituted single strength
orange juice packed in 200 ml Tetra Brik cartons. Barron et al. (1993) studied
storage of apple juice packaged in a much more permeable packaging system (high-
density polyethylene).
RESULTS AND DISCUSSION
Modelling of dissolved oxygen concentration
The concentration of dissolved oxygen during storage changes drastically during the
first days of storage and then is kept approximately constant (see Fig. 2). The
changes observed during the first days of storage are caused by the rapid consump-
tion of oxygen by oxidative reactions in the juice (Graumlich et al., 1986). After this
initial period, the oxygen transported through the package and the consumption of
oxygen by the oxidative reactions balance each other, keeping the level of oxygen in
the product constant. This equilibrium oxygen concentration was found not to be
significantly dependent on temperature and initial dissolved oxygen concentration
(significance level of 95%) in the ranges tested. Furthermore, its value was found to
be significantly different from zero (significance level of 95%) with a value of
0.110 f 0.008 ppm.
Changes in dissolved oxygen content in the packaged orange juice during storage
were modelled for all the temperatures tested according to the model above
described. The rate constant K was estimated by non-linear fitting of eqn (7) to the
experimental data, using the Kaleida Graph 3.0.1, 1993 Abelbeck software. This
parameter showed values between 2.69 and 0.167 day-’ (Table 3). Reaction rate
constant values of the same order of magnitude were reported for oxygen-
dependent reactions by Hsieh and Harris (1993) in water and a solution of sucrose
in water, and by Mack et al. (1976) in an infant food. The estimated rate constants
(K) and the equilibrium concentration (CgZ) values were further used to calculate
the rate constant of the consumption reactions (KR) and the mass transfer coeffi-
cient (K,) [eqns (8) and (9)], assuming kb equal to unity. The values obtained show
that the mass transfer coefficient is three orders of magnitude smaller than the
consumption rate constant, which is in accordance with the fast decrease in oxygen
concentration and the low level of oxygen at equilibrium. It was found that the
220 L. M. Ahmt et al.
0
0 IO 20 30 40 50 60 70 80
Storage time (days)
Fig. 2. Depletion of dissolved oxygen concentration during time in packaged orange juice at
2O”C, experimental data and model fit.
+ 10% (kb equal to 0.9 or l.l), the estimated values of KR were not statistically
different from the value estimated considering k, = 1. The dependence of the reac-
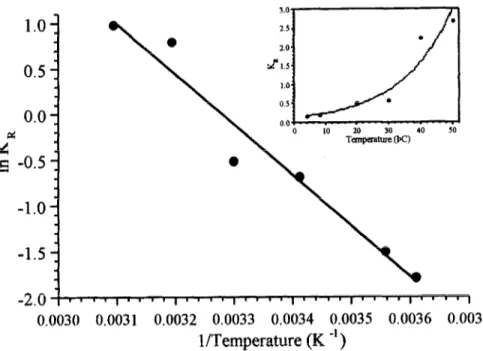
tion rate constant (&) on temperature followed an Arrhenius type relationship
(Fig. 3) with activation energy (E,) of 46 kJ/mole and pre-exponential factor (&) of
82 x lo6 (day-‘).
The mass transfer coefficients are of the same order of magnitude as those
measured with the OXTRAN, although at 40°C the estimated I& value is Stimes
greater than the OXTRAN value. Their dependence on temperature, for tempera-
tures lower than 40°C follows an Arrhenius type equation, with an activation energy
of 37.5 kJ/mol, also similar to that found for the OXTRAN values (35.4 kJ/mol).
These values reveal a sensitivity to temperature somewhat larger than the expected
for diffusional processes (Garrote et al., 1988; Rodger et al., 1984) and may be due
to the effect of temperature on oxygen solubility in the package and in the juice.
Validation of the model
Because of the fast decrease in oxygen concentration, our data do not allow for a
very accurate assessment of the proposed mathematical model. Therefore, the ade-
quacy of the model to predict oxygen concentration changes in stored orange juice
was further checked using two additional sets of experimental data found in recent
literature: from Roig et al. (1994) and Barron et al. (1993).
Data from Roig et al. (1994) are related to the dissolved oxygen content changes
TABLE 3 Values of Reaction Rate Constants, Rate Constant of Oxidative Reactions and Oxygen Mass Transfer Coefficient of Oxygen in Orange Juice Stored at Different Temperatures, from Roig et al. (1994) for Orange Juice and Barron et al. (1993) for Apple Juice Temperature ‘Our data’ Roig et al. (1994) Barron ef al. (1993) (“C) (da;- ‘, (day- ‘) (day”) I d R (da;- ‘) (day ‘) (day’~.I@ R (da;-i, (day. ‘) (df$‘) R 4 0.167+0.009 0.167+0.009 6.3kO.6 0.996 0.024+0.013 0.024+0.013 4.7 rfr. 2.6 0.988 2: 0.222 0.50 kO.06 k 0.009 0.222 0.50 + k 0.06 0.009 8.4 2Ok3 +0.7 0.953 0.999 0.072rfrO.039 0.071 kO.039 15 + 8.1 0.937 25 30.6k2.8 30.2+7.5 0.39kO.04 0.999 $! 0.59 f 0.04 0.59+0.04 24+2 0.994 0.20*0.11 0.20 * 0.11 44.7 + 24 0.996 z: 2.24 2.69kO.17 + 0.08 2.24 2.69kO.18 +0.08 120 95+8 f 10 0.999 0.997 76 1.50+0.79 1.50 f 0.79 373 + 196 0.999 105 5.1 k2.6 5.1 k2.6 1371+709 1 R, regression coefficient, is presented for each set of data as a fit quality indicator. t3 N _ ._
222 L. A4. Ahmt et al.
1.0:
-1.5 ‘:
-2.0
I" "I" ” 1’ ’ ” I""1" " I ” ” 1 ""I0.0030 0.0031 0.0032 0.0033 0.0034 0.0035 0.0036 0.0037
1 /Temperature (K -‘)
Fig. 3. Arrhenius plot for the reaction rate constant of oxygen consumption.
oxygen into a 200 ml carton, after 1 month, when the package is stored at 18°C
(uptake rate ~0.009 cm3 02/pack.day), which is similar to the results reported in the
present work (Table 2). Using our model, a good correlation between experimental
and predicted dimensionless oxygen concentration values was observed. Estimated
values of the reaction rate constants, rate constant of oxidative reactions and oxygen
mass transfer coefficients are presented in Table 3 [K values were estimated by
simultaneous optimisation of several isothermal experiments, using a Fortran pro-
gram based on the Simplex method (Nelder & Mead, 1965)]. The oxidative reaction
rate constants showed an Arrhenius type dependency on temperature with an activa-
tion energy of 46 kJ/mol (similar to that reported in the present work) and a
pre-exponential factor (K,) of 12SE6 (day-l). The estimated equilibrium oxygen
concentration was 0.582 ppm. This value is higher than the one obtained in our
study. This difference may be related to the importance of the seal on oxygen
exchanges: the smaller the package, the greater the relative contribution of the seal
to the total oxygen uptake.
Data from Barron et al. (1993) are related to changes in dissolved oxygen content of apple juice samples stored at 25.0 +0.2”C and 45 +_3% of RH (in a controlled
atmosphere chamber), in 0.77 1 HDPE cylindrical packages (top and bottom insu-
lated). Authors report an average oxygen permeability constant for HDPE of
10600 cc-ml/m2.atm.day (~98.2 ml of Odpack.day). This material is much more
permeable to 0, than those tested before, and therefore the relative importance of
the oxygen transfer through the package should be higher, allowing for a better test
of the model proposed in the present work. Values of the rate constant, rate
Modelling of dissolved oxygen concentration during storage of packaged liquid foods 223
4
0,oo 0,Ol 0,02 0,03 0,04
Storage time (days)
0,055 0,06
Fig. 4. Depletion of dissolved oxygen concentration during storage of apple juice at 25°C:
experimental data from Barron et al. (1993) and model fit.
The estimated equilibrium oxygen concentration
shows that the model fits the experimental data very
was 3.49kO.23 ppm. Figure 4
well.
CONCLUSIONS
A model combining oxygen transfer through the package and oxygen consumption
within the package, assuming no oxygen stratification in the juice, described well the
oxygen changes in packaged orange juice stored at temperatures from 4 to 50°C.
It was found that the oxidative reactions in juice packed in Tetra Pak are limited by the mass transfer through the package being high enough to maintain a residual
oxygen concentration in the juice. The package permeability was much smaller than
the oxidative rate constant.
The model was also applied to reported data, including packaging materials with
a much lower barrier to oxygen, also with good results.
REFERENCES
Barron, F.H., Harte, B., Giancin, J. & Hernandez, R. (1993). Modelling of oxygen diffusion through a model permeable package and simultaneous degradation of vitamin C in Apple juice. Packaging Technology and Science, 6, 301-309.
Garrote, R.L., Silva, E.R. & Bertone, R.A. (1988). Effect of freezing on diffusion of ascorbic acid during water heating of potato tissue. Journal of Food Science, 53,473-487.
224 L. M. Ahm& et al.
Graumlich, T.R., Marcy, J.E. & Adams, J.P. (1986). Aseptically packaged orange juice and concentrate: a review of the influence of processing and packaging conditions on quality.
Journal of Agriculture and Food Chemisty, 34402-405.
Hsieh, Y.P. & Harris, N.D. (1993). Effect of sucrose on oxygen uptake of ascorbic acid in a closed aqueous system. Journal of Agriculture and Food Chemistry, 41, 259-262.
Mack, T.E., Heldman, D.R. & Singh, R.P. (1976). Kinetics of oxygen uptake in liquid foods.
Journal of Food Science, 41,309-312.
Meydav, S., Saguy, I. & Kopelman, I.J. (1977). Browning determination in citrus products.
Journal of Agticulture and Food Chemistry, 25, 602.
Nelder, J.A. & Mead, R. (1965). A Simplex method for function minimization. The Computer Journal, 7,308-313.
Quast, D.G. & Karel, M. (1971). Effects of oxygen diffusion on oxidation of some dry foods.
Journal of Food Technology, 6, 95-98.
Quast, D.G. & Karel, M. (1972). Computer simulation on storage life of foods undergoing spoilage by two interacting mechanisms. Journal of Food Science, 37, 679-683.
Quast, D.G., Karel, M. & Rand, W.M. (1972). Development of a mathematical model for oxidation of potato chips as a function of oxygen pressure, extent of oxidation and equili- brium relative humidity. Journal of Food Science, 37, 673-678.
Ragnarsson, J.O. & Labuza, T.P. (1977). Accelerated shelf-life testing for oxidative rancidity in foods-a review. Food Chemistry, 2, 291-308.
Rodger, G., Hastings, R., Cryne, C. & Bailey, J. (1984). Diffusion properties of salt and acid into herring and their subsequent effect on muscle tissue. Journal of Food Science, 49,
714-720.
Roig, M.G., Bello, J.F., Rivera, Z.S. & Kennedy, J.F. (1994). Possible additives for extension of shelf life of single strength reconstituted juice aseptically packaged in laminated cartons.
International Journal of Food Science and Nutrition, 45, 15-28.
Sadler, G.D. (1984). A mathematical prediction and experimental confirmation of food quality loss for products stored in oxygen permeable polymers. PhD thesis, Purdue Univer- sity, USA.
Singh, R. P. (1974). Computer simulation of liquid food quality during storage. PhD Thesis, Michigan State University, U.S.A.
Singh, R.P., Heldman, D.R. & Kirk, J.R. (1976). Kinetics of quality degradation: ascorbic acid oxidation in infant formula during storage. Journal of Food Science, 41, 304-308.