João Júlio Martins
Licenciatura em Biologia Celular e Molecular
Ontogenesis of visual processing circuits
in the zebrafish: analysis of specific
neuronal subpopulations in development.
Dissertação para obtenção do Grau de Mestre em Genética Molecular e Biomedicina
Orientador: Doutora Ruth Diez del Corral, Fundação
Champalimaud
Júri:
Presidente: Professora Doutora Paula Maria Theriaga Mendes Bernardes Gonçalves
Arguente: Doutora Joana Freire de Castiço Monteiro Vogal: Doutora Ruth Diez del Corral
João Júlio Martins
Licenciatura em Biologia Celular e Molecular
Ontogenesis of visual processing circuits
in the zebrafish: analysis of specific
neuronal subpopulations in development
Dissertação para obtenção do Grau de Mestre em Genética Molecular e Biomedicina
Orientador: Ruth Diez del Corral, Fundação Champalimaud
Júri:
Presidente: Professora Doutora Paula Maria Theriaga Mendes Bernardes Gonçalves
Arguente: Doutora Joana Freire de Castiço Monteiro Vogal: Doutora Ruth Diez del Corral
iii Ontogenesis of visual processing circuits in the zebrafish: analysis of specific neuronal subpopulations in development
Copyright João Júlio Martins, FCT/UNL, UNL
A Faculdade de Ciências e Tecnologia e a Universidade Nova de Lisboa têm o direito, perpétuo e sem limites geográficos, de arquivar e publicar esta dissertação através de exemplares impressos reproduzidos em papel ou de forma digital, ou por qualquer outro meio conhecido ou que venha a ser inventado, e de a divulgar através de repositórios científicos e de admitir a sua cópia e distribuição com objetivos educacionais ou de investigação, não comerciais, desde que seja dado crédito ao autor e editor.
v
Acknowledgments
First of all I want to thank every member of the Michael Orger lab, for the support, and guidance, I want to specially Ruth Diez del Corral, for all the guidance, teachings, patience and for being the best advisor ever.
I want to thank all the work the different platforms do at CCU, the fish facility for taking so very well care of the fish, for all the help and assistance to make this project flow very smoothly.
A special thank you to the Champalimaud Foundation ABBE (Advanced Bio-imaging and Bio-optics Experimental) for their expert support and microscopy infrastructure, and for teaching me so much cool things in the world of microscopy.
On a more personal note I want to thank all the future “mestres de obras”, every friend I have at the CCU, Sara Júlio, Pedro Durão, Carmo Soares, Martin, Joana Lérias, Zeta, Inês Silva, and all others I don’t remember right now and the ones that already left.
On an even more personal note, I want to thank all my closest friends (bichos do magoito), family and a very special thank you, to the girl of my dreams, Manga.
vii
Resumo
A larva de zebrafish (Danio rerio) é um modelo ideal para a identificação de circuitos neuronais, por exemplo comportamentos associados à visão, como as respostas optomotora e optocinética. O uso de larvas que expressam o indicador de nível de cálcio GCaMP em subpopulações neuronais específicas, permite o registo da atividade desses neurónios e facilita a sua caracterização anatómica e funcional. Neste contexto, o nosso objetivo é caracterizar algumas destas subpopulações recorrendo à expressão de GFP usando o sistema Gal4-UAS, durante os primeiros 6 dias de desenvolvimento. Para examinar e caracterizar a expressão da GFP em larvas de zebrafish, aplicámos um protocolo de imunofluorescência e registámos imagens 3D obtidas por microscopia confocal. Esta informação reunida de vários indivíduos equivalentes e registada num cérebro de referência pode ser usada para estabelecer atlas anatómicos nestas fases iniciais de desenvolvimento que complementarão aqueles já desenvolvidos. A caracterização das linhas transgénicas permitirá localizar os grupos celulares funcionais com mais precisão. Este trabalho foca-se em linhas que expressam GFF ou GFP a partir de uma inserção próxima das regiões promotoras dos genes olig2, chrna4 e pcp4a. Duas destas linhas (olig2: GFP e chrna4: GFF) representam um padrão de expressão semelhante ao gene original, ao contrário da linha pcp4a: GFF, ainda assim a sua caracterização é útil para complementar os mapas funcionais de atividade neuronal. Além disso, recorrendo a microscopia de Lightsheet conseguimos acompanhar a dinâmica de diferenciação neuronal e extensão de projeções durante as 20-48 horas pós fertilização de uma linha já caracterizada no laboratório (Chat: GFF).
Palavras-Chave: Zebrafish, olig2, chrna4, pcp4a pitx2c, chat, Confocal, Light Sheet, Caracterização Anatómica.
ix
Abstract
The Zebrafish (Danio rerio) larva is an ideal model for identification of neuronal circuits such as those associated with visually guided behaviors like the optomotor and the optokinetic responses. The use of larvae expressing the calcium level indicator GCaMP in particular neuronal subpopulations allows monitoring of activity of these neurons and facilitates their anatomical and functional characterization. Our goal, in this context, is to characterize some of these subpopulations taking advantage of the expression of GFP using the Gal4-UAS system during the first 6 days of development. To examine and characterize the GFP expression in zebrafish larvae, we have applied an immunofluorescence protocol and recorded anatomical stacks using confocal imaging. This information gathered from several equivalent individuals and registered to a reference brain may then be used to establish anatomical atlases at these early stages of development that will complement those already developed for the 6 dpf larvae. Characterization of the transgenic lines at the early stages will help us to locate the functional clusters identified at 6 dpf with more anatomical accuracy and precision. We will present our work focusing on zebrafish lines, generated using a BAC transgenic approach, that expresses GFF or GFP from an insertion next to the olig2, chrna4 and pcp4a promoter regions. Two of these lines (olig2: GFP and chrna4: GFF) are shown to represent a similar pattern of expression has the original gene, whilst the pcp4a: GFF line does not, although its characterization is still of use to complement functional maps of neuron activity. In addition, we are using time lapse imaging with Lightsheet microscopy to follow the dynamics of neuronal differentiation and extension of projections during the 20-48 hours post fertilization period on an already characterized line(Chat:GFF).
Keywords: Zebrafish, olig2, chrna4, pcp4a pitx2c, chat, Confocal, Light sheet, Anatomical Characterization.
xi
Table of contents
Acknowledgments ... v Resumo ... vii Abstract ... ix Table of contents ... xi Index of Figures ... xvIndex of Tables ... xvii
Abbreviations List ... xix
1-Introduction ... 1
1.1 The larval Zebrafish as a model system in neuroscience and developmental biology ... 1
1.2 Embryonic development of the zebrafish ... 1
1.2.1 Primary neurogenesis ... 2
1.2.2 Secondary neurogenesis ... 4
1.3 Neurite growth ... 4
1.4 Circuits involved in visually guided behaviors ... 6
1.4.1 Optomotor Response Circuit ... 6
1.4.2 Optokinetic Response Circuit ... 7
1.5 The use of transgenic lines to study neuronal subpopulations: tol2 mediated recombination and Gal 4 mediated reporter expression. ... 8
1.6 Anatomical characterization of the zebrafish brain and its circuits: Atlases ... 10
1.7 Characterization of specific neuronal subpopulations in zebrafish brain development: the use of transgenic lines ... 12
2. Materials and Methods ... 14
2.1 Fish Husbandry ... 14
2.2 Fish crosses and embryo collection ... 14
2.3 Transgenic Lines ... 14
2.4 Whole body fluorescent immunostaining ... 14
2.5 Mounting protocols ... 15
2.6 Confocal ... 15
2.7 Characterization of the Lines... 15
2.8 Lighsheet ... 16 2.9 Solutions ... 16 2.10 Antibodies ... 16 3. Results ... 17 3.1 Olig2:eGFP - GFP expression ... 17 3.1.1 Olig2:eGFP 1dpf ... 18 3.1.2 Olig2:eGFP 2dpf ... 18
xii
3.1.3 Olig2:eGFP 3dpf ... 19
3.1.4 Olig2:eGFP at 4dpf, 5dpf and 6dpf ... 20
3.1.5 Olig2:eGFP Expression summary ... 22
3.1.5.1 Olig2:eGFP expression in the telencephalon. ... 22
3.1.5.2 Olig2:eGFP expression in the diencephalon. ... 22
3.1.5.3 Olig2:eGFP expression in the mesencephalon. ... 23
3.1.5.4 Olig2:eGFP expression in the rhombencephalon ... 23
3.1.5.5 Olig2:eGFP expression in the retina, ganglia and spinal cord. ... 23
3.2 Chrna4:GFF UAS:GFP - GFP expression ... 23
3.2.1 Chrna4:GFF UAS:GFP 1dpf ... 24
3.2.2 Chrna4:GFF UAS:GFP 2dpf ... 24
3.2.3 Chrna4:GFF UAS:GFP 3dpf ... 25
3.2.4 Chrna4:GFF UAS:GFP 4dpf ... 25
3.2.5 Chrna4:GFF UAS:GFP 5dpf and 6dpf ... 26
3.2.6 Chrna4:GFF UAS:GFP expression summary ... 27
3.2.6.1 Chrna4:GFF UAS:GFP expression in the telencephalon. ... 27
3.2.6.2 Chrna4:GFF UAS:GFP expression in the diencephalon.. ... 27
3.2.6.3 Chrna4:GFF UAS:GFP expression in the mesencephalon. ... 28
3.2.6.4 Chrna4:GFF UAS:GFP expression in the rhombencephalon... 28
3.2.6.5 Chrna4:GFF UAS:GFP expression in the retina, ganglia and spinal cord. ... 28
3.3 pcp4a:GFF UAS:GFP - GFP Expression ... 28
3.3.1 pcp4a:GFF UAS:GFP 1dpf ... 28
3.3.2 pcp4a:GFF UAS:GFP 2dpf ... 29
3.3.3 pcp4a:GFF UAS:GFP 3dpf ... 30
3.3.4 pcp4a:GFF UAS:GFP 4dpf, 5dpf and 6dpf ... 30
3.3.5 pcp4a:GFF UAS:GFP expression summary ... 32
3.3.5.1 pcp4a:GFF UAS:GFP expression in the telencephalon. ... 32
3.3.5.2 pcp4a:GFF UAS:GFP expression in the diencephalon. ... 32
3.3.5.3 pcp4a:GFF UAS:GFP expression in the mesencephalon. ... 32
3.3.5.4 pcp4a:GFF UAS:GFP expression in the rhombencephalon ... 32
3.3.5.5 pcp4a:GFF UAS:GFP expression in the retina, ganglia and spinal cord. ... 33
3.4 Live Imaging of early embryos ... 33
4. Discussion ... 36
4.1 GFP expression in transgenic lines and “host” gene expression patterns ... 36
4.1.1 OLIG2:eGFP ... 37
xiii 4.1.3 PCP4A:GFF UAS:GFP ... 38 4.2 Lightsheet ... 40 References ... 43
xv
Index of Figures
Figure 1.1 Tracts and neuronal clusters in the early zebrafish brain ...3
Figure 1.2 Optomotor and Optokinetic responses in zebrafish ...6
Figure 1.3 Schematic Model for the nMLF as a Center for Sensorimotor Processing and Locomotor Drive ...7
Figure 1.4 Schematic Model for the OKR Circuit ...8
Figure 1.5 Representation of the Gal 4-UAS system ...9
Figure 3.1 GFP expression in a 1dpf olig2: GFP zebrafish brain ...19
Figure 3.2 GFP expression in a 2dpf olig2: GFP zebrafish brain ...20
Figure 3.3 GFP expression in a 3dpf olig2: GFP zebrafish brain ...21
Figure 3.4 GFP expression in a 4dpf, 5dpf and 6dpf olig2: GFP zebrafish brains ...22
Figure 3.5 GFP expression in a 1dpf chrna4: GFF UAS: GFP zebrafish brain ...25
Figure 3.6 GFP expression in a 2dpf chrna4: GFF UAS: GFP zebrafish brain ...25
Figure 3.7 GFP expression in a 3dpf chrna4: GFF UAS: GFP zebrafish brain ...26
Figure 3.8 GFP expression in a 4dpf chrna4: GFF UAS: GFP zebrafish brain ...27
Figure 3.9 GFP expression in a 5dpf and 6dpf chrna4: GFF UAS: GFP zebrafish brains ...27
Figure 3.10 GFP expression in a 1dpf pcp4a: GFF UAS: GFP zebrafish brain ...30
Figure 3.11 GFP expression in a 2dpf pcp4a: GFF UAS: GFP zebrafish brain ...30
Figure 3.12 GFP expression in a 3dpf pcp4a: GFF UAS: GFP zebrafish brain ...31
Figure 3.13 GFP expression in a 4dpf, 5dpf and 6dpf pcp4a: GFF UAS: GFP zebrafish brains ...32
Figure 3.14 Light sheet ventral projections of a pitx2c: GFP HuC: GFF UAS: Lyn-mCherry zebrafish embryo ...34
xvii
Index of Tables
Table 1.1 Summary of the atlases available and their main characteristics ...12
Table 2.1 Table of the antibodies and stains used for all protocols ...17
Table 3.1 Olig2: eGFP expression summary table ...24
Table 3.2 Chrna4: GFF UAS: GFP expression summary table ...28
xix
Abbreviations List
ac - Anterior commissure AP - Anteroposterior cCer - Corpus cerebelli Cer – Cerebellum
cHync – Caudal hypothalamus neural cluster Di - Diencephalon
Dpf- Days post fertilization EGr - Eminentia Granularis EP – pigmented epithelium GCL –Ganglion cell layer GFP – Green fluorescent protein Ha - Habenula
Hpf – Hours post fertilization Hy – Hypothalamus
IC – Intertectal Commissure inl- Inner nuclear layer ipl – Inner plexiform layer LcCer - Lobus caudallis cerebelli Met – Metencephalon
mlf – Medial longitudinal fasciculus MO- Medulla oblongata
NpR x - Neuropil Region x OB – Olfactory bulb Oc – Optic chiasm
Ocn IV – Oculomotor nucleus IV OE – Olfactory epithelium opl – Outer plexiform layer Pa - Pallium
pc – Posterior commissure Pi – Pineal Gland
Po - Preopctic area
poc - Post-optic commissure Pr - Pretectum
PTub - Posterior tuberculum Rho – Rhombencephalon SC – Spinal Cord
xx SubPa - Sub-pallium
Teg - tegmentum Tel - Telencephalon TeO - Optic tectum TeOn - TeO neuropil
TeOsp - TeO stratum periventriculare Tha - Thalamus
ThaE - Thalamic eminance Ts - Torus semicircularis VagR - Vagal region vcc – Ventral caudal cluster vCer - Valvula cerebelli
vpni - Velocity to position neural integrator vPTub - Ventral Posterior Tuberculum vrc - Ventral rostral cluster
vsm - Velocity storage mechanism vTha - Ventral thalamus
1
1-Introduction
1.1 The larval Zebrafish as a model system in neuroscience and developmental biology
The use of Zebrafish in research has grown exponentially in the past decades, becoming, in just a few years, one of the most used animal models, with substantial contributions to biomedicine and neuroscience. (Howe et al., 2013; Martins et al., 2016)The zebrafish (Danio rerio) is a cyprinid fish found throughout Southern Asia, including northern and northeastern India, Bangladesh and Nepal, in rivers, small streams, other channels, and rice paddies. (Engeszer, Patterson, Rao, & Parichy, 2007) It shares 10.660 genes with human, mouse and chicken, with about 70% homology with human genes. (Howe et al., 2013)
They are easy to breed, amenable to genetic manipulations and transparent at embryonic and early larval stages. The larval brain has a size of <0.5 mm3 and contains about 100,000 neurons. (Marquart et al., 2017; Randlett et al., 2015) These advantages allow to have a high number of larvae with virtually all neurons accessible to multiphoton microscopy in vivo at once. (Del Bene & Wyart, 2012; Friedrich, Jacobson, & Zhu, 2010) For these and other reasons the larval stage zebrafish is a very popular model to address important questions in many different areas of systems and circuits neuroscience. (Feierstein, Portugues, & Orger, 2015; Friedrich et al., 2010; Randlett et al., 2015) Despite their compact nervous systems and their age of less than 1 week, these animals are capable of a diversity of behaviors. These include swimming in three dimensions, escape maneuvers, visually guided hunting, learning and sleep. (Randlett et al., 2015)
Typically, the behaviors that have been studied in larvae are innate, reflexive responses, for example the Optomotor Response (OMR) and the Optokinetic Response. (Orger & de Polavieja, 2017; Portugues & Engert, 2009; Severi et al., 2014)
Zebrafish offer an opportunity, among vertebrate model systems, to unravel the brain’s vast complexity. The rapid pace of research in this area should bring a greater understanding of behavior ontogeny, and improved tools that will make zebrafish an appealing system for more studies in genetics, development and neuroscience. (Orger & de Polavieja, 2017; Randlett et al., 2015; Scott, 2009)
1.2 Embryonic development of the zebrafish
Development of the zebrafish is comprised of several distinct phases that include: zygote (0-0.75 hpf) (hours post fertilization); cleavage (0.75-2.25 hpf); blastula (2.25-5.25 hpf); gastrula (5.25-10 hpf); segmentation (10-24 hpf); Pharyngula (1-2 dpf)(days post fertilization); (Kimmel, Ballard, Kimmel, Ullmann, & Schilling, 1995)
The central nervous system (CNS), during the segmentation phase, starts to change from a flat sheet of ectodermal cells, the neural plate, to a neural tube that forms in a process called primary neurulation. This, in most vertebrates, involves the invagination of the neural plate until the lateral edges meet and
2 fuse at the dorsal midline, forming a hollow tube. In contrast, cell movements in the neural plate of zebrafish lead to the formation of a solid rod-like structure known as the neural keel at approximately 12 hpf. (Rubenstein & Rakic, 2013)
At 16 hpf ten swellings (or neuromeres) are present along the rostro-caudal axis of the neural tube (Kimmel et al., 1995). The seven most caudal neuromeres correspond to the rhombomeres, while the anterior three neuromeres correspond to the early telencephalon, diencephalon and midbrain. By the end of the segmentation stage, significant cell movements and constrictions in the wall of the neural tube have led to the formation of the major subdivisions of the brain. (Rubenstein & Rakic, 2013)
These neuromeres are restricted by gene expression profiles, leading to presumptive neural domains such as the forebrain, midbrain, and hindbrain. This early neural patterning involves interactions between retinoic acid (RA), FGF, and Wnt signals. Early Anteroposterior (AP) patterning also establishes secondary organizers in the diencephalon, and the Isthmic Organizer at the midbrain-hindbrain boundary. (Rubenstein & Rakic, 2013)
The forebrain is composed of the telencephalon and diencephalon while the midbrain is composed of the tectum dorsally and the tegmentum ventrally. The cerebellum is derived from the midbrain/hindbrain boundary and Rhombomere 1. (Kimmel et al., 1995)
The hindbrain at 20hpf consists of seven functionally distinct rhombomeres tapering caudally to the spinal cord. At 24 hpf the spinal cord is continuous with no obvious morphological distinctions along its rostro-caudal axis. (Kimmel et al., 1995)
1.2.1 Primary neurogenesis
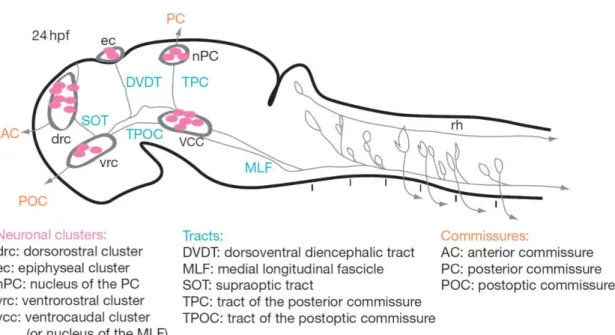
During an initial phase, all cells in the neural tissue are actively proliferating, but from 14 hpf, some cells exit the cell cycle to differentiate as neurons in a process designated as primary neurogenesis. The first neuronal clusters appear in stereotyped positions between 14 and 24 hpf they give rise to long axons forming a simple scaffold of axon tracts and commissures connecting different areas of the brain (figure 1.1), the scaffold is composed of two longitudinal tracts (tract of the postoptic commissure = TPOC, medial longitudinal fascicle = MLF), three transversal tracts (supraoptic tract = SOT, dorsoventral diencephalic tract = DVDT, tract of the posterior commissure = TPC) and it also includes four commissures (anterior commissure = AC, postoptic commissure = POC, posterior commissure = PC, ventral commissure = VC). (Hjorth & Key, 2002; Rubenstein & Rakic, 2013)
The neuronal clusters that form the early scaffold are present in three areas, the telencephalon (dorso-rostral cluster), hypothalamus (ventral-(dorso-rostral cluster) and tegmentum (ventral-caudal cluster) (Fig 1.1). (Hjorth & Key, 2002; Rubenstein & Rakic, 2013)
The first axons to navigate the brain emerge from the vcc, they grow caudally pioneering the medial longitudinal fasciculus (MLF), later neurons from this cluster project axons rostrally into the tract of the post-optic commissure (TPOC). (Chitnis’ & Kuwadai, 1990; Ross, Parrett, & Easter, 1992).
3 By 18 hpf the first axons in the forebrain emerge from the vrc and grow caudally to pioneer the TPOC (Chitnis & Kuwada, 1990; Ross et al., 1992)
In the midbrain, at approximately 20 hpf, neurons of the nTPC project axons ventrally to pioneer the tract of the posterior commissure (TPC). (Hjorth & Key, 2002)
Cells of the nTPC also extend axons dorsally to establish the posterior commissure (PC) and contribute to the contralateral TPC. (Chitnis & Kuwada, 1990; Hjorth & Key, 2002; Wilson, Ross, Parrett, & Easter, 1990)
At 20 hpf the ventral commissure of the midbrain is formed by ventral growing axons from the vcc which cross the midline. The patterned neural plate described above serves as a basis for the establishment of the early neuronal scaffold, which supports the first embryonic and larval behaviors. (Rubenstein & Rakic, 2013)
This first wave of neurogenesis which converts neuroepithelial progenitors only into differentiated neurons is followed by a second phase starting at approximately 24 hours post fertilization (hpf). (Rubenstein & Rakic, 2013)
Figure 1.1: Tracts and neuronal clusters in the early zebrafish brain: Sagittal scheme of a 24 hpf brain, dorsal is to the left. Neuronal clusters (purple), tracts (blue), and commissures (red) are represented. Adapted from (Rubenstein & Rakic, 2013).
4 1.2.2 Secondary neurogenesis
Secondary neurogenesis first builds up on the primary scaffold increasing the number of neurons within each neuronal category. (Rubenstein & Rakic, 2013) In this second wave, both neurons and glia are produced as opposed to the early neurogenesis when only neurons are generated.
During secondary neurogenesis, some transient primary neuronal populations are also replaced. Finally, higher order circuits are established, permitting a finer modulation of larval behavior. Specifically, neuromodulatory monoaminergic circuits, neurohormones, and other regulatory systems involving excitatory and inhibitory neurotransmitters (glutamate, aspartate, GABA, glycine) are mostly established during this phase. (Rubenstein & Rakic, 2013)
The major signaling pathways, involved notably early on for the patterning of the neural plate, regulate at later stages the balance between proliferation and differentiation of neural progenitors. Newborn neurons migrate away from their birth location in the ventricular zone along distinct radial and tangential pathways to reach their final destination and integrate in the preexisting neural circuitry. (Rubenstein & Rakic, 2013)
1.3 Neurite growth
The first embryonic and larval behaviors are supported by an early neuronal scaffold, this primary scaffold, is composed of early born neurons. (Rubenstein & Rakic, 2013)
Outgrowth of axons during neuronal development is controlled by the growth cone at the tip of the axons. The growth cone is a highly motile structure at the distal tip of the axon, it has exceptionally differentiated cellular processes fulfilling several functions: it acts as sensor of environmental cues, signal transducer, and motility device.
To guide an axon towards the appropriate target, the growth cone must continuously sample the microenvironment for guidance cues and integrate this information rapidly into appropriate motility responses, this advance and targeting is mediated by specific extracellular cues which are diffusible, bound to cell membranes or the extracellular matrix, that trigger signaling cascades that eventually converge into the cytoskeleton. (Bagnard, 2007; Vidaki et al., 2017)
The axonal cytoskeleton is composed of three main filamentous polymers: neurofilaments, microtubules and actin microfilaments. Within the growth cone, actin filaments are one of the major cytoskeletal components. The peripheral domain (P-domain) is the most distal part of the growth cone, and highly dynamic, actin-rich structure. This domain possesses lamellipodia, which have actin filaments organized in a loose meshwork, from which many filopodia, with thick actin bundles, undergo elongation and retraction cycles allowing for the movement of the axon. (Bagnard, 2007)
The Actin filaments, that allow the elongation and retraction cycles, are helical polymers formed by addition of ATP-actin monomers, they are polarized structures characterized by a "pointed" and a "barbed" end. Attractive cues such as netrin-1 and nerve growth factor (NGF) stimulate axonal protein
5 synthesis of constituents of the cytoskeleton, whereas repulsive guidance cues like Sema3A and Slit2 induce local synthesis of proteins that promote the disassembly of the cytoskeleton. (Bagnard, 2007) Actin-associated proteins in the neuronal growth cone help regulate actin polymerization and depolymerization. (Bagnard, 2007)
Actin nucleation/polymerization factors increase the number of free barbed ends increasing actin polymerization and actin depolymerizing factors when phosphorylated, bind to the rear end of actin filaments, generating actin fragments. Other proteins, such as gelsolin, stop actin polymerization by capping barbed ends inducing depolymerization. Modulation of actin polymerization by extracellular guidance cues via actin-associated proteins provides a mechanism to regulate the progress of growth cones. Besides this, there is also local synthesis of proteins in the growth cone that encode for cytoskeletal regulators, cell-adhesion molecules, guidance receptors and components of signaling pathways, which help with actin polymerization and depolymerization and other changes to the cytoskeleton. (Bagnard, 2007; Cioni, Koppers, & Holt, 2018)
The existence of axonally synthesized proteins at a precise developmental stage and in specific compartments implies the existence of mechanisms to coordinate and control axonal translation according to local demand. This is partly due to the stage specific changes in the axonal transcriptome. Spatial restriction of protein synthesis in specific cellular compartments is due to an evolutionarily conserved mechanism that allows asymmetric localization of RNA and that confers spatial and temporal control of protein expression. Incorrect processing and delivery of mRNA can cause developmental defects along with defects in the fundamental axonal behaviors. (Cioni et al., 2018; Holt & Schuman, 2013; Shigeoka et al., 2016)
Eukaryotic mRNAs contain 5’ and 3’ untranslated regions (UTRs), a modified base at the 5’ end named “cap”, and a stretch of adenosines at the 3’ end named poly(A) tail to enable its translation. Regulation elements of mRNA transport and translation are found within the 3’ and 5’UTRs. 3’UTRs regulate multiple aspects of mRNA metabolism, including nuclear export, cytoplasmic localization, translational efficiency and mRNA stability, while the 5’UTR is primarily involved in controlling mRNA translation. A localization element was first identified within the 3’UTR of b-actin and was named “zipcode” because it was necessary for delivering b-actin mRNA to the leading lamellae of fibroblasts and to dendrites. (Andreassi et al., 2017)
Some mRNAs are targeted specifically to axons and dendrites and even to the growth cone. While there are several ‘‘zip codes”, there are many messages for which a clear consensus sequence in the UTR has not emerged. (Holt & Schuman, 2013)
6
1.4 Circuits involved in visually guided behaviors
1.4.1 Optomotor Response Circuit
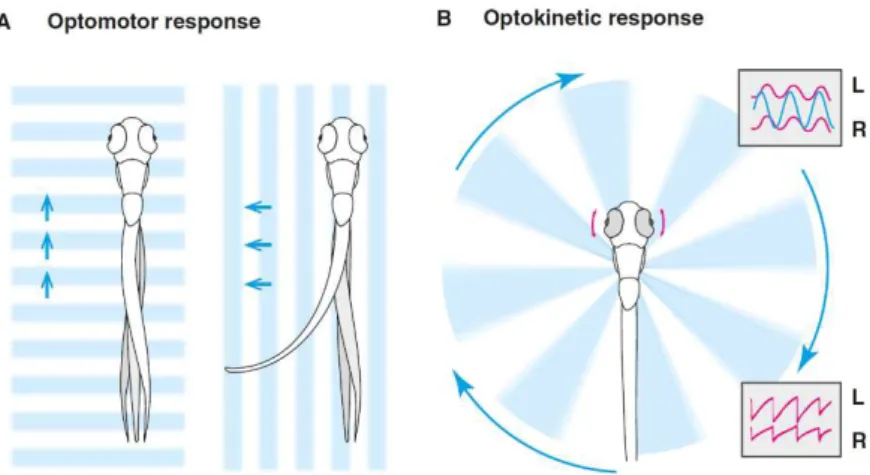
One innate sensory-driven locomotor behavior is the optomotor response (OMR), in which larvae respond to whole-field visual motion stimulus and will turn and swim in the direction of perceived motion (Fig 1.2). The OMR can be reliably evoked at 7 dpf and will persist throughout adulthood. Larvae will perform this behavior when swimming freely or when restrained.(Portugues & Engert, 2009) Orger and colleagues used a combination of quantitative behavioral analysis, in vivo two photon imaging and targeted ablations to study the response properties of these neurons and their role in transducing visual information into motor output. (Portugues & Engert, 2009)
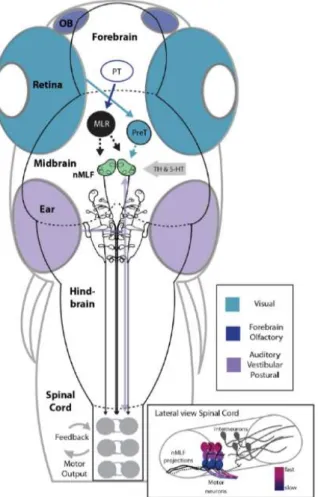
Olfactory inputs are processed in the forebrain and have been linked to a pathway leading to the Posterior Tuberculum (PT), the mesencephalic locomotor region (MLR), and to Reticulospinal cells (RS). The MLR, likely sends projections to the nucleus of the medial longitudinal fasciculus (nMLF). (Fig. 1.3) Visual inputs from the retina are relayed to visual processing areas such as the pretectum, from where projections may be relayed to the nMLF. (Fig. 1.3)
Vestibular inputs may be relayed via the tangential nucleus located next to the ear with projections to the nMLF. Together all of these inputs could be integrated in the nMLF to direct locomotion. The spinal cord is activated by descending glutamatergic inputs from the RS cells driving locomotor output and receiving proprioceptive feedback. (Fig. 1.3) (Severi et al., 2014)
Figure 1.2: Optomotor and Optokinetic responses in zebrafish. A-Optomotor response (OMR). Zebrafish swim to follow translational whole-field motion, which serves to stabilize their position in moving water. B-Optokinetic response (OKR). Rotational motion induces horizontal eye movements. The fish alternates between slow tracking movements and fast reset saccades.
7 Within the spinal cord, there is a dorsal-ventral arrangement of activation with ventral spinal interneurons and motor neurons activated at slow swimming frequencies, and more dorsal recruitment as locomotor intensity must increase. (Severi et al., 2014)
1.4.2 Optokinetic Response Circuit
The Optokinetic Response (OKR) is one of the more widely studied behaviors, due to its reliability and to the fact that larvae will perform it even when immobilized.(Portugues & Engert, 2009) Neuronal responses during OKR are left-right symmetric and highly stereotyped across fish. (Portugues, Feierstein, Engert, & Orger, 2014)
The optokinetic response (OKR) is a reflexive behavior that reduces image motion on the retina, it is found in almost all vertebrates, and it consists in the rotational movement of the eyes in response to a whole-field rotational motion stimulus. (Portugues et al., 2014) These eye movements consist of two components: a smooth pursuit followed by a fast saccade to reset the eyes once the object has left the visual field (Fig 1.2). (Portugues & Engert, 2009)
Figure 1.3: Schematic Model for the nMLF as a Center for Sensorimotor Processing and Locomotor Drive from (Severi et al., 2014).
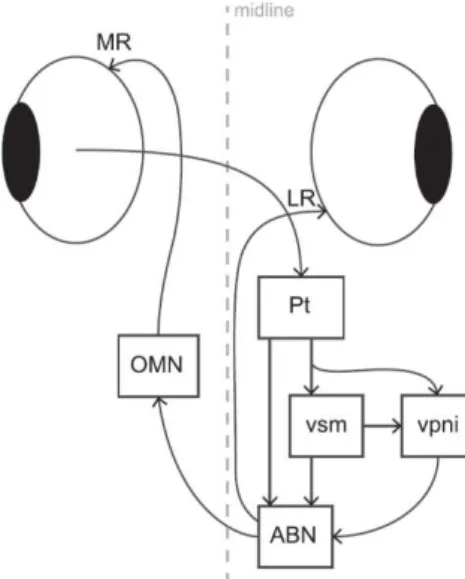
8 On the OKR, the input from the pretectum is conveyed to extraocular motor neurons, directly or indirectly, via circuits including a velocity storage mechanism (vsm) and velocity to position neural integrator (vpni). The response takes place when the abducens nucleus (ABN) coordinates ipsiversive eye movements via the lateral rectus muscle (LR) and sends signals to the contralateral oculomotor nucleus (OMN) to drive contraversive movements of the stimulated eye via the medial rectus muscle (MR).
The cerebellum receives OKR-related sensory and motor signals through mossy fibers and, in particular, retinal image motion signals via climbing fibers from the contralateral inferior olive, which in turn receive direct input from the pretectum (Fig 1.4).
Portugues et al reveals that network activity in the vertebrate brain during a simple behavior is sparse and widely distributed, but shows a spatial organization that can be stereotyped across individuals. (Portugues et al. 2014) such that it is possible to reliably predict the activity in individual voxels from their anatomical position alone. This has important practical consequences, because these areas can now be targeted, for ablations, electrophysiological recordings, optogenetics, or photo activation. (Portugues et al., 2014; Ronneberger et al., 2012)
1.5 The use of transgenic lines to study neuronal subpopulations: tol2 mediated
recombination and Gal 4 mediated reporter expression.
To understand how sensory information is transformed in a certain behavior, we have to fully understand the morphology, connectivity and function of clusters of neurons or even individual neurons. For this purpose genetic tools are increasingly being used to visualize, manipulate and monitor neurons in zebrafish, by easily activating transgene expression in specific subsets of neurons with a high degree of cell-type specificity. (Asakawa & Kawakami, 2008; Marquart et al., 2015; Scott et al., 2007) One of
Figure 1.4: Schematic Model for the OKR Circuit adapted from Portugues et al., 2014
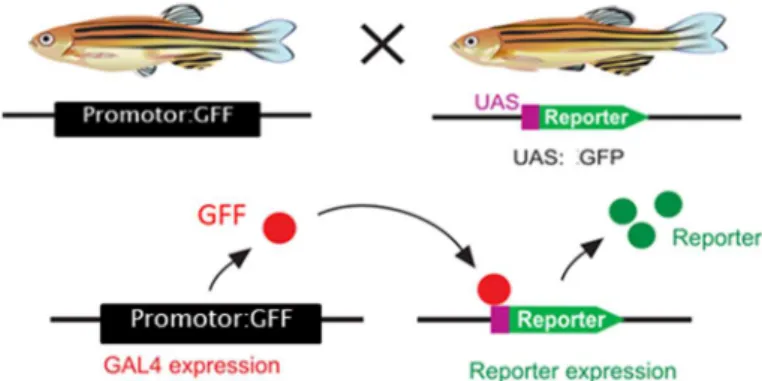
9 these tools is the binary transgenic expression systems Gal4/UAS, this system is a powerful tool for dissecting neuronal circuitry and has provided the zebrafish community with many valuable lines. (Marquart et al., 2015)
The Gal4-UAS system was first used in drosophila were the expression of Gal4 drove the expression of the lacZ gene that was downstream of the UAS. Since then it has been shown that this system also works on zebrafish. (Asakawa & Kawakami, 2008)
Gal4 is a yeast transcriptional activator consisting of 881 amino acids (Asakawa & Kawakami, 2008). In cells where the Gal4 gene is expressed, the Gal4 protein targets its Upstream Activating Sequence (UAS), thus driving expression of any gene linked downstream to a UAS element. As a result, animals carrying both transgenes will have expression of any chosen gene attached to the UAS element. (Fig. 1.5) (Asakawa & Kawakami, 2008; Scott, 2009)
To have a defined pattern of transgene expression, enhancer trapping can be used by linking a specific enhancer to Gal4, different and multiple genes can also be downstream of the UAS which allows for expression of a variety of genes and a variety of expression patterns. Having the Gal4 line separated from the UAS line allows for all types of combinations. Phenotypes can be analyzed in double transgenic offspring obtained by the cross of these fish. (Asakawa & Kawakami, 2008; K. Kawakami, Asakawa, Hibi, et al., 2016; Scott, 2009)
For this work Gal4FF, or GFF was used, GFF is a Gal4 variant that contains the DNA-binding domain of Gal4 and two short transcriptional activation motifs from VP16, which have a weaker transcriptional activity than VP16 but showed no obvious toxicity when compared to Gal4 and Gal4-VP16(Asakawa & Kawakami, 2008)
The Gal4-UAS system had not been applied effectively to vertebrate systems mainly due to the lack of an efficient transgenesis method. A more efficient transgenesis method based on the medaka fish Tol2 element was developed in zebrafish which allows the generation of vast numbers of transgenic lines and fish. (Asakawa & Kawakami, 2008; Koichi Kawakami et al., 2004; Scott, 2009)
The Tol2-mediated transgenesis has now become a standard approach to create transgenic zebrafish since its more efficient, between 50 and 70% of fish injected will become founder fish that transmit
Figure 1.5: Representation of the Gal 4-UAS system, the driver line is using a variant of gal4 GFF adapted from Asakawa (2008).
10 transgenes to the offspring. (Asakawa & Kawakami, 2008; K. Kawakami, Asakawa, Muto, & Wada, 2016)
The system works by injecting tol2 transposase mRNA and a plasmid DNA with a transposon construct into one cell stage zebrafish eggs. The Tol2 construct is excised from the donor plasmid and integrated into the genome of the germ lineage during embryonic development, and the transposon insertions are transmitted to the next generation very efficiently as mentioned before. Since Tol2 has a surprisingly large cargo capacity (more than 50 kb) and can carry efficiently BAC inserts, which can carry up to 300kb of DNA fragments, into the zebrafish. (K. Kawakami, Asakawa, Muto, et al., 2016)
Two major advantages of Tol2-mediated BAC transgenesis over existing methods are increased efficiency of germline transmission and greater reliability of obtaining single-copy integrations in the genome. (K. Kawakami, Asakawa, Muto, et al., 2016)
Tol2-mediated BAC transgenesis in conjunction with the Gal4/UAS system allows for the answer of many biological questions and applications such has live imaging of cells and subcellular structures in complex tissues and organs such as the nervous system, targeted cell ablation and manipulation of neural circuits, analysis of gene function by targeted gene expression, remote control of neuronal activity by light, targeted inhibition of neuronal function by tetanus toxin light chain.(Asakawa & Kawakami, 2008; K. Kawakami, Asakawa, Muto, et al., 2016)
1.6 Anatomical characterization of the zebrafish brain and its circuits: Atlases
Developments in imaging technology and genetically encoded indicators that can reliably report neuronal firing and synaptic activity have created new possibilities for neural circuit research. To truly understand zebrafish behavior, we must first understand the connectivity of the neuronal circuits driving behavior. A first step will be to produce single-cell resolution, whole-brain maps of the functional signals underlying sensory and motor processing, but maps are of limited utility unless they intersect with detailed neuroanatomical information. (Randlett et al., 2015; Renninger & Orger, 2013; Turner, Bracewell, & Hawkins, 2014)
Zebrafish are a relatively new model system; as such, the zebrafish doesn’t benefit from the extensive neuroanatomical descriptions that exist in other model species. This requires detailed neuroanatomical characterization of the zebrafish brain especially in very early developmental stages. (Turner et al., 2014)
This longstanding problem in zebrafish neuroscience has recently been addressed by the construction of digital atlases using confocal imaging of larvae with specific molecular markers, followed by three-dimensional image registration techniques: the Virtual Brain Explorer for Zebrafish (ViBE-Z), Z-Brain and the Zebrafish Brain Browser (ZBB). (Marquart et al., 2015; Randlett et al., 2015; Ronneberger et al., 2012) In these atlases, information of widely available transgenic lines are consolidated within a common framework. These atlases allow researchers to register their own datasets and take advantage of the information contained within. (Marquart et al., 2017)
11 High-resolution functional maps will eventually be registered with these anatomical maps, providing the identification of genetically targetable cell types involved in specific behaviors and allowing zebrafish researchers to guide studies of neural circuit structure and function, it allows for direct comparisons across experiments, and can reveal brain-wide functional connectivity patterns. As more labels and activity maps are accumulated, such analyses will become even more powerful and in cases where the position of neurons is highly stereotyped, the resolution can be near-cellular. (Marquart et al., 2017; Randlett et al., 2015; Renninger & Orger, 2013)
The atlases available:
The Z-brain atlas is focused on zebrafish at 6 dpf, since the often studied age range is of 5–7 dpf. The Z-Brain atlas contains information on gene expression, neural activity and neuroanatomical segmentation. The confocal stacks of the brain were registered to a template brain on the basis of expression of total ERK (tERK). (Randlett et al., 2015)
Z-Brain is an expandable, open source platform allowing the zebrafish community to rapidly expand the atlas by contributing with additional anatomical or functional stacks. (Randlett et al., 2015)
ZBB is a database of the expression patterns of 109 transgenic lines that have been registered into a common reference. The “brain browser” software facilitates the visualization of multiple lines and search using anatomic labels, or user defined 3-dimensional regions of interest (Marquart et al., 2015). The browser can be used to find enhancer trap lines that label specific neurons, or projection targets of neurons of interest.
In contrast to Z-brain, the Zebrafish Brain Browser (ZBB) atlas was constructed from live scans of fluorescent reporter genes in transgenic larvae limiting the range of available markers but avoids artifacts associated with fixation and staining and increases throughput. (Marquart et al., 2017)
Images from ZBB have been incorporated in ZBB and vice versa and it is, therefore possible to visualize the overlap of lines characterized for each project.
ANTs was used to register Z-Brain and ZBB to be co-aligned with acceptable precision and minimal perturbation of cell and tissue morphology since the two atlases are both based on confocal scans of 6 dpf larvae and share several transgenic markers. (Marquart et al., 2017)
ANTs provided superior image registration for live-scanned larvae, which allowed an improvement in precision of the registration and neuron morphology within the original ZBB atlas, this lead to the creation of ZBB1.2 which is now the atlas used. (Marquart et al., 2017)
ViBE-Z’s high-quality data sets through fusion of multiple confocal stacks, it aligns 3D gene or protein expression patterns of different zebrafish larvae to a common reference based on a nuclear staining, and it stores the aligned patterns atlas of 2-, 3- and 4-day old zebrafish larval brains in the ViBE-Z database. It stands out since it is made with confocal stacks from the dorsal and ventral views of the brain and fused them with attenuation correction, resolving detailed structures deep inside brain using standard confocal microscope data. (Ronneberger et al., 2012)
12
Table 1.1: Summary of the atlases available and their main characteristics: Registration tool, stage of the fish registered and the main anatomical marker used.
Atlas Days post
fertilization Registration Tool Main Reference Marker Reference
ZBB 6 CMTK vglut2a:DsRed (Marquart et al.,
2015)
ZBrain 6 CMTK tERK (Randlett et al.,
2015)
ViBE-Z 2,3,4 Landmark
detector
Nuclear Staining (Ronneberger et al., 2012) ZBB1.2 6 ANTs Common markers between ZBB and Zbrain (Marquart et al., 2017)
1.7 Characterization of specific neuronal subpopulations in zebrafish brain development:
the use of transgenic lines
The identification and characterization of neuronal populations and their involvement in specific circuits, such as those involved in visual processing, remains crucial to expand our knowledge on how the zebrafish brain is functionally organized.
One approach in the identification of distinct neuronal populations is the use of transgenic reporter fish lines designed to express fluorescent proteins in specific neuronal populations. These fish lines may contain reporter genes (such as GFP) directly under the control of the regulatory sequences of interesting genes or may drive the expression of Gal4 derivatives (such as GFF) that in combination with the appropriate UAS-reporter lines will drive reporter expression.
Several large-scale projects have allowed the generation of hundreds of transgenic lines which have already been imaged at the cellular level by whole brain imaging.
They involve the registration of individual 3D brain images into a reference brain. As a result, atlases have been created offering an open source database of gene expression of hundreds of transgenic lines and different antibodies together with anatomical labels, all registered into a common reference space however a similar characterization of zebrafish younger stages (1-5dpf) is still needed. Some data for the earlier developmental stages is available but this has not been further developed. (Mueller & Wullimann, n.d.; Ronneberger et al., 2012)
For the current project, we are collaborating with M. Orger laboratory in the characterization of the expression of several zebrafish lines recently generated, during embryonic and early larval development. These lines, in combination with the UAS-GCaMP6, are currently being examined in Michael Orger’s
13 laboratory to determine the neuronal response of the GFF expressing neuronal subpopulations upon exposure of the fish to specific stimuli. Several interesting populations in the brain have been identified which respond to stimulus moving in specific directions (direction selective) and to abrupt changes in light intensity [S. Renninger and M. Orger, unpublished].The lines studied in this work are:
The olig2: GFP line: Olig2 (Oligodendrocyte transcription factor 2) genes encode for basic helix–loop– helix (bHLH) transcription factors and are important for motor neuron and oligodendrocyte development. (McFarland, Topczewska, Weidinger, Dorsky, & Appel, 2008; Park, Mehta, Richardson, & Appel, 2002)
The Olig2: eGFP line contains a BAC insertion that includes the Olig2 genomic region where the eGFP has been inserted. (Shin, 2003)
The chrna4:GFF line: chrna4(cholinergic receptor nicotinic alpha 4 subunit) is a subunit of the nicotinic acetylcholine receptor (nAChR), this line was created in Michael Orger’s lab where the GFF variant of Gal4 was inserted into a bacterial artificial chromosome (BAC) containing the zebrafish genomic region including the regulatory region of the chrna4 gene. The GFF gene was specifically targeted to the starting ATG of the gene and may thus respond to the regulatory regions in a similar way as the gene of interest. The BAC was then integrated into the genome using the Tol2 transposon system. [S. Renninger and M. Orger, unpublished]
The pcp4: GFF line: pcp4a (Purkinje cell peptide 4) is a small polypeptide carrying an IQ motif: a 23-amino acid domain that binds EF-hand proteins and shows high affinity for calcium-poor calmodulin. (Mione, Lele, Kwong, Concha, & Clarke, 2006) This line was created in a very similar manner to the chrna4 using a BAC and the tol2 transposon system. [S. Renninger and M. Orger, unpublished] The Chat: GFF line: This transgenic line genome harbors an insertion of a BAC containing the choline acetyl transferase genomic region with GFF cloned at the ChAT starting ATG. GFP expression was previously observed and characterized in M. Orger’s lab. (Miguel & Madeira, 2017)
The characterization of GFP should provide useful information to understand acquisition of neuronal cell fates and the wiring mechanism during development. In addition, it will help in the design and interpretation of experiments where they can be used to manipulate gene expression in a cell specific manner at specific times in development.
We aim to characterize neuronal subpopulations expressed in lines involved in visual processing by the use of reporter lines that drive GFP expression and therefore contribute to a better understanding of the acquisition of neuronal cell fates and establishment of neuronal circuits. For that matter we will examine GFP expression in zebrafish embryos and larvae from 3 transgenic lines from the 1st to the 6th dpf, using immunofluorescence and confocal imaging. Label and identify the anatomical localization of GFP expressing cell populations by comparison with 3-D atlases and other studies on protein and gene expression. In addition, we are using time lapse imaging with Lightsheet microscopy to follow the dynamics of neuronal differentiation and extension of projections during the 20-48 hours post fertilization period of the Chat: GFF line.
14
2. Materials and Methods
2.1 Fish Husbandry
The zebrafish used were maintained by the vivarium platform at Champalimaud Research, where all aspects of fish housing were provided.
The rooms that accommodate the fish are ventilated through a centralized HVAC system and are kept at a controlled room temperature (25°C), with a 50%–60% humidity level and under a 14/10 hours light/dark cycle with a light intensity of 200– 300lux at the water surface.
Temperature, pH, salinity (conductivity), and dissolved gases, are continuously monitored online and checked daily to be kept under the physiological range. (Martins et al., 2016)
2.2 Fish crosses and embryo collection
Static mattings are currently done using tilted/slanted insert breeding tanks providing a shallow water environment that maximizes breeding behavior. (Martins et al., 2016)
Fish are placed in breeding tanks described above and on the next day embryos are collected and kept on E3+PTU (see Solutions), to prevent the development of pigmentation (Karlsson, von Hofsten, & Olsson, 2001), at a maximum density of 50 embryos/petri dish. After being collected in petri dishes embryos/larvae were raised at 28.5°C under a 14/10 hours light/dark cycle.
All animal experiments were done according to the CF Animal Welfare Body guidelines and under a CF Ethics Committee-approved project.
2.3 Transgenic Lines
The cell-specific lines pcp4a(pcp4a:GFF UAS:Lyn-mCherry; Renninger and Orger, unpublished work), chrna4 (chrna4:GFF UAS:Lyn-mCherry; Renninger and Orger, unpublished work), and ChAT (ChAT:GFF;UASmCherry; Renninger and Orger, unpublished work) were created in the Orger lab using the tol2 system(Asakawa & Kawakami, 2008). To generate the lines, the GFF variant of Gal4 was inserted into a bacterial artificial chromosome (BAC) containing the zebrafish genomic region including the respective gene of interest (pcp4a, chrna4, ChAT). The GFF gene was specifically targeted to the starting ATG of the gene and may thus respond to the regulatory regions in a similar way as the gene of interest. The BAC was then integrated into the genome using the Tol2 transposon system. The Olig2:eGFP line contains a BAC insertion that includes the Olig2 genomic region where the eGFP has been inserted as described (Shin, 2003). This Olig2: eGFP line corresponds to allele vu12 and was obtained from the European Zebrafish Resource Centre.
2.4 Whole body fluorescent immunostaining
The protocols used are modifications of those described in (Inoue & Wittbrodt, 2011; Marquart et al., 2017; Randlett et al., 2015) Zebrafish larvae are fixed in PFA 4%, triton 0,25% for at least 2 hours at room temperature or at 4°C overnight, they are rinsed 3x and washed 3x for 5min in PBT(see section
15 2.9), incubated in 150 mM Tris-HCl, pH 9, for 15 min at 70 °C (Inoue & Wittbrodt, 2011), rinsed 3x and washed 3x for 5min in PBT, permeabilized in 0.05% Trypsin-EDTA for 5 min on ice, washed in PBT, blocking occurs in a mix of PBT ,1% bovine serum albumin (BSA), 2% normal goat serum (NGS),1% dimethyl sulfoxide (DMSO), and then incubated for 3 overnights at 4 °C in a primary antibody mix containing PBT, 1% BSA, 1% DMSO and the primary antibodies at a 1:500 dilution after which the samples are rinsed 3x and washed 3x for 30min in PBT, incubation with secondary antibodies happens in similar conditions has the primary antibodies. For some samples besides the antibodies used, bisbenzimide at a 1:500 dilution was added with the primary antibodies, and the rest of the protocol proceeded normally.
2.5 Mounting protocols
For confocal imaging, the larvae are mounted directly to the cover slip with the dorsal side against the coverslip has straight has possible in a drop of 1,5%(w/v) low melting agarose in PBS, the larvae are then surrounded by a silicone grease well which is filled with PBS, the glass slide is then pressed against the coverslip which provides a watertight seal.(Turner et al., 2014).
For Lightsheet imaging, embryos with approximately 24hpf are placed in Bodipy-TR-methyl ester, a lipophilic dye that binds to inner membranes in the cells, for 1h the embryos were incubated in a 1:50 dilution. Embryos are then embedded in an agarose rod that can be rotated (Huisken, Swoger, Del Bene, Wittbrodt, & Stelzer, 2004). For embedding in 1.5% (w/v) agarose in E3, embryos were placed in liquid agarose, drawn into a glass capillary with Teflon-coated plungers and extruded after polymerization.
2.6 Confocal Microscopy
Images were acquired with the Zeiss LSM 710 which is an upright confocal laser-scanning microscope that allows for optical sectioning of thick fluorescent samples at high-resolution. The Objective used is a long distance (LD) LCI Plan-Apochromat 25x/0.8 multi immersion which is a highly performing lens for deep tissue imaging. Anatomical z-stacks were obtained at a voxel size of 0.55 × 0.55 × 1 μm (x × y × z). To cover the entire brain, we acquired two imaging tiles and stitched them together using the Pairwise Stitching plugin in FIJI (Preibisch, Saalfeld, & Tomancak, 2009). As imaging was done with the fish dorsal side up, image quality may be lower in the most ventral areas of the brain.
2.7 Characterization of the Lines
Anatomical characterization of GFP expression of the different lines was made by comparing the z-stacks obtained with reference brains and z-stacks from bibliography concerning the respective lines and the z-brain (Randlett et al., 2015) and ZBB1.2 atlases (Marquart et al., 2017). For the retina characterization we used a specific paper. (Avanesov & Malicki, 2010)
16
2.8 Light sheet Microscopy
The Zeiss Lightsheet Z.1 is a Lightsheet fluorescence microscope able to image optical sections of large samples at sub-cellular resolution and very fast rates, with very little excitation power.
The Z.1Lightsheet possesses highly sensitive sCMOS camera (dual PCO.Edge cameras with up to 30 fps speed).
The chamber is filled with E3 +PTU (0,2 mM) + tricain to avoid pigmentation and anesthetize the embryo. The objective used was a Plan-Apochromat 10x/0.5 M27 75mm parfocal length 75mm, (FWD=3.7mm), (UV) VIS-IR the illumination lenses were 10x/0.2 Dry lenses.
2.9 Solutions
E3 (60x): 5mM NaCl, 0.17mM KCl, 0.33mM CaCl2, 0.33mM MgS04, pH=7.2. PBT- PBS 1x + Triton 0.25%
Bisbenzimide stock concentration: 10mg/ml
2.10 Antibodies and other counterstain reagents
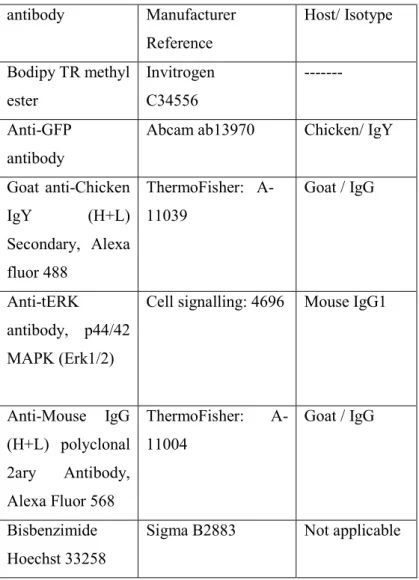
Table 2.1: Table of the antibodies and stains used for all protocols.
antibody Manufacturer Reference Host/ Isotype Bodipy TR methyl ester Invitrogen C34556 --- Anti-GFP antibody
Abcam ab13970 Chicken/ IgY
Goat anti-Chicken IgY (H+L) Secondary, Alexa fluor 488 ThermoFisher: A- 11039 Goat / IgG Anti-tERK antibody, p44/42 MAPK (Erk1/2)
Cell signalling: 4696 Mouse IgG1
Anti-Mouse IgG (H+L) polyclonal 2ary Antibody, Alexa Fluor 568 ThermoFisher: A-11004 Goat / IgG Bisbenzimide Hoechst 33258
17
3. Results
The Zebrafish (Danio Rerio) larva is an ideal model for identification of neuronal circuits such as those associated with visually guided behaviors like the optomotor and the optokinetic responses.
To characterize some of these subpopulations we are taking advantage of the expression of GFP, using the Gal4-UAS system, during the first 6 days of development.
The lines used are expressing GFF (Gal4 variant) and are currently being studied in the Vision to Action laboratory to identify neurons that are specifically active when the larvae are exposed to visual stimuli and/or performing motor behaviors. When ultimately combined with a UAS: GFP reporter line it is possible to characterize the GFP expression of the GFF lines.
In order to obtain the embryos of interest, we crossed adult zebrafish after selection of GFP expressing embryos, a group of embryos is fixed every 24 hours to obtain the stages presented in this work, after which we apply the Immunofluorescence protocol described in the methods section.
We then proceed to acquire z-stacks of the whole brain with confocal microscopy. Processing of the images was done using ImageJ.
In the following sections we present our observations of the confocal z-stacks corresponding to the different lines examined. We present for each line a description of the different clusters of cells, in the successive stages of development highlighting similarities and differences with the previous stage. This is summarized in a table and illustrated in the figures corresponding to the partial maximum intensity projections. At the end of the chapter for each line, an overall description of the GFP expression during development is presented.
Annotation was made based on existing literature, mainly based on Zbrain (Randlett et al., 2015) and ZBB (Marquart et al., 2015) for the later larval stages and (Mueller & Wullimann, n.d.) for the younger stages, the retina characterization was made using a specific paper (Avanesov & Malicki, 2010). We have tried to identify as many neuronal clusters and projections as possible and in the most specific way possible but their assignment is still temptative at this stage.
3.1 Olig2: eGFP - GFP expression
The Olig2: eGFP line contains a BAC insertion that includes the Olig2 genomic region where the eGFP has been inserted, this gene is expressed typically by motor neurons, oligodendrocytes and oligodendrocyte progenitor cells (OPCs). (Shin, 2003)
For the characterization of this line the olig2: eGFP line was incrossed, since eGFP is directly expressed under the regulatory region of the olig2 gene, almost all embryos presented GFP being then used for characterization, this line expressed a very consistent pattern across embryos.
18 3.1.1 Olig2: eGFP 1dpf
In the first day of development GFP expression is observed in a few cells on the olfactory epithelium (Fig 3.1, A1). Expression of GFP in the Diencephalon is very general, with labelled cells spanning a broad region that may correspond to proliferating neuroepithelial cells. Some GFP expressing cells are also present in the hindbrain located in the mantle layer and thus most likely corresponding to early differentiating neurons (Fig 3.1, A1).
3.1.2 Olig2: eGFP 2dpf
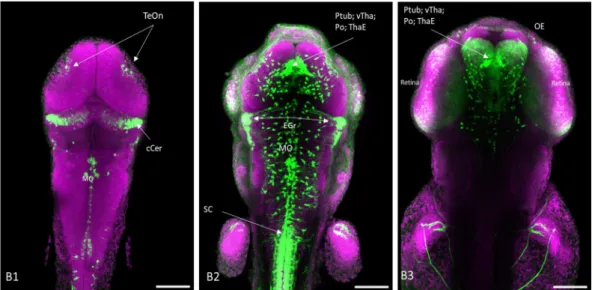
As the fish develops onto the second day post fertilization, the number of GFP expressing cells increases dramatically and we can start to distinguish within the Diencephalon the thalamus, ventral thalamus, thalamic eminence, posterior tuberculum and probably the preoptic area in a more ventral position (Fig 3.2, B2).
GFP+ cells can be identified in the optic tectum, in the corpus cerebellum and in the medulla oblongata (Fig 3.2, B2). A compact cluster of GFP+ cells is present at the eminentia granularis with projections to the midline of the embryo (Fig 3.2, B2).
Numerous scattered cells with a morphology of oligodendrocyte precursors can be observed throughout the midbrain and hindbrain. (Sidik & Talbot, 2015)
A band of GFP+ cells in the midline of the larva appears as a characteristic of this line, not to be confused with the expression of the spinal cord at the most caudal part of the embryo (Fig 3.2, B2).
Projections innervating the pectoral fin buds can be observed.
In the retina, cell in several layers are populated with GFP expressing cells (Fig 3.2, B3).
Figure 3.1: GFP expression in a 1dpf olig2: GFP zebrafish brain: A maximum intensity projections of a, 1dpf olig2: GFP, confocal z-stack is presented in panel A1. Immunofluorescence was performed with anti-GFP (green) and bisbenzimide (magenta).Annotations have been made using abbreviations of the brain areas expressing GFP. Abbreviations: Di- Diencephalon; OE- Olfactory epithelium; Scale bar has a size of 100 microns.
19 3.1.3 Olig2: eGFP 3dpf
Within the telencephalon there are sparse cells in the pallium and a cluster on the subpallium (Fig 3.3, C3, and C4).
GFP+ cells are present at this stage in the habenula, accompanied by an increase of cell bodies and dendrites in the optic tectum (Fig 3.3, C1, and C2).
A band of GFP expressing cells starts to appear at a location spanning several brain areas (the Posterior tuberculum, ventral thalamus and thalamic eminance) (Fig 3.3, C3).
In the cerebellum, the Olig2 specific clusters of cells accompany the growth of the cerebellum Fig 3.3, C2).
In the retina there are cells in the Inner Nuclear Layer and possibly expression in the Inner and outer Plexiform Layer and the Pigmented Epithelium (Fig 3.3, C4).
Figure 3.2: GFP expression in a 2dpf olig2: GFP zebrafish brain: From B1-B3 Partial maximum intensity projections of a, 2dpf olig2: GFP, confocal z-stack are presented, panels go from dorsal to ventral starting on panel B1. Immunofluorescence was performed with anti-GFP (green) and bisbenzimide (magenta).Annotations have been made using abbreviations of the brain areas expressing GFP. Abbreviations: cCer - corpus cerebelli; EGr - Eminentia Granularis; MO- Medulla oblongata; OE – Olfactory epithelium; Po - Preopctic area; Pr – Pretectum; PTub - Posterior tuberculum; SC – Spinal Cord; TeOn- TeO neuropil; ThaE - Thalamic eminance; vTha - Ventral thalamus; Scale bar has a size of 100 microns.
20
Figure 3.3: GFP expression in a 3dpf olig2: GFP zebrafish brain: From C1-C4 Partial maximum intensity projections of a, 3dpf olig2: GFP, confocal z-stack are presented, panels go from dorsal to ventral starting on panel C1. Immunofluorescence was performed with anti-GFP (green) and bisbenzimide (magenta).Annotations have been made using abbreviations of the brain areas expressing GFP. Abbreviations: cCer - corpus cerebelli; EGr - Eminentia Granularis; EP – pigmented epithelium; Ha – Habenula; inl- Inner nuclear layer; ipl – Inner plexiform layer; MO- Medulla oblongata; OE – Olfactory epithelium; Pa – Pallium; Po - Preopctic area; Pr – Pretectum; PTub - Posterior tuberculum; SC – Spinal Cord; SubPa - Sub-pallium; TeOn - TeO neuropil; ThaE - Thalamic eminance; vCer - Valvula cerebelli; vTha - Ventral thalamus; Scale bar has a size of 100 microns.
3.1.4 Olig2: eGFP at 4dpf, 5dpf and 6dpf
The expression patterns starting at 4 days post fertilization are very similar between each other and will be grouped together (Fig 3.4).
Expression in the habenula is maintained and in the MO expression is still abundant and disperse. (Fig 3.4, D2, E2, F2) The biggest differences from the third day stage are the increase in GFP expression on the whole brain specially in the amount of neuropil in the pallium and tectum neuropil (Fig 3.4, D2, F1,F2,F3), and the appearance of structures such has the neuropil region 2 on the vagal region (Fig 3.4, D2, E2).
The retina also seems to have more expression in all the layers described before (Fig 3.4, D3-F3, and D4-F4).
21
Figure 3.4 GFP expression in a 4dpf, 5dpf and 6dpf olig2: GFP zebrafish brains: From D1-D4 Partial maximum intensity projections of a, 4dpf olig2: GFP brain, confocal z-stack are presented, From E1-E4 Partial maximum intensity projections of a, 5dpf olig2: GFP brain, From F1-F4 Partial maximum intensity projections of a, 6dpf olig2: GFP brain. Panels go from dorsal to ventral from left to right. Immunofluorescence was performed with anti-GFP (green) and anti-tERK (magenta).Annotations have been made using abbreviations of the brain areas expressing GFP. Abbreviations: cCer - corpus cerebelli; EGr - Eminentia Granularis; Ha – Habenula; MO-Medulla oblongata; NpR 2 - Neuropil Region 2; OE – Olfactory epithelium; Pa – Pallium; Po - Preopctic area; Pr – Pretectum; PTub - Posterior tuberculum; SubPa - Sub-pallium; TeOn - TeO neuropil; ThaE - Thalamic eminance; vCer - Valvula cerebelli; vTha - Ventral thalamus; Scale bar has a size of 100 microns.
22 3.1.5 Olig2: eGFP Expression summary
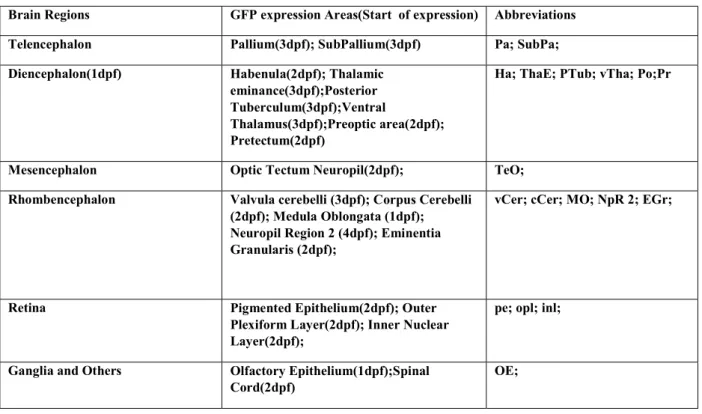
Table 3.1: Olig2: eGFP expression summary table: summary of all the areas where GFP is expressed in the 6 dpf larval brain from Olig2-GFP transgenic fish with indication of the stage when cells in the regions are first observed
Brain Regions GFP expression Areas(Start of expression) Abbreviations Telencephalon Pallium(3dpf); SubPallium(3dpf) Pa; SubPa; Diencephalon(1dpf) Habenula(2dpf); Thalamic
eminance(3dpf);Posterior Tuberculum(3dpf);Ventral
Thalamus(3dpf);Preoptic area(2dpf); Pretectum(2dpf)
Ha; ThaE; PTub; vTha; Po;Pr
Mesencephalon Optic Tectum Neuropil(2dpf); TeO; Rhombencephalon Valvula cerebelli (3dpf); Corpus Cerebelli
(2dpf); Medula Oblongata (1dpf); Neuropil Region 2 (4dpf); Eminentia Granularis (2dpf);
vCer; cCer; MO; NpR 2; EGr;
Retina Pigmented Epithelium(2dpf); Outer Plexiform Layer(2dpf); Inner Nuclear Layer(2dpf);
pe; opl; inl;
Ganglia and Others Olfactory Epithelium(1dpf);Spinal Cord(2dpf)
OE;
In this line, GFP+ cells can be found scattered throughout the brain from the 2 dpf, this most likely correspond to the oligodendrocyte progenitor cells as previously described (Shidik and Talbot, 2015). More spatially restricted expression is described below.
3.1.5.1 Olig2: eGFP expression in the telencephalon.
In the subpallium there is a cluster of cells which is more evident from 3dpf. There is no apparent expression in the olfactory bulb nor the pallium apart from the oligodendrocyte progenitor cells scattered throughout the brain.
3.1.5.2 Olig2: eGFP expression in the diencephalon.
A GFP expression domain in the habenula is observed from the 2 dpf stage which is enlarged as the larva brain grows. GFP is strongly expressed in a region that may include, the ventral thalamus, the posterior tuberculum, the thalamic eminence and the preoptic area more ventrally; from the 2 dpf stage, another distinctive “V” shape cluster in the pretectal area that may be extending to the mesencephalon, is observed from the 3dpf stage.
23 3.1.5.3 Olig2: eGFP expression in the mesencephalon.
GFP+ cells can be detected in the tectum neuropil and sparsely in the stratum periventriculare since the 2dpf stage. Some cells are found in a region corresponding to the pretectum as described in the diencephalon section above.
3.1.5.4 Olig2: eGFP expression in the rhombencephalon
Within the cerebellum, we find GFP+ cells in the Valvula cerebelli and also the corpus cerebelli more ventrally from the 2 dpf and a very distinctive cluster is present in the eminentia granularis on both sides of the larval brain with neurons projecting ventrally towards the midline.
Expression of GFP can only be detected starting in the 2dpf, at low levels in the medulla oblongata being more concentrated in a stripe along the ventral midline and in neuropil region 2.
3.1.5.5 Olig2: eGFP expression in the retina, ganglia and spinal cord.
From 1 dpf onwards, GFP is expressed in the olfactory epithelium. In the developing retina expression occurs in the Inner Nuclear Layer and possibly in the Inner, outer Plexiform Layer and the Pigmented Epithelium by 4 dpf.
A ventral domain in the spinal cord, corresponding to the motor neuron precursors is identified in the spinal cord.
3.2 Chrna4: GFF UAS: GFP - GFP expression
This specific line was created by inserting the GFF variant of Gal4 into a bacterial artificial chromosome (BAC) containing the regulatory region of the chrna4 gene. The BAC was then integrated into the genome using the Tol2 transposon system. [S. Renninger and M. Orger, unpublished].
For the characterization of this line the GFF driver line chrna4: GFF lyn-mCherry was crossed with the UAS: GFP reporter line, and the GFP expressing embryos (chrna4: GFF UAS: GFP) were selected for characterization, this line expressed a very consistent pattern across individuals.
24 3.2.1 Chrna4: GFF UAS: GFP 1dpf
For the first day of this line there is no expression on the CNS, the GFP seen is a structure central to the neural tube which persists in all the stages analyzed for this line and may correspond to neural crest cells in the pharyngeal arches (Fig 3.5, A1).
3.2.2 Chrna4: GFF UAS: GFP 2dpf
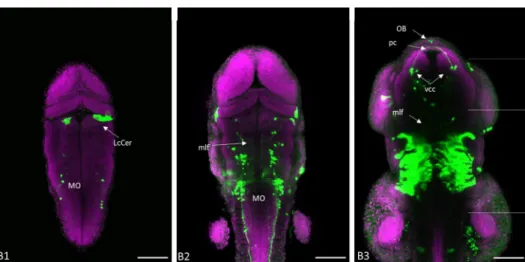
The first GFP+ domain in the CNS is at the lobus caudallis cerebellis (Fig 3.6, B1)
Ventrally the medulla oblongata presents two symmetrical unidentified clusters with contralateral projections between them GFP expression can also be observed in the early caudal hypothalamus cluster (Fig 3.6, B2). In the diencephalon, a structure of the primary scaffold begins to express GFP at this stage, it is composed of the ventral caudal cluster with the posterior commissure emerging from it and the mlf projecting from the vcc caudally (Fig 3.6, B3).
Figure 3.5: GFP expression in a 1dpf chrna4: GFF UAS: GFP zebrafish brain: A maximum intensity projections of a, 1dpf chrna4: GFF UAS: GFP, confocal z-stack is presented in panel A1. Immunofluorescence was performed with anti-GFP (green) and bisbenzimide (magenta).Annotations have been near the GFP expressing structures. Scale bar has a size of 100 microns.
Figure 3.6: GFP expression in a 2dpf chrna4: GFF UAS: GFP zebrafish brain: From B1-B3 Partial maximum intensity projections of a, 2dpf chrna4: GFF UAS: GFP, confocal z-stack are presented, panels go from dorsal to ventral starting on panel B1. Immunofluorescence was performed with anti-GFP (green) and bisbenzimide (magenta).Annotations have been made using abbreviations of the brain areas expressing GFP. Abbreviations: LcCer - Lobus caudallis cerebelli; mlf – Medial longitudinal fasciculus; MO- Medulla oblongata; OB – Olfactory bulb; pc – Posterior commissure; vcc – Ventral caudal cluster; Scale bar has a size of 100 microns.