The role of top tier advisors: Some Unpuzzling Evidence
Marta Francisco 152412041
Abstract
Academics and practitioners around the world are daily involved in the discussion of the role of financial advisors. There is puzzling evidence regarding the role of top tier advisors in the capture of abnormal returns in domestic US acquisitions. Our work is an important step forward in solving the puzzle. We find evidence that (1) hiring a top tier investment bank is relevant on public cross border transactions (2) and that the tier of the advisor has little relevance when the acquirer is an experienced investor. This is a strong indication that top tier advisors do matter when their advice is most needed.
Professor José Faias Supervisor
“It is far better to buy a wonderful company at a fair price than a fair company at a wonderful price.”
Warren Buffett
Dissertation submitted in partial fulfillment of requirements for the degree of Master of Science in Finance, at Universidade Católica Portuguesa, March 2014
i
Acknowledgements
During my five years at Católica Lisbon I have been inspired, supported and encouraged by many people. Without them, I could not have completed this dissertation. I wish to thank all those who helped me.
First, I would like to thank my supervisor Professor José Faias for his continuous interest, unconditional support and guidance. Thank you for the many fruitful meetings and presentations which allowed me to overcome all the impasses and difficulties. Further I convey my thanks to Professor Pedro Raposo for his helpful comments and insightful suggestions. I would like to thank Professor Golubov, whose work inspired me to research on this topic.
Further thanks to Católica Lisbon for these five amazing years and for the knowledge and values it shared with me during my Undergraduate and Master degrees. I would also like to thank the “Fundação para a Ciência e a Tecnologia”.
I would like to thank to Maria João Marcelino and Tiago Dias for their help. I would also like to thank Diogo Santos for his modelling skills that helped me so much in my thesis. A special thanks also to Diogo and Eduardo Catroga for the “macrositting” during countless hours. A thank you also to my Empirical Finance group, especially to João Pereira de Almeida and Manuel Lorenz, for teaching me so much during the course.
I would like to thank my dearest friends from the Teaching Assistants’ room, especially to Carolina Perry, for the constant support and friendly words.
Finally, my warmest thanks goes to my family. A special thank you to Nuno for all his love and support, and for always inspiring me to do my best. I would also like to thank my parents and sisters for all the unconditional love. A special thank you to my nephews for always making me smile.
ii Table of Contents 1 Introduction ... 3 2 Methodology ... 7 3 Data ... 9 4 Results ... 16 5 Robustness Tests ... 23 6 Conclusion ... 27 References ... 28
3
1 Introduction
In 2012, the volume of mergers and acquisitions (M&As) accounted for 3.5% of the world GDP (20% of the United States GDP).1 Mergers and acquisitions are a source of value derived from synergies, economies of scale, and increased market power [Liu and Qiu (2013)]. However, they also have costs associated. In 2012, firms spent US$ 24.7 billions in advisory fees to financial advisor according to Thomson Reuters estimates. Financial advisors are hired to perform the valuation, negotiation and execution of the deal.
The role of financial advisors is one of the most discussed topics in M&As not only by academics [Servaes and Zenner (1996), Ismail (2010), Golubov et al. (2012)] but also by practitioners. For example, Bloomberg and Thomson Reuters gather the information concerning the deals in a specific period and they release tables with the position of each investment bank in terms of deal value and volume of transactions (League Tables). Each period investment banks await to know their positions on the League Tables. But why are these League Tables so important? Do top tier investment banks deliver higher returns to their clients?
This paper analyzes the role of top tier investment banks by comparing acquisitions in which the financial advisor of the acquirer is a top tier investment bank (one of the banks with higher deal value) versus a non-top tier investment bank. Our work provides additional insightful view to the literature on the role of financial advisors by (1) showing the relevance of top tier advisors in domestic and cross border acquisitions, and; (2) considering the role of experienced acquirers, such as institutional investors.
Previous literature only focuses on the role of top tier investment banks in domestic acquisitions, in which both acquirers and targets are US firms. While some previous papers show that there is no relationship between the use of top tier investment banks and the abnormal returns of the
4 acquirer [Servaes and Zenner (1996)] others show that the relationship is negative [Ismail (2010)] and there is also evidence that the relationship is positive [Golubov et al. (2012)]. Servaes and Zenner (1996) shows that the returns earned by the acquirer do not depend on the choice or use of an investment bank as advisor, however they only consider the largest acquisitions from 1981 to 1992. This sample excludes the wave of cross border acquisitions from 1992 to 2000 [Rhodes-Kropf and Viswanathan (2004)]. Rau (2000) shows that US acquirers advised by top tier investment banks earn significantly lower abnormal returns but their analysis is based on a small sample of acquisitions (less than 600) from 1980 to 1991. Ismail (2010) presents the same conclusions as Rau (2000) but with a significantly larger sample from 1985 to 2004. These papers are mainly focused in the 1990s, period characterized by excessive premiums, large acquirer losses and large deal values [Moeller et al. (2005)]. Neither of the previous papers controls for the endogeneity problem that might exist in the choice of the advisor [Golubov et al. (2012)]. The abnormal returns might not be higher because the advisor is a top tier investment bank but because the top tier investment banks choose the deals where the returns are expected to be higher. Golubov et al. (2012) controls for this sample bias and shows that in acquisitions in which both the acquirer and the target are US public firms, top tier advisors deliver higher cumulative abnormal returns that their non-top tier counterparts. Golubov et. al (2012) provides the intuition that the tier is only significant in public acquisitions because these are more complex transactions where the expertise, know-how and reputation of the bank are more relevant.
Our first hypothesis is that if the tier of the investment bank is only relevant in more complex domestic deals then it should also be significant in cross border acquisitions as they bring added complexity. If this result is confirmed we are one step closer to solving the puzzling evidence on the role of top tier financial advisors. Cross border acquisitions are more complex transactions due to different regulatory environments, exchange rate risks, and different type of synergies (more likely revenue and financial synergies and not cost synergies).
5 Previous literature focuses mainly on the role of advisors in domestic deals and not in cross border acquisitions. This is a topic of relevance as the number of deals where the acquirer is a US firm and the target is a non-US firm has been increasing across time. The deals in which the target is a non-US firm increased from less than 9% in 1990 to 21% of the deals where the acquirer is a US firm, from Thomson One Banker. This result is not only caused by the decrease of domestic deals but also by the increase of cross border acquisitions. With the capital and product markets integration, globalization has become a strategic decision for firms. This increase in the market for corporate control and assets, together with the gains associated with geographical expansion explains the increase in the number of cross border acquisitions [Moeller and Schlingemann (2005)]. However, the literature on the role of investment banks in cross border acquisitions has not kept pace with this trend.
We investigate if the acquirer cumulative abnormal returns of US firms are explained by the tier of the investment bank used as financial advisor in domestic and cross border deals. We show that the tier of the investment bank is significant in both domestic and cross border deals if the target is a public firm. This can be explained by the fact that the expertise and reputation of the bank are more relevant in more complex deals. Public acquisitions are more complex deals where the impact of the acquisition is not only reflected in the stock price of the acquirer but also of the target. The higher complexity of these deals is also explained by the higher bargaining power of listed firms and regulation of public acquisitions [Fuller et al. (2002)].
If top tier advisors only have an impact on the cumulative abnormal returns in more complex deals where their reputation and expertise are more relevant what happens when the acquirer is an experienced investor? Our second hypothesis is that in deals where the acquirer is an experienced investor the tier should not be significant as the acquirer already has the experience and know-how. We test if the tier is also significant in acquisitions where the acquirer is an institutional investor. Institutional investors are an increasingly important player in financial markets.
6 According to OECD, in 2012, institutions as pension funds, insurance companies and mutual funds held more than US$ 70 trillion euros in assets. The assets under management have more than tripled since the beginning of 1990 [International Monetary Fund (2005)]. IMF (2005) reports that the investment decisions of institutional investors increasingly “make markets”. But is this ability to “make markets” also reflected in the ability to “make acquisitions”? We add a new extension to the literature on the role of institutional investors and we test the relevance of the choice of investment bank when the acquirer is an institutional investor. We show that the choice of a top tier investment banks has no impact on returns when the acquirer is an institutional investor. This can be explained by the fact that the investment expertise and know-how of an institutional investor makes the added value of a top tier investment bank not significant.
This paper makes important contributions to the M&As and to the advisory reputation literature. There is puzzling evidence regarding the role of top tier advisors in the capture of abnormal returns in domestic US acquisitions. Our work is an important step forward in solving this puzzle. Firstly, we show that the tier of the investment bank has a positive impact on the returns of the acquirer around the announcement date in acquisitions of public targets for both domestic and cross border deals. Secondly, we show that the tier of the advisor has little relevance when the acquirer is an experienced investor. This is a strong evidence that the top tier advisors do matter when their advice is most needed and that the rank of the financial advisor on the League Tables signals the quality of the services provided.
The remainder of the study is organized as follows. Section 2 presents the methodology. Section 3 describes the data used. Section 4 shows the results. Section 5 presents robustness checks. Section 6 concludes.
7
2 Methodology
To test whether the returns of the acquirer depend on the tier of the investment bank, we compute the acquirer’s abnormal returns using the event study’s methodology [MacKinlay (1997)]. We use an estimation windows of -240 to -39 days prior to the announcement date and an event windows of 5 days (−2 to +2), where day 0 is the day of the announcement. The market model is used to measure performance, where 𝑟𝑖,𝑡is the return of the acquirer i in day t and 𝑟𝑚,𝑡 is the market return in period t :
𝑟𝑖,𝑡= 𝛼𝑖+ 𝛽𝑖𝑟𝑚,𝑡+ 𝜀𝑡 (1)
The market return is the value-weighted index return from CRSP. We consider as cumulative abnormal returns (CAR) the sum of abnormal returns from day −2 to +2. To test if the CAR depends on the tier of the investment bank used as financial advisor by the acquirer, we estimate the following regression where 𝑥 is a vector of variables that also affect the returns of the acquirer:
𝐶𝐴𝑅𝑖 = 𝛽𝑥𝑖′+ 𝛾𝑇𝑜𝑝 𝑡𝑖𝑒𝑟𝑖+ 𝑢𝑖 (2)
Following the methodology of Golubov et al. (2012), we control for acquirer and deal specific variables, 𝑥, that are proven to affect the returns of the acquirer: size, book-to-market, run-up, sigma, interaction between method of payment and status of the target, relative size, diversifying deals, tender offers, hostile deals, premium, leverage and cash flows-to-equity. Moeller et al. (2004) shows that acquirer announcement returns are negatively related to firm size. Dong et al. (2006) presents evidence that there is a positive relationship between higher book-to-market ratios and cumulative abnormal returns. Run-up is the difference between the daily acquirer´s returns and the market return compounded over a specific period. Rosen (2006) shows that “hot merger markets”, this is, markets with higher run-up are associated with negative returns for acquiring firms. Sigma measures idiosyncratic volatility. Moeller et al. (2007) shows that differences in abnormal returns between acquisitions types can be explained by differences in the relation
8 between abnormal returns and idiosyncratic volatility across deal types, for example acquirers with higher idiosyncratic volatility have lower announcement returns in acquisitions paid with stocks. Fuller et al. (2002) shows that acquirer returns are positive only when the target is a private or subsidiary firm and not a public firm. They also show that acquirer returns decrease with the relative size of the target in public acquisitions and increase in private and subsidiary ones. Travlos (1987) associates acquisitions paid with stocks with lower abnormal announcement returns. Villalonga (2004) shows that diversification does not destroy value. Tender offers are deals in which the acquirer makes a public announcement to encourage the target’s shareholders to sell their shares at a given price in a specific time interval. Jensen (1983) reviews the market for corporate control and shows that tender offers are related with higher announcement returns for the acquirer. Hostile deals are acquisitions where the acquirer does not come to an agreement with the managers of the target but only with the shareholders. Previous literature presents evidence that hostile deals are associated with lower acquirer returns [Servaes (1991)]. Maloney et al. (1993) shows evidence of a positive relation between leverage and acquirer returns at the announcement period. Lang et al. (1991) shows a negative relationship between acquirer returns and cash flows-to-equity.
We add two control variables to the methodology of Golubov et. al (2012). We control for cross-border acquisitions following Morck and Yeung (1992) and Markides and Ittner (1994) who show that firms with valuable intangible assets have a positive stock price reaction after the announcement of a cross border acquisition and that international acquisitions create value for acquiring firms. The cross border dummy variable is equal to one if the target is not an US firm and zero otherwise. We also add a dummy variable for the institutional status of the target (it is equal to one if the acquirer is an institutional investor). We control for institutional acquirers given that institutional investors have a significant role on the corporate governance of firms through their allocation of funds [International Monetary Fund (2005)].
9 We consider the first eight investment banks as “top tier” following the methodology of Golubov et al. (2012). Golubov et al. (2012) shows that there is an endogeneity problem between the cumulative abnormal returns and the choice of financial advisor. The cumulative abnormal returns might not be higher because the advisor is a top tier investment bank but because a top tier bank is able to choose better deals where the returns are expected to be higher, which leads to a sample bias. We follow the methodology of Golubov et al. (2012) and we use the Heckman two-step procedure to test for this sample bias [Heckman (1979)]. The first stage equation [Equation (3)] is a probit regression that models the choice between a top tier and a non-top tier investment bank, where 𝑧 is a vector of characteristics that affect the choice between the tier of financial advisor. The instrumental variable scope accounts for the number of times that in the past (after 1985) the acquirer has used a top tier investment bank as a financial advisor on a buy-side (as an acquirer) or on a sell-side (as a target) in a previous acquisition.
𝑇𝑜𝑝 𝑡𝑖𝑒𝑟𝑖 = 𝜕𝑧𝑖′+ 𝜌 𝑠𝑐𝑜𝑝𝑒𝑖+ 𝑒𝑖 (3)
From Equation (3), we construct an inverse Mills ratio that is used as an additional regressor in Equation (4).
𝐶𝐴𝑅𝑖 = 𝛽𝑥𝑖′+ 𝜃𝐼𝑛𝑣𝑒𝑟𝑠𝑒 𝑀𝑖𝑙𝑙𝑠 𝑅𝑎𝑡𝑖𝑜𝑖+ 𝑢𝑖 (4)
If the estimated coefficient of the inverse Mills ratio is statistically significant, then we have a problem of selection bias that needs to be addressed.
3 Data
We use data on acquisitions announced between January 1, 1990 and December 31, 2012 from both Thomson One Banker and Thomson Financial Securities Data Corporation (SDC) Mergers and Acquisitions databases.2 Our sample includes US firms acquiring US firms (domestic deals)
10 and non-US firms (cross border acquisitions). We consider deals where the acquirer is a public firm and the target is a public, private or subsidiary firm. We only consider public acquirers because stock data is needed to compute returns.
We collect an initial sample of 38,846 observations (for US targets) and 11,723 observations (for non-US targets). Only deals worth more than US$ 1 M are included. After these we exclude the deals where the financial advisor of the acquirer is not reported which leads to a final number of 8,723 observations for US targets and 2,064 observations for non-US targets. We require a change of control, which means that prior to the transaction the acquirer needs to have less than 50% of the company and after the deal it has to have the majority of the shares (more than 50%) which leads to a sample of 7,859 observations for domestic deals and 1,843 observations for cross border deals.
We collect the acquirer’s stock market quotes from CRSP. We adjust the historical series for stock splits using the cumulative adjustment factor from CRSP. The number of shares outstanding needed to compute the equity value is also extracted from CRSP. The accounting data that includes book to market, leverage and cash flows to equity of the acquirer is extracted from Compustat. After filtering all the deals where the historical series of prices or the accounting data are not provided, the final sample reduces to a total of 5,564 observations for US targets and 1,300 observations for non-US targets. Finally, in order to divide the sample of acquirers between institutional and non-institutional investors we retrieve a list of SEC filings of institutional investors from Thomson Reuters Institutional (13F) Holdings, formerly known as Spectrum, and we match them with our database.
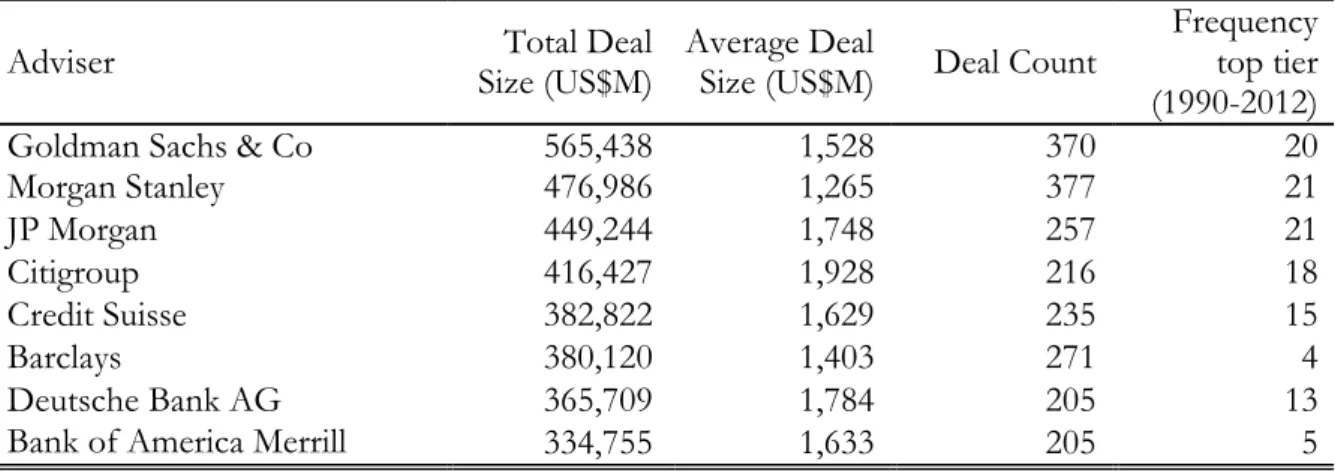
We use as criterion to define whether a financial advisor is a top tier the rank of the League Tables as these tables are frequently used. Table 1 presents the Top 8 investment banks in 2012, summary statistics of the deals advised by these banks in 2012, and the number of times they were top tier from 1990 to 2012. The data concerning the deal value and the deal count is obtained from
11 Bloomberg. League tables are persistent across time. For example, Morgan Stanley and JP Morgan were always one of the eight top investment banks in the period across 1990 and 2012.
Table 1: League Table
This table presents the rank of investment banks based on their value of M&A deals in 2012. Data is retrieved from Bloomberg.
Adviser Size (US$M) Total Deal Average Deal Size (US$M) Deal Count Frequency top tier (1990-2012)
Goldman Sachs & Co 565,438 1,528 370 20
Morgan Stanley 476,986 1,265 377 21 JP Morgan 449,244 1,748 257 21 Citigroup 416,427 1,928 216 18 Credit Suisse 382,822 1,629 235 15 Barclays 380,120 1,403 271 4 Deutsche Bank AG 365,709 1,784 205 13
Bank of America Merrill
Lynch 334,755 1,633 205 5
Descriptive Statistics
Table 2 presents descriptive statistics for the sample of M&As from 1990 to 2012 for the deals where the target is a US firm (Panel A and B) and a non-US firm (Panel C and D). The target can be a public, private or subsidiary firm.
The cumulative abnormal returns are significantly higher when the target is a non-US firm. This could be explained by the gains due to geographical diversification (different regulatory environment, client diversifications, diversified labor work force), synergies (access to new suppliers, lower transport costs, overhead synergies, leverage best-practices), economies of scale and scope, and increased market power. Eun et al. (1996) shows that cross border acquisitions are generally synergy creating activities. Seth et al. (2002) shows that the sources of value in cross border acquisitions are asset sharing, internalization of valuable intangible assets, and financial diversification. Conn and Connell (1990) shows that the gains of cross border acquisitions are also related with different effectiveness in the market for corporate control which in turn impacts the agency costs.
12
Table 2: Deal and acquirer characteristics
This table presents the descriptive statistics of the sample of acquisitions from 1990 to 2012 where the acquirer is a US company and the target is either a private, public or subsidiary US or non-US company. The sample is divided in deals where the acquirer hires a financial advisor (“all sample”) and in deals where the acquirer hires a top tier or a non-top tier financial advisor (Goldman Sachs & Co, Morgan Stanley, JP Morgan, Citi, Credit Suisse, Barclays, Deutsche Bank, and Bank of America Merrill Lynch). Panel A presents the mean statistics for the acquirer characteristics when the target is an US company: size; run-up; sigma; book-to-market; and leverage. Panel B presents the average deal characteristics when the acquirer is a US company: cumulative abnormal returns (CAR); deal value; relative size; proportion of public, private and subsidiary deals; proportion of diversifying deals (deals where the SIC code of the acquirer is different from the SIC code of the target); proportion of deals where the payment includes stocks; proportion of hostile deals (deals where the acquirer does not come to an agreement with the managers of the target but only with the shareholders); proportion of tender offers (deals where the acquirer makes a public announcement to encourage the target’s shareholders to sell their shares at a given price in a specific time interval) and; premium for public acquisitions. Panel C presents the same statistics for the acquirer characteristics but when the target is a non-US firm. Panel D presents the average deal characteristics when the acquirer is a non-US firm.
All Sample Top Tier (1) Non Top Tier (2) (1)-(2)
Mean Mean Mean p-value
Panel A: Acquirer Characteristics (target US)
Size (US$, M) 5,667 12,305 3,454 0.000 Run-up 1.122 1.134 1.117 0.336 Sigma 0.028 0.024 0.029 0.000 Book-to-market 0.612 0.531 0.639 0.000 Leverage 0.191 0.248 0.171 0.000 Cash flows-to-equity 0.039 0.000 0.052 0.179
Panel B: Deal Characteristics (target US)
CAR (-2, +2) % 0.003 -0.142 0.052 0.579
Deal Value (US$, M) 1,291 2,758 803 0.000
Relative size 13.682 15.077 13.217 0.282
Public deals 0.529 0.593 0.508 0.000
Private deals 0.290 0.196 0.321 0.000
Subsidiary deals 0.181 0.211 0.171 0.001
Payment includes stock 0.704 0.635 0.727 0.003
Diversifying deals 0.385 0.403 0.379 0.107
Hostile deals 0.026 0.040 0.022 0.002
Tender offers 0.065 0.094 0.055 0.000
Premium (only for Public) 0.383 0.385 0.382 0.895
Number of observations 5,564 1,391 4,173 -
Panel C: Acquirer Characteristics (target non-US)
Size (US$, M) 16,232 25,453 12,291 0.001 Run-up 1.120 1.078 1.138 0.046 Sigma 0.026 0.023 0.028 0.000 Book-to-market 0.010 0.004 0.013 0.007 Leverage 0.188 0.187 0.188 0.971 Cash flows-to-equity 0.128 0.099 140 0.205
Panel D: Deal Characteristics (target non-US)
CAR (-2, +2) % 0.475 0.823 0.327 0.378
Deal Value (US$, M) 607 1,136 381 0.000
Relative size 14.670 15.391 14.359 0.843
Public deals 0.335 0.358 0.325 0.246
Private deals 0.273 0.176 0.314 0.000
Subsidiary deals 0.393 0.465 0.362 0.001
Payment includes stock 0.588 0.522 0.616 0.002
Diversifying deals 0.366 0.345 0.375 0.306
Hostile deals 0.028 0.036 0.024 0.272
Tender offers 0.185 0.182 0.186 0.857
Premium (only for Public) 0.430 0.398 0.447 0.449
13 For both domestic and cross border acquisitions we do not reject that the cumulative abnormal returns are equal in the deals that were advised by top tier investment banks versus the ones advised by non-top tier banks. The acquirer’s cumulative abnormal returns around the announcement period are negative in domestic acquisitions in which the advisor is a top tier investment bank. However there are other significant differences that might explain this result. For example, the deal value is significantly higher in deals advised by top tier investment banks and there is an empirical negative relationship between size and returns [Moeller et al. (2004)].
US firms that bid for cross border targets have a substantially larger market capitalization than US firms that bid for domestic targets. US firms that acquire cross border targets present also higher cash flows-to-equity and lower book-to-market ratios. In terms of deal characteristics domestic acquisitions have a higher proportion of public targets than cross border acquisitions (53% versus 34%). The type of target is more evenly divided in cross border acquisitions. Whilst in cross border acquisitions, the majority of acquisitions are of subsidiary firms (39%), in domestic acquisition this type of acquisitions are a minority (18%). The percentage of tender offers is also higher in cross border acquisitions. Domestic acquisitions use proportionally more stocks as a method of payment than cross border acquisitions. Our sample presents the same characteristics as the ones described by Moeller and Schlingemann (2005) that show that, compared to domestic acquisitions, cross border acquisitions exhibit lower book-to-market values, more free cash flows-to-equity, involve more often payments with cash, involve less often private targets, and have a higher proportion of tender offer and hostile deals.
In domestic acquisitions, acquirers advised by top tier investment banks have lower sigma, lower book-to-market ratios, and higher leverage than acquirers advised by non-top tier banks. The differences in run-up and cash flows-to-equity are not statistically significant. In cross border acquisitions, acquirers advised by top tier investment banks have lower run-up, lower sigma and lower book-to-market than acquirers advised by non-top tier banks. The differences in leverage
14 and cash flows-to-equity are not statistically significant between acquirers that hire top tier investment banks versus those that hire non top tier investment banks. Deals where the advisor is a top tier bank have significantly larger acquirers and larger deal value, than those advised by non-top tier banks, both for domestic and cross border acquisitions. The differences in relative size are not significant between the Tier of the advisor used. Top tier investment banks advise proportionally more deals when the target is a public or subsidiary firm than deals where the target is a private company. There are not statistically significant differences in terms of the use of top tier or not top tier banks when the payment includes stocks. In domestic acquisitions, top tier investment banks are more used in hostile deals and in tender offers than their non-tier counterparts. This difference is not statistically significant in cross border acquisitions. There are not significant differences in the use of top tier or non-tier investment banks in terms of diversifying deals and premium paid (in public acquisitions).
Figure 1 presents the sectorial and geographical target distribution. Panel A shows the sectorial distribution of US targets and Panel B of non-US across time. The majority of the US targets are from the financial sector (30%), manufacturing (27%) or services (24%) firms whereas the majority of the non-US targets are manufacturing (47%) and service firms (23%). Amel et al. (2004) points to the fact that the limitations imposed by the Glass-Steagall Act up to 1999 could have hampered the realization of gains from cross selling and geographical expansion. This might explain the lower proportion of financial targets in our sample of cross border acquisitions.
Panel C shows the geographical distribution of non US targets across time. The majority of the cross border targets are from Europe (61%) and Canada (19%). Developing countries, which we consider non-OECD countries, represent less than 15% of cross border targets.
15
Figure 1: Sectorial and geographical target distribution
Panel A presents the distribution of targets’ industry for domestic acquisitions from 1990 to 2012. Panel B presents the distribution of targets’ industry for cross border acquisitions. Panel C presents the distribution of cross border acquisitions across continents from 1990 to 2012 (target is a non-US firm). North America excludes United States. Panel A: Distribution of targets’ industry for US firms (domestic acquisitions)
Panel B: Distribution of targets’ industry for non-US firms (cross border acquisitions)
Panel C: Distribution of non-US targets’ across continents
0 100 200 300 400 500 600 1990 1991 1992 1993 1994 1995 1996 1997 1998 1999 2000 2001 2002 2003 2004 2005 2006 2007 2008 2009 2010 2011 2012
Financial Services Manufacturing Services Transportation, Communications and Utilities other
0 20 40 60 80 100 120 1990 1991 1992 1993 1994 1995 1996 1997 1998 1999 2000 2001 2002 2003 2004 2005 2006 2007 2008 2009 2010 2011 2012
Manufacturing Services Financial Services Mining Transportation, Communications and Utilities other
0 20 40 60 80 100 120 1990 1991 1992 1993 1994 1995 1996 1997 1998 1999 2000 2001 2002 2003 2004 2005 2006 2007 2008 2009 2010 2011 2012
16
4 Results
We aim to find a clear and consistent answer to the puzzling role of financial advisors in acquisitions. To do this, we test if the acquirer’s cumulative abnormal returns depend on the tier of the investment bank used as financial advisor. Our main variable of interest is Tier that takes the value of one if the financial advisor of the acquirer is one of the eight investment banks with higher deal value (Goldman Sachs, Morgan Stanley, JP Morgan, Citigroup, Credit Suisse, Barclays, Deutsche Bank, and Bank of America Merrill Lynch), and zero otherwise. We control for other variables that, are proven in previous literature and that we explained in the methodology section, affect the returns around the announcement period. The coefficients of Equation (2) are estimated by OLS and the results are presented in Table 3. The standard errors are adjusted for heterocedasticity and bidder clustering. We also control for year fixed effects.
All the signs of the coefficients for the all sample are in accordance with previous literature with exception of sigma and cash flows-to-equity. The sigma coefficient is positive, which means that higher idiosyncratic volatility leads to higher abnormal returns. Our result is consistent with the financial hypothesis that higher risk is correlated with higher returns [Ludvigson and Ng (2007)]. Golubov et. al (2012) also presents positive estimates for the sigma coefficient. The positive cash flows-to-equity coefficients contradict previous literature that shows that acquisitions by “cash-rich” firms are value decreasing [Lang et al. (1991) and Harford (2002)]. The positive impact of cash flows-to-equity might be justified by the fact that acquisitions improve long-term cash flow performance of both acquirer and target relatively to industry peers [Andrade et al. (2001)]. As our sample includes cross border acquisitions, we add a dummy variable that takes the value of one if the target is a non US firm. The cross border variable is significant at 1% level. The cross border coefficient is positive which is in line with previous literature that shows that cross border acquisitions are value enhancing [Morck and Yeung (1992), Markides and Ittner (1994), Seth et al. (2002)]. We also add another dummy variable to the methodology of Golubov et al. (2012) that
17
Table 3: Cross-sectional OLS regression analysis of acquirer cumulative abnormal returns for a sample of acquisitions from 1990 to 2012
This table presents the results of the regression analysis (Equation (2)) of the cumulative abnormal returns of the acquirer on the tier of the investment bank used as financial advisor and on other acquirer and deal characteristics. The acquirer is a US public firm and the target is an US or non-US public, private or subsidiary firm. The standard errors are adjusted for heterocedasticity and bidder clustering. The regressions are controlled for year fixed effects. The symbols ***, ** and *, represent statistical significance at 1%, 5% and 10% significance levels, respectively. N designates the number of observations. The total number of observations includes public deals in which the premium was not available, and that are not in included when we run the regression only for public targets.
All (1) Public (2) Private (3) Subsidiary (4)
Intercept 0.026 * -0.009 0.023 0.017 Tier 0.010 *** 0.009 ** 0.007 -0.001 Size -0.004 *** -0.003 ** -0.003 -0.001 Book-to-market 0.013 *** 0.015 *** 0.011 0.014 Run-up -0.010 *** -0.012 ** -0.006 -0.011 Sigma 0.390 ** -0.014 0.563 * 0.617
Public x all cash -0.027 ***
Public x paym. incl. stock -0.057 ***
Private x all cash -0.010
Private x paym. incl. stock -0.009
Subsidiary x all cash -0.004
Payment incl. stock -0.028 *** -0.002 -0.006
Relative size 0.007 0.000 0.020 *** 0.025 ** Diversifying deals 0.002 0.003 0.008 0.001 Tender offers 0.015 ** 0.009 * 0.113 *** Hostile deals -0.012 * -0.009 Premium -0.010 *** Leverage 0.018 *** 0.021 *** 0.015 0.000 Cash flows-to-equity 0.000 *** 0.000 *** 0.000 *** 0.000 Cross border 0.027 *** 0.035 *** 0.011 0.015 Institutional investor 0.011 ** 0.014 ** -0.004 0.006 N 6,864 2,971 1,968 1,517 R2 (%) 10.39 9.16 9.02 19.08
takes the value of one if the acquirer is an institutional investor, and zero otherwise. It is significant at a 5% level. The coefficient associated with the institutional investor variable is positive which means that when the acquirer is an institutional investor the cumulative abnormal returns around the announcement day are higher. This positive impact on the returns around the announcement period might be explained by the fact that institutional investors are more informed investors due to the nature of their operations and number of assets under management. The increasingly
18 relevant impact of institutional investors in financial markets is widely accepted [IMF (2005), Dor (2003), Edmans (2009)].
After controlling for variables that are proven to affect the returns around the announcement day, we show that the acquirer cumulative abnormal returns depend on the tier of investment bank for the all sample of acquisitions. To test different hypothesis about the significance of the Tier variable, we divide our sample between different target status, US and non-US targets and diverse types of acquirers (institutional, extraordinary, and experienced).
Hypothesis 1: The significance of the Tier variable is related to the complexity of the deal.
Our first research hypothesis is that top Tier investment banks should add more value in more complex deals that demand higher negotiation skills and more complex valuation methods. In order to analyze this hypothesis, we test if the significance is different if the target is a public, private or subsidiary firm, and if it is different between domestic and cross border acquisitions. Public transactions are more complex than acquisitions of private or subsidiary firms due to several reasons. Public targets have higher bargaining power which can be reflected in the amount of synergies captured by the target [Fuller et al. (2002)]. It is also more difficult to reclaim any compensation if the target does not disclose significant information in the due diligence findings due to the higher dispersion of ownership [Golubov et al. (2012)].
We show that the variable Tier is statistically significant at a 5% level if the target is a public firm. However, we do not attain the same results when we consider private or subsidiary targets. This is consistent with the hypothesis of the relevance of the tier in more complex deals. When the target is public not only the share price of the acquirer but also of the target can be affected, which increases the complexity and the impact of the acquisition. There is also a higher reputational exposure in public acquisitions [Rhee and Valdez (2009)] that might generate higher incentives for
19 investment banks to outperform. This result is consistent with the hypothesis that top tier advisors do matter when their advice is most needed.
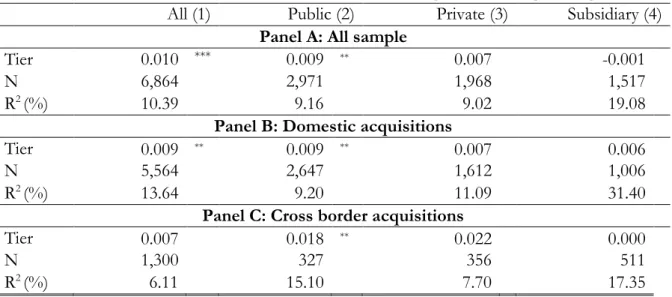
Previous studies focus on the relevance of cross border acquisitions as a mode of foreign investment [Kogut and Singh (1988)], transfer of knowledge and organizational learning process [Vermeulen and Barkena (2001)], and of shareholder’s wealth creation [Morck and Yeung (1992)]. Moeller and Schlingemann (2005) discusses the higher complexity in terms of valuation for cross border targets versus domestic targets. The former complexity can be explained by different regulatory environment and different exchange rate. For example, Harris and Ravenscraft (1991) indicates that exchange rate movements have a significant role in foreign direct investment through acquisitions. Table 4 presents the results of the Tier coefficient when we estimate Equation (2) for subsamples of domestic and cross border deals.
Table 4: Cross-sectional OLS regression analysis of acquirer cumulative abnormal returns for a sample of acquisitions from 1990 to 2012 for domestic and cross border acquisitions This table presents the results of the regression analysis (Equation (2)) of the cumulative abnormal returns of the acquirer on the tier of the investment bank used as financial advisor and on other acquirer and deal characteristics. This table only shows the coefficients of the Tier variable but the regression is estimated with the all the control variables shown in Table 3 and described in the methodology section. Panel A presents the Tier coefficient for the whole sample. Panel B presents the Tier coefficient for domestic acquisitions (acquirer is a US public company and the target is a US public, private or subsidiary company). Panel C presents the Tier coefficient for cross border acquisitions (acquirer is a US public company and the target is a non-US public, private or subsidiary company). The standard errors are adjusted for heterocedasticity and bidder clustering. The regressions are controlled for year fixed effects. The symbols ***, ** and *, represent statistical significance at 1%, 5% and 10% significance levels, respectively. N designates the number of observations. The total number of observations includes public deals in which the premium was not available, and that are not in included when we run the regression only for public targets.
All (1) Public (2) Private (3) Subsidiary (4)
Panel A: All sample
Tier 0.010 *** 0.009 ** 0.007 -0.001
N 6,864 2,971 1,968 1,517
R2 (%) 10.39 9.16 9.02 19.08
Panel B: Domestic acquisitions
Tier 0.009 ** 0.009 ** 0.007 0.006
N 5,564 2,647 1,612 1,006
R2 (%) 13.64 9.20 11.09 31.40
Panel C: Cross border acquisitions
Tier 0.007 0.018 ** 0.022 0.000
N 1,300 327 356 511
20 Our hypothesis is that the Tier variable should be more relevant in cross border acquisitions due to this higher valuation complexity. We do not find different results in terms of the Tier significance and sign in domestic and cross border acquisitions - the Tier coefficient is still only significant for public acquisitions.
We use a Chow test to test if the Tier variable is more significant in cross border acquisitions. We do not reject the null hypothesis that the Tier coefficient is equal in domestic and cross border acquisitions. This result holds for both public, private and subsidiary deals.
Hypothesis 2: The Tier variable is not significant when the acquirer is an experienced investor.
Our second research hypothesis is that the Tier significance should be related to the experience of the acquirer firm. We consider different types of experienced investors: institutional investors, extraordinary acquirers and acquirers that bid for both domestic and cross border targets.
4.1 Institutional Acquirers
Institutions such as mutual funds, investment banks, insurance companies and pension funds have an increasingly relevant role in financial markets. IMF (2005) reports that the investment decisions of institutional investors increasingly “make markets”. There is an extensively discussion of the impact of “smart money” in different corporate events. For example, Dor (2003) shows that initial public offerings (IPO) with a largest share of institutional ownership outperform IPOs with smaller shares of institutional ownership. Edmans (2009) shows that trading by informed shareholders leads stock prices to more accurately reflect the fundamental value of the firm. But is this ability to “make markets” also reflected in the ability to “make acquisitions”?
We divide our sample in two subsamples, as we consider acquisitions in which the acquirer is an institutional investor and acquisitions by non-institutional investors. We run the same regression as before and we show that when an institutional investor bids for a public company the use of a
21 top tier investment bank is not significant (but it is significant if the acquirer is a non-institutional investor). Table 5 presents the Tier coefficient results of Equation (2) for a subsample of institutional acquirers. We show that the ability of institutional investors to “make markets” is also reflected in the ability to “make acquisitions”. The investment expertise and know-how of institutional investors makes the added value of a top tier investment bank not significant in public acquisitions.
Table 5: Cross-sectional OLS regression analysis of acquirer cumulative abnormal returns for a sample of acquisitions from 1990 to 2012 performed by institutional investors
This table presents the results of the regression analysis (Equation (2)) of the cumulative abnormal returns of the acquirer on the tier of the investment bank used as financial advisor and on other acquirer and deal characteristics. The acquirer is an institutional investor. This table only shows the coefficients of the Tier variable but the regression is estimated with the all the control variables shown in Table 3 and described in the methodology section. The standard errors are adjusted for heterocedasticity and bidder clustering. The regressions are controlled for year fixed effects. The symbols ***, ** and *, represent statistical significance at 1%, 5% and 10% significance levels, respectively. N designates the number of observations. The total number of observations includes public deals in which the premium was not available, and that are not in included when we run the regression only for public targets.
All (1) Public (2) Private (3) Subsidiary (4)
Tier 0.019 ** 0.004 0.051 0.045
N 208 117 31 48
R2 (%) 29.56 25.63 86.45 83.66
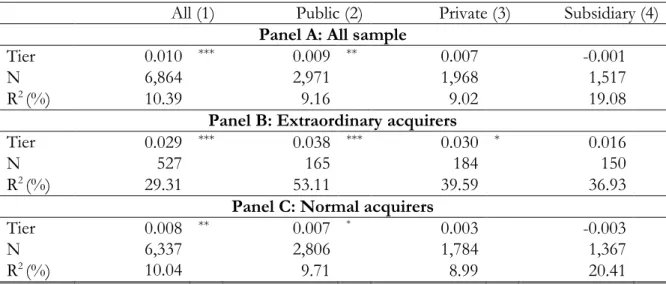
4.2 Extraordinary Acquirers
Golubov et al. (2013) studies acquirers that persistently generate positive announcement returns. Firms that in the past executed more than two acquisitions and had positive cumulative abnormal returns in all the acquisitions performed are classified as extraordinary acquirers. All the other acquirers are classified as normal acquirers. Extraordinary acquirers represent less than 10% of our sample. The cumulative abnormal returns around the announcement the period are on average 8% to extraordinary acquirers and only less than 1% for normal acquirers. Golubov et al. (2013) associates the superior performance of extraordinary acquirers with the presence of top quality management teams. We test if the Tier variable is still significant if we only consider deals
22 performed by extraordinary acquirers. In order to this, we divide our sample between extraordinary and normal acquirers and we show that the Tier variable is still significant for both cases. This implies that even if the acquirer has a top quality management team the fact that the investment bank is one of the top tiers has still an impact on the returns.
Table 6: Cross-sectional OLS regression analysis of acquirer cumulative abnormal returns for a sample of acquisitions from 1990 to 2012 performed by extraordinary and normal acquirers
This table presents the results of the regression analysis (Equation (2)) of the cumulative abnormal returns of the acquirer on the tier of the investment bank used as financial advisor and on other acquirer and deal characteristics. This table only shows the coefficients of the Tier variable but the regression is estimated with the all the control variables shown in Table 3 and described in the methodology section. Panel A presents the Tier coefficient for the whole sample. Panel B presents the Tier coefficient for acquisitions where the acquirer is an extraordinary acquirer. We classify as an extraordinary acquirer those that acquired more than two companies and that had always positive cumulative abnormal returns. Panel C presents the Tier coefficient for acquisitions where the acquirer is a normal acquirer. The standard errors are adjusted for heterocedasticity and bidder clustering. The regressions are controlled for year fixed effects. The symbols ***, ** and *, represent statistical significance at 1%, 5% and 10% significance levels, respectively. N designates the number of observations. The total number of observations includes public deals in which the premium was not available, and that are not in included when we run the regression only for public targets.
All (1) Public (2) Private (3) Subsidiary (4)
Panel A: All sample
Tier 0.010 *** 0.009 ** 0.007 -0.001
N 6,864 2,971 1,968 1,517
R2 (%) 10.39 9.16 9.02 19.08
Panel B: Extraordinary acquirers
Tier 0.029 *** 0.038 *** 0.030 * 0.016
N 527 165 184 150
R2 (%) 29.31 53.11 39.59 36.93
Panel C: Normal acquirers
Tier 0.008 ** 0.007 * 0.003 -0.003
N 6,337 2,806 1,784 1,367
R2 (%) 10.04 9.71 8.99 20.41
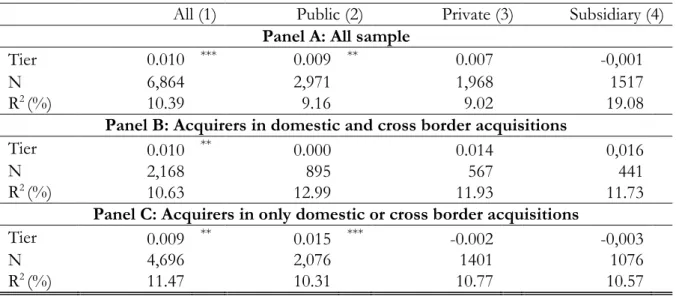
4.3 Domestic and cross border acquirers
We test if our results depend on the fact that the acquirer only performs domestic (or cross border) acquisitions or if it acquires both domestic and cross border targets. The intuition behind lies in the fact that an acquirer that hires both domestic and international firms should be a more
23 experienced acquirer more used to more complex and different deals. We show that the variable
Tier is significant for public acquisitions in which the acquirer only acquires US or non-US firms
but it is not significant when the acquirer bids for both US and non-US firms (in a sample from 1990 to 2012). Once again we show that if the acquirer is an experienced investor that acquires both domestic and international targets the Tier does not add value anymore.
Table 7: Cross-sectional OLS regression analysis of acquirer cumulative abnormal returns for a sample of acquisitions from 1990 to 2012 for acquirers that perform domestic and cross border acquisitions
This table presents the results of regression analysis (Equation (2)) of the cumulative abnormal returns of the acquirer on the tier of the investment bank used as financial advisor and on other acquirer and deal characteristics. This table only shows the coefficients of the Tier variable but the regression is estimated with the all the control variables shown in Table 3 and described in the methodology section. Panel A presents the Tier coefficient for the whole sample. Panel B presents the Tier coefficient for acquirers that from 1990 to 2012 acquired US and non US firms (domestic and cross border acquisitions). Panel C presents the Tier coefficient for acquirers that from 1990 to 2012 only acquired US and non US firms (domestic or cross border acquisitions). The standard errors are adjusted for heterocedasticity and bidder clustering. The regressions are controlled for year fixed effects. The symbols ***, ** and *, represent statistical significance at 1%, 5% and 10% significance levels, respectively. N designates the number of observations. The total number of observations includes public deals in which the premium was not available, and that are not in included when we run the regression only for public targets.
All (1) Public (2) Private (3) Subsidiary (4)
Panel A: All sample
Tier 0.010 *** 0.009 ** 0.007 -0,001
N 6,864 2,971 1,968 1517
R2 (%) 10.39 9.16 9.02 19.08
Panel B: Acquirers in domestic and cross border acquisitions
Tier 0.010 ** 0.000 0.014 0,016
N 2,168 895 567 441
R2 (%) 10.63 12.99 11.93 11.73
Panel C: Acquirers in only domestic or cross border acquisitions
Tier 0.009 ** 0.015 *** -0.002 -0,003
N 4,696 2,076 1401 1076
R2 (%) 11.47 10.31 10.77 10.57
5 Robustness Tests
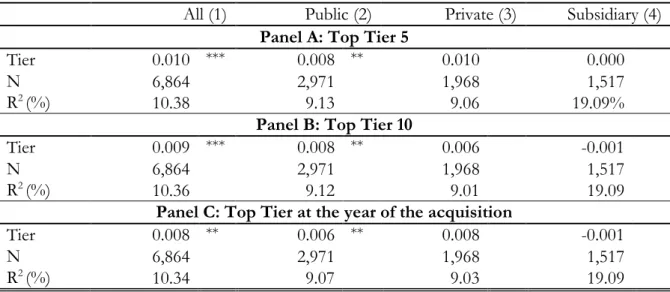
We run several robustness tests to check our results. We confirm that our results do not depend on the cut of the number of top tier investment banks. For this purpose, we rerun the analysis for cuts of 5, 6, 7, 9, and 10 top banks. The results are not affected either in terms of significance or
24 sign of the coefficients. We also consider as top tier the top 8 investment banks in the year of the acquisition (and not in 2012) and our results do not change. This result was expected as League Tables are persistent across time. Table 8 presents the results for the robustness tests of the cut of the number of top tier investment banks.
Table 8: Cross-sectional OLS regression analysis of acquirer cumulative abnormal returns for a sample of acquisitions from 1990 to 2012: robustness cut of the tier
This table presents the results of regression analysis (Equation (2)) of the cumulative abnormal returns of the acquirer on the tier of the investment bank used as financial advisor and on other acquirer and deal characteristics. This table only shows the coefficients of the Tier variable but the regression is estimated with the all the control variables shown in Table 3 and described in the methodology section. Panel A presents the Tier coefficient when the top 5 investment banks are considered as top tier. Panel B presents the Tier coefficient when the top 10 investment banks are considered as top tier. Panel C presents the Tier coefficient when the top 8 investment banks at the time of the acquisition are considered as top tier. The standard errors are adjusted for heterocedasticity and bidder clustering. The regressions are controlled for year fixed effects. The symbols ***, ** and *, represent statistical significance at 1%, 5% and 10% significance levels, respectively. N designates the number of observations. The total number of observations includes public deals in which the premium was not available, and that are not in included when we run the regression only for public targets.
All (1) Public (2) Private (3) Subsidiary (4)
Panel A: Top Tier 5
Tier 0.010 *** 0.008 ** 0.010 0.000
N 6,864 2,971 1,968 1,517
R2 (%) 10.38 9.13 9.06 19.09%
Panel B: Top Tier 10
Tier 0.009 *** 0.008 ** 0.006 -0.001
N 6,864 2,971 1,968 1,517
R2 (%) 10.36 9.12 9.01 19.09
Panel C: Top Tier at the year of the acquisition
Tier 0.008 ** 0.006 ** 0.008 -0.001
N 6,864 2,971 1,968 1,517
R2 (%) 10.34 9.07 9.03 19.09
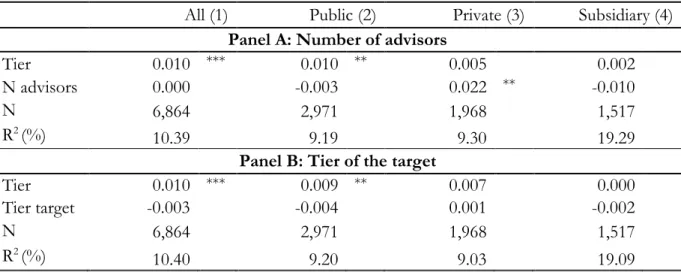
In some acquisitions the acquirer hires a consortium of financial advisors to perform the valuation and execution of the deal. In more than 900 deals (around 15% of the sample) the acquirer hires more than one investment bank. We test if the number of financial advisors has an impact on the cumulative abnormal returns of the acquirer. The variable “number of financial advisors” is only significant for acquisitions where the target is a private company and it never affects the significance level of the top tier variable.
25 We also control if the tier of the target has an impact on the returns of the acquirer. We add a dummy to Equation (2) that is equal to one if the target hired a top tier bank as a financial advisor. This variable is not significant and has no impact on the level of significance of the coefficient of the variable tier (tier of the financial advisor hired by the acquirer).
Table 9: Cross-sectional OLS regression analysis of acquirer cumulative abnormal returns for a sample of acquisitions from 1990 to 2012: robustness number of advisors and Tier of the target
This table presents the results of regression analysis (Equation (2)) of the cumulative abnormal returns of the acquirer on the tier of the investment bank used as financial advisor and on other acquirer and deal characteristics. This table shows the coefficients of the Tier variable but the regression is estimated with the all the control variables shown in Table 3 and described in the methodology section. Panel A presents the Tier coefficient when we add to Equation (2) the number of advisors hired by the acquirer as control variable. Panel B presents the Tier coefficient when we add to Equation (2) the Tier of the investment bank hired by the target as control variable. The standard errors are adjusted for heterocedasticity and bidder clustering. The regressions are controlled for year fixed effects. The symbols ***, ** and *, represent statistical significance at 1%, 5% and 10% significance levels, respectively. N designates the number of observations. The total number of observations includes public deals in which the premium was not available, and that are not in included when we run the regression only for public targets.
All (1) Public (2) Private (3) Subsidiary (4)
Panel A: Number of advisors
Tier 0.010 *** 0.010 ** 0.005 0.002
N advisors 0.000 -0.003 0.022 ** -0.010
N 6,864 2,971 1,968 1,517
R2 (%)
10.39 9.19 9.30 19.29
Panel B: Tier of the target
Tier 0.010 *** 0.009 ** 0.007 0.000
Tier target -0.003 -0.004 0.001 -0.002
N 6,864 2,971 1,968 1,517
R2 (%)
10.40 9.20 9.03 19.09
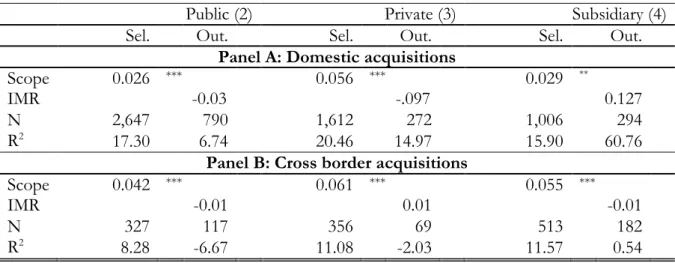
It is only possible to achieve unbiased coefficients estimates in Equation (2) using the ordinary least squares (OLS) method if the regressors are exogenous. We follow the methodology of Golubov et al. (2012) and we use the Heckman two stage procedure to test if we have a sample bias. This sample bias consists in the fact that the CARs might not be higher because the advisor is a top tier investment bank but because a top tier bank is able to choose better deals where the returns are expected to be higher. The most relevant results of the Heckman method are presented
26 in Table 10. The inverse Mills ratio adjusts for the non-zero mean of the error term and it is not significant which means that there is not a sample bias and that the estimates from Table 3 are reliable.
Table 10: Heckman two-stage procedure for a sample of acquisitions from 1990 to 2012 This table presents the results of the Heckman two stage procedure to test for sample bias. The column selection (sel.) shows the scope coefficient of the probit equation [Equation (3)] and the column outcome (out.) shows the inverse mills ratio (IMR) coefficient of Equation (4). Panel A presents the coefficients of the regressions when the acquirer is a US public firm and the target is an US public, private or subsidiary firm. Panel B presents the coefficients of the regressions when the acquirer is a US public firm and the target is a non-US public, private or subsidiary firm. The scope variable accounts for the number of times that in the past (after 1985) the acquirer has used a top tier investment bank as a financial advisor on a buy-side (as an acquirer) or on a sell-side (as a target) in a previous acquisition. The symbols ***, ** and *, represent statistical significance at 1%, 5% and 10% significance levels, respectively. N designates the number of observations. The total number of observations includes public deals in which the premium was not available, and that are not in included when we run the regression only for public targets.
Public (2) Private (3) Subsidiary (4)
Sel. Out. Sel. Out. Sel. Out.
Panel A: Domestic acquisitions
Scope 0.026 *** 0.056 *** 0.029 **
IMR -0.03 -.097 0.127
N 2,647 790 1,612 272 1,006 294
R2
(%) 17.30 6.74 Panel B: Cross border acquisitions 20.46 14.97 15.90 60.76
Scope 0.042 *** 0.061 *** 0.055 ***
IMR -0.01 0.01 -0.01
N 327 117 356 69 513 182
R2
(%) 8.28 -6.67 11.08 -2.03 11.57 0.54
Andrade et al. (2001) finds empirical evidence that acquisitions are clustered by industry. Liu and Qiu (2013) explains that industry clustering in acquisitions is driven by industry specific shocks, such as, changes in costs, demand and deregulation. We control for industry clustering and neither the significance, the sign or magnitude of the coefficients change.
Liu and Qiu (2013) investigates the differences between firms that acquire foreign firms in developing markets and those that acquire firms in developed markets. They show that US firms that acquire firms in developed countries are significantly worse (in operational terms) than those that acquire firms in developing countries. We test if the development of the target in cross border
27 acquisitions affect the significance of the Tier variable. We consider as developed countries those that belong to OECD and we don’t find any significant differences in terms of the impact of top tier banks on the returns around the announcement period.
6 Conclusion
This paper analyzes the role of top tier investment banks as financial advisors in acquisitions. By using a sample of more than 6,000 acquisitions from 1990 to 2012, we find evidence that the choice of a top tier investment bank has a positive impact on the returns of the acquirer in public acquisitions. This result holds for both domestic and cross border acquisitions. However, if we consider a subsample of acquisitions in which the acquirer is an institutional investor the tier of the investment bank is not significant for public acquisitions. This can be explained by the fact that the significance of the tier is related to the reputation and expertise of the advisor that is needed for more complex acquisitions (which explains why the tier is only significant for public acquisitions) and in cases in which the acquirer is not an institutional investor with large pool of assets under management. This is a strong indication that top tier advisors do matter when their advice is most needed.
28
References
Amel, B., C, Panetta, F., and Salleo, C., 2004. Consolidation and efficiency in the financial sector: A review of the international evidence. Journal of Banking and Finance 28 (10), 2493-2519.
Andrade, G., Mitchell, M., Stafford, E., 2001. New evidence and perspectives on mergers. Journal of Economic Perpectives 15 (2), 103-120.
Bowers, HM., Miller, RE., 1990. Choice of investment banker and shareholders' wealth of firms involved in acquisitions. Financial Management 19 (4), 34-56.
Conn, RL., Connell, F., 1990. International mergers: Returns to US and British firms. Journal of Business Finance & Accounting 17 (5), 689-711.
Dong, M., Hirshleifer, D., Richardson, S., Teoh, SH., 2006. Does the investor misvaluation drive the takeover market? The Journal of Finance 61 (2), 725-762.
Dor, AB., 2003. The performance of initial public offerings and the cross section of institutional ownership. Unpublished Working Paper.
Edmans, A., 2009. Blockholder trading, market efficiency, and managerial myopia. The Journal of Finance 64 (6), 2481-2513.
Eun, CS., Kolodny, F., Carl, S., 1996. Cross border acquisitions and shareholder wealth: Tests of the synergy and internationalization hypothesis. Journal of Banking and Finance 20 (9), 1559-1582.
Fuller, K., Netter, J., Stegemoller, M., 2002. What do returns to acquiring firms tell us? Evidence from firms that make many acquisitions. The Journal of Finance 57 (4), 1763-1793.
Golubov, A., Petmezas, D., Travlos, NG., 2012. When it pays to pay your investment banker? New evidence on the role of financial advisors in M&As. The Journal of Finance 67 (1), 271-311.
Golubov, A., Yawson, A., Zhang, H., 2013. Experienced acquirers.Unpublished Working Paper.
Gruber, MJ., 1996. Another puzzle: The growth in actively managed mutual funds. The Journal of Finance 51 (3), 783-810.
Harford, J., 2002. Corporate cash reserves and acquisitions. The Journal of Finance 54 (6), 1969-1977. Heckman, JJ., 1979. Sample selection bias as a specification error. Econometrica 47 (1), 153-161.
Hunter, WC., Jagtiani, J., 2003. An analysis of advisor choice, fees and effort in mergers and acquisitions. Review of Financial Economics 12 (1), 65-81.
Ismail, A., 2010. Are good financial advisors really good? The performance of investment banks in the M&A market. Review of Quantitative Finance and Accounting 35 (4), 411-429.
Jensen, MC., 1983. The market for corporate control: The scientific evidence. Journal of Financial Economics 11 (1), 5-50.
Kogut, B., Singh, H., 1988. The effect of national culture on the choice of entry mode. Journal of International Business Studies 29 (4), 411-432.
29
Lang, LHP., Stulz, RM., Walkling, RA., 1991. A test of the free cash flow hypothesis: The case of bidder returns. Journal of Financial Economics 29 (2), 315-336.
Liu, Q., Qiu, LD., 2013. Characteristics of acquirers and targets in domestic and cross border mergers and acquisitions. Review of Development Economics 17 (3), 474-479.
Ludvigson , C., Ng, S., 2007. The empirical risk-returm relationship: A factor analysis approach. Journal of Financial Economics 83 (1), 171-222.
MacKinlay, AC., 1997. Event studies in economics and finance. Journal of Economic Literature 35 (7), 13-39.
Maloney, MT., McCormick, RE., Mitchell, ML., 1993. Managerial decision making and capital structure. Journal of Business 66 (2), 189-217.
Markides, CC., Ittner, CD., 1994. Shareholder benefits from corportate international diversification: Evidence from US international acquisitions. Journal of International Business Studies 25 (2), 343-366. Moeller, SB., Schlingemann, FP., Stulz, RM., 2004. Firm size and the gains from acquisitions. Journal of Financial Economics 73 (2), 201-228.
Moeller, SB., Schlingemann, FP., 2005. Global diversification and bidder gains: A comparison between cross-border and domestic acquisitions. Journal of Banking and Finance 29 (3), 533-564.
Moeller, SB., Schlingemann, FP., Stulz, RM., 2005. Wealth destruction on a massive scale? A study of acquiring-firm returns in the recent merger wave. The Journal of Finance 60 (2), 757-782.
Moeller, SB., Schlingemann, PF., Stulz, RM., 2007. How do diversity of opinion and information assymetry affect acquirer returns? Review of Financial Studies 20 (5), 2047-2078.
Morck, R., Yeung, B., 1992. Internationalization: an event study. Journal of International Economics, 33 (1), 41-56.
Rau, PR., 2000. Investment bank market share, conting fee payment, and the performance of acquiring firms. Journal of Financial Economics 56 (4), 293-324.
Rhee, M., Valdez, ME., 2009. Contextual factors surrounding reputation damage with potential implications for reputation repair. Academy of Management Review 34 (1), 146-168.
Rhodes-Kropf, M., Viswanathan, S., 2004. Market valuation and merger waves. The Journal of Finance 59 (6), 2685-2718.
Rosen. RR., 2006. Merger momentum and investor sentiment: The stock market reaction to merger announcements. Journal of Business 79 (2), 987-1017.
Servaes, H., 1991. Tobin's Q and the gains from takeovers. The Journal of Finance 46 (1), 409-419. Servaes, H., Zenner, M., 1996. The role of investment banks in acquisitions. The Review of Financial Studies 9 (3), 787-815.
Seth, A., Song, KP., Pettit, RR., 2002. Value creation and destruction in cross border acquisitions: An empirical analysis of foreign acquisitions of U.S firms. Strategic Management Journal 23 (10), 921-940.
30
Travlos, NG., 1987. Corporate takeover bids, methods of payment, and bidding firms' stock returns. The Journal of Finance 42 (4), 943-963.
Vermeulen, F., Barkema, H., 2001. Learning through acquisitions. Academy of Management Journal 44 (3), 457-476.
Villalonga, B., 2004. Does diversification cause the "diversification discount"? Financial Management 33 (2), 5-27.