EUROPEAN ORGANIZATION FOR NUCLEAR RESEARCH (CERN)
CERN-EP-2017-258 2018/03/23
CMS-TOP-16-023
Measurement of the inclusive tt cross section in pp
collisions at
√
s = 5.02 TeV using final states with at least
one charged lepton
The CMS Collaboration
∗Abstract
The top quark pair production cross section (σtt) is measured for the first time in pp collisions at a center-of-mass energy of 5.02 TeV. The data were collected by the CMS experiment at the LHC and correspond to an integrated luminosity of 27.4 pb−1. The measurement is performed by analyzing events with at least one charged lepton. The measured cross section is σtt=69.5±6.1 (stat)±5.6 (syst)±1.6 (lumi) pb, with a total relative uncertainty of 12%. The result is in agreement with the expectation from the standard model. The impact of the presented measurement on the determination of the gluon distribution function is investigated.
Published in the Journal of High Energy Physics as doi:10.1007/JHEP03(2018)115.
c
2018 CERN for the benefit of the CMS Collaboration. CC-BY-4.0 license
∗See Appendix A for the list of collaboration members
1
1
Introduction
The top quark, the heaviest elementary particle in the standard model (SM), has been the sub-ject of numerous detailed studies using hadron-hadron collisions. The pair production (tt) cross section (σtt) as a function of center-of-mass energy can be of interest for the extraction of the top quark pole mass [1] and has been used to constrain the gluon distribution function [2] at large fractions x of the proton longitudinal momentum carried by the gluon, where the gluon dis-tribution is poorly known. Precise measurements of σtt in proton-proton (pp) collisions have been published at√s values of 7 and 8 [3–6] and 13 TeV [7–10] by the ATLAS and CMS Collab-orations at the LHC.
In November 2015, the LHC delivered pp collisions at√s =5.02 TeV. The fraction of tt events initiated by gluon-gluon collisions grows monotonically with√s. It is around 73% at 5.02 TeV, as calculated withPOWHEG (v2) [11–13] at next-to-leading order (NLO) using the NNPDF3.0 NLO [14] parton distribution functions (PDFs), and increases to around 86% at 13 TeV, mak-ing this new data set partially complementary to the higher-energy samples. Measurements of tt production at various√s probe different values of x and thus can provide complemen-tary information on the gluon distribution. In addition, future measurements of σtt in nuclear collisions at the same nucleon-nucleon center-of-mass energy [15, 16] would profit from the availability of a reference measurement in pp collisions at√s = 5.02 TeV, without the need to extrapolate from measurements at different√s. This has already been demonstrated with the first observation of the tt process using proton-nucleus collisions at a higher nucleon-nucleon center-of-mass energy [17].
In the SM, top quarks in pp collisions are mostly produced as tt pairs. Each top quark decays predominantly to a W boson and a bottom (b) quark. The tt events are categorized according to the decay of the two W bosons. In tt events where one W boson decays leptonically and the other hadronically (`+jets channel), the final state presents a typical signature of one isolated lepton, missing transverse momentum, two jets from the W boson hadronic decay, and two jets coming from the hadronization of the b quarks (“b jets”). On the other hand, in tt events where both W bosons decay leptonically (dilepton channel), the final state contains two leptons of opposite electric charge, missing transverse momentum, and at least two b jets. The`+jets channel has a large branching ratio with a moderate amount of background, while the dilepton channel is characterized by a high purity.
This analysis represents the first measurement of σtt in pp collisions at√s = 5.02 TeV using tt candidate events with `+jets, where leptons are either electrons (` = e) or muons (` = µ),
and dilepton (e±µ∓ or µ±µ∓) final states. In the former case, σtt is extracted by a fit to the
distribution of a kinematic variable for different categories of lepton flavor and jet multiplicity, while in the latter an event counting approach is used. The two results are then combined in the final measurement, which is used as input to a quantum chromodynamics (QCD) analysis at next-to-next-to-leading order (NNLO) to investigate the impact on the determination of the gluon distribution in the less-explored kinematic range of x&0.1.
This paper is structured as follows. Section 2 describes the CMS detector. Section 3 gives a sum-mary of the data and simulated samples used. After the discussion of the object reconstruction in Section 4, and of the trigger and event selection in Section 5, Section 6 describes the deter-mination of the background sources. The systematic uncertainties are discussed in Section 7. The extraction of σttis presented in Section 8 and the impact of the presented measurement on the determination of the proton PDFs is discussed in Section 9. A summary of all the results is given in Section 10.
2
The CMS detector
The central feature of the CMS apparatus is a superconducting solenoid of 6 m internal diame-ter, providing a magnetic field of 3.8 T parallel to the beam direction.
Within the solenoid volume are a silicon pixel and strip tracker, a lead tungstate crystal elec-tromagnetic calorimeter (ECAL), and a brass and scintillator hadron calorimeter (HCAL), each composed of a barrel and two endcap sections. A preshower detector, consisting of two planes of silicon sensors interleaved with about 3 radiation lengths of lead, is located in front of the endcap regions of ECAL. Hadron forward calorimeters using steel as an absorber and quartz fibers as the sensitive material extend the pseudorapidity coverage provided by the barrel and endcap detectors from|η| =3.0 to 5.2.
Charged particle trajectories with |η| < 2.5 are measured by the tracker system, while the
energy deposits in ECAL and HCAL cells are summed to define the calorimeter tower ener-gies, subsequently used to calculate the energies and directions of hadronic jets. Muons are detected in the pseudorapidity window|η| <2.4 in gas-ionization detectors embedded in the
steel flux-return yoke outside the solenoid. Photons and electrons are reconstructed by their deposited energy in groups of ECAL crystals (“clusters”). Events of interest are selected us-ing a two-tiered trigger system [18]. The first level, composed of custom hardware processors, uses information from the calorimeters and muon detectors to select events at a rate of around 100 kHz within a time interval of less than 4 µs. The second level, known as the high-level trig-ger, consists of a farm of processors running a version of the full event reconstruction software optimized for fast processing, and reduces the event rate to around 1 kHz before data storage. A more detailed description of the CMS detector, together with a definition of the coordinate system used and the relevant kinematic variables, can be found in Ref. [19].
3
Data, simulated samples and theoretical cross section
This analysis is based on an integrated luminosity of 27.4±0.6 pb−1[20]. The presence of mul-tiple proton collisions in the same or nearby bunch crossings (“pileup”) results in an average number of overlapping interactions estimated online to be 1.4, assuming a total inelastic cross section of 65 mb.
Several Monte Carlo (MC) event generators are used to simulate signal and background events. The NLOPOWHEG(v2) [11–13] generator is used for tt events, assuming a value of 172.5 GeV for the top quark mass (mtop). These events are passed toPYTHIA(v8.205) [21, 22] to simulate
parton showering, hadronization, and the underlying event, using the CUETP8M1 [23, 24] tune for the default tt MC sample. The NNPDF3.0 NLO PDFs with strong coupling αs(MZ) =0.118
at the Z boson mass scale MZare utilized in the MC calculations.
The MADGRAPH5 aMC@NLO(v5 2.2.2) generator [25] is used to simulate W boson production with additional jets (W+jets), and high-mass (>50 GeV) Drell–Yan quark-antiquark annihila-tion into lepton-antilepton pairs through Z boson or virtual-photon exchange (referred to as “Z/γ∗”). The simulation includes up to two extra partons at matrix element level, and the FXFXmerging procedure [26] is used to interface with PYTHIA. Low-mass Z/γ∗ events (20– 50 GeV) are simulated with PYTHIA. The normalization of the W+jets and Z/γ∗ processes is either derived from data (in the dilepton channel) or estimated based on the NNLO cross sec-tions (in the`+jets channel) from the FEWZprogram (v3.1.b2) [27]. Single top quark plus W boson events (tW) are simulated usingPOWHEG (v1) [28, 29] interfaced withPYTHIA, and are normalized to the approximate NNLO cross sections [30]. The contributions from WW and WZ
3
production (referred to as “WV”) are simulated withPYTHIA, and are normalized to the NLO cross sections calculated with theMCFM(v8.0) program [31]. All generated events undergo a full GEANT4 [32] simulation of the detector response.
The expected signal yields are normalized to the value of the SM prediction for the tt produc-tion cross secproduc-tion:
σNNLO=68.9+−1.92.3(scale)±2.3(PDF)+−1.41.0(αs)pb, (1)
as calculated with the TOP++ program [33] at NNLO in perturbative QCD, including soft-gluon resummation at next-to-next-to-leading-logarithmic order [34], using the NNPDF 3.0 NNLO PDF set, with αs(MZ) =0.118 and mtop = 172.5 GeV. The systematic uncertainties in
the theoretical tt cross section are associated with the choice of the renormalization (µR) and
factorization (µF) scales–nominally set at µR = µF = √
m2top+p2T,top with pT,top the top quark
transverse momentum–as well as with the PDF set and the αsvalue. The uncertainty of 0.1% in
the LHC beam energy [35] translates into an additional uncertainty of 0.22 pb in the expected cross section, with negligible impact on the acceptance of any of the channels included in this analysis.
4
Object reconstruction
The particle-flow (PF) algorithm [36] is used to reconstruct and identify individual particles using an optimized combination of information from the various elements of the CMS detector. The electron momentum is calculated by combining the energy measurement in the ECAL with the momentum measurement in the tracker, taking into account the bremsstrahlung photons spatially compatible with originating from the electron track. The momentum resolution for electrons with transverse momentum pT ≈ 45 GeV from Z → ee decays ranges from 1.7% for
nonshowering electrons in the barrel region to 4.5% for showering electrons in the endcaps [37]. Muon candidates are reconstructed from a combination of the information collected by the muon spectrometer and the silicon tracker. This results in a relative pTresolution of 1.3–2.0% in
the barrel and better than 6% in the endcaps, for muons with 20< pT <100 GeV and within the
range|η| <2.4 [38, 39]. The photon energy is directly obtained from the ECAL measurement,
corrected for zero-suppression effects. The charged hadron energies are determined from a combination of their momenta measured in the tracker and the matching ECAL and HCAL energy deposits, corrected for zero-suppression effects and for the response function of the calorimeters to hadronic showers. Finally, the neutral hadron energies are obtained from the corresponding corrected ECAL and HCAL energies.
The missing transverse momentum vector is defined as the negative vector sum of the mo-menta of all reconstructed PF candidates in an event, projected onto the plane perpendicular to the direction of the proton beams. Its magnitude is referred to as pmissT and the corrections to jet momenta are propagated to the pmissT calculation [40].
The reconstructed vertex with the largest value of summed physics-object p2Tis taken to be the primary pp interaction vertex. The physics objects are the jets, clustered using the jet finding algorithm [41, 42] with the tracks assigned to the vertex as inputs, and the associated pmissT . The isolation of electron and muon candidates from nearby jet activity is then evaluated as follows. For electron and muon candidates, a cone of ∆R = 0.3 and 0.4, respectively, is constructed around the direction of the lepton track at the primary event vertex, where∆R is defined as
√
(∆η)2+ (∆φ)2, and ∆η and ∆φ are the differences in pseudorapidity and azimuthal angle between the directions of the lepton and another particle. A relative isolation discriminant,
Irel, is calculated by the ratio between the scalar pT sum of all particle candidates inside the
cone consistent with originating from the primary vertex and the pTof the lepton candidate. In
this sum, we exclude the pTof the lepton candidate. The neutral particle contribution to Irelis
corrected for energy deposits from pileup interactions using different techniques for electrons and muons. For muons, half of the total pTof the charged hadron PF candidates not originating
from the primary vertex is subtracted. The factor of one half accounts for the different fraction of charged and neutral particles in the cone. For electrons, the FASTJETtechnique [43] is used, in which the median of the energy-density distribution of neutral particles (within the area of any jet in the event) multiplied by the geometric area of the isolation cone–scaled by a factor that accounts for the residual η-dependence of the average energy deposition due to pileup–is subtracted.
The efficiency of the lepton selection is measured using a “tag-and-probe” method in same-flavor dilepton events enriched in Z boson candidates, following the method of Ref. [44]. The sample of Z → µ+µ− events used for muon efficiency extraction is selected by the same
trig-ger requirement used by the main analysis (Section 5). The Z → e+e− sample for electron efficiency extraction makes use of events that satisfy a diphoton trigger with symmetric trans-verse energy, ET =∑iEisin θi, thresholds of ET =15 GeV covering the full tracker acceptance,
where Ei is the energy seen by the calorimeters for the ith particle, θi is the polar angle of
par-ticle i, and the sum is over all parpar-ticles emitted into a fixed solid angle in the event. Pairs of photon candidates above the ET threshold are accepted only if their invariant mass is above
50 GeV. The trigger selection requires a loose identification using cluster shower shapes and a selection based on the ratio of the hadronic to the electromagnetic energy of the photon can-didates. Based on a comparison of the lepton selection efficiency in data and simulation, the event yield in simulation is corrected using data-to-simulation scale factors.
Jets are reconstructed from the PF candidates using the anti-kT clustering algorithm [41] with
a distance parameter of 0.4. Jets closer than ∆R = 0.3 to the nearest muon or electron are discarded. Jet energy corrections extracted from full detector simulation are also applied as a function of jet pTand η [45] to data and simulation. A residual correction to the data is applied
to account for the discrepancy between data and simulation in the jet response.
5
Event selection
The event sample is selected by a loose online trigger and further filtered offline to remove noncollision events, such as beam-gas interactions or cosmic rays. Collision events containing one high-pTelectron (muon) candidate are selected online by requiring values of ET(pT) greater
than 40 (15) GeV and of|η|less than 3.1 (2.5). The measured trigger efficiency for each decay
channel, relative to the final selection, is higher than 90%.
In the`+jets analysis, electron candidates are selected if they have pT >40 GeV and|η| <2.1.
Further identification and isolation criteria are applied to the electron candidates. Electrons re-constructed in the ECAL barrel (endcap) are required to have Irel<4 (5)%. Electron candidates in the 1.44< |η| <1.57 region, i.e., in the transition region between the barrel and endcap
sec-tions of the ECAL, are excluded because the reconstruction of an electron object in this region is less efficient. Muons are required to have pT >25 GeV and|η| <2.1. Additional identification
criteria are applied and Irel is required to be< 15%. Events are rejected if they contain extra
electrons or muons identified using a looser set of identification criteria and have pT > 10 or
15 GeV, respectively.
5
is exploited in the`+jets analysis. Backgrounds from W+jets, QCD multijet, and Z/γ∗ events are controlled by counting the number of b jets in the selected events. In addition, two light-flavor jets are expected to be produced in the decay of one of the W bosons for signal events. The correlation in phase space of these light jets carries a distinctive hallmark with respect to the main backgrounds. To that end, jets are selected if they have pT > 30 GeV and|η| < 2.4.
The flavor of the jets is identified using a combined secondary vertex algorithm [46] with an operating point that yields a b jet identification efficiency of about 70%, and misidentification (mistag) probabilities of about 1% and 15% for light-flavor (u, d, s, and gluons) and c jets, respectively. The event selection requires at least two non-b-tagged jets to be identified as candidates from the W boson hadronic decay. Additional jets passing the b quark identification criteria are counted and used to classify the selected events in none (0 b), exactly one (1 b), or at least two (≥2 b) tagged jet categories. The efficiency of the b jet identification algorithm is measured in situ, simultaneously with the signal cross section.
Dilepton events are required to contain at least one muon candidate at trigger level. No require-ment on the presence of electron candidates is made at trigger level owing to the relatively high-ET threshold (40 GeV) of the trigger. Electrons are selected if they have pT > 20 GeV, |η| <2.4, and Irel <9 (or 12)% if in the barrel (or one of the endcaps). As in the`+jets channel,
electrons detected in the transition region between the barrel and endcap sections of the ECAL are excluded. Muons are required to have pT > 18 GeV, |η| < 2.1, and Irel < 15%. At least
two jets satisfying the criteria pT > 25 GeV and|η| < 3 are required. Events are subsequently
selected if they have a pair of leptons with opposite charge (e±µ∓or µ±µ∓) passing the
require-ments listed above. In events with more than one pair of leptons passing the above selection, the two leptons of opposite charge that yield the highest scalar pT sum are selected.
Candidate events with dilepton invariant masses of M`` < 20 GeV are removed to suppress events from decays of heavy-flavor resonances and low-mass Z/γ∗processes. Dilepton events with two muons in the final state are still dominated by the Z/γ∗ background. In order to suppress this contribution, events in the Z boson mass window of 76 < M`` < 106 GeV are vetoed in this channel. To further suppress the Z/γ∗events, a requirement on pmissT of>35 GeV is imposed.
In both the`+jets and dilepton analyses, events with τ leptons are considered as signal if they decay to electrons or muons that satisfy the selection requirements, and are included in the simulation.
6
Background estimation
6.1 The
`
+jets final stateIn the`+jets analysis, the contributions of all background processes are estimated from simula-tion, with the exception of the QCD multijet background. Due to its large cross secsimula-tion, there is a nonnegligible contribution from the latter faking a tt event with`+jets in the final state. Both the contribution from hard fragmentation of c and b quarks whose hadrons decay semilep-tonically, and the contribution from misidentified leptons, such as from either punch-through hadrons or collimated jets with a high electromagnetic fraction, can yield`+jets-like topologies. The estimation of the QCD multijet background is separately performed for the events with 0, 1, or ≥2 b jets using a control region where either the muon candidate fails a looser iso-lation requirement (Irel < 20%) or the electron candidate fails the identification criteria. The
contamination due to the signal and W+jets events, while retaining a large number of events in the sample for the estimation of this type of background. The initial normalization of the QCD multijet contribution in the signal region is derived from events with pmissT < 20 GeV (“reduced-signal” region). Events in both the reduced-signal and control regions fulfilling this requirement are counted. After subtracting the expected contributions from non-QCD pro-cesses, the ratio between the numbers of events observed in the reduced-signal region and in the control region, is used as a transfer factor to normalize the QCD multijet background esti-mate. In both the electron and muon channels, a 30% uncertainty is assigned to the estimate of the expected contribution from non-QCD processes, estimated after varying the QCD scales in the W+jets simulation. This uncertainty propagates as both a normalization and a shape uncer-tainty in the predicted distributions for the QCD multijet processes. The variations are applied independently in the reduced-signal and control regions in order to determine an uncertainty envelope. A more accurate normalization for this contribution is obtained by the fit performed to extract the final cross section, described in Section 8.1.
6.2 The dilepton final state
Final states with two genuine leptons can originate from background processes, primarily from Z/γ∗ →τ+τ−(where the τ leptonic decays can yield e±µ∓or µ±µ∓plus pmissT due to the
neu-trinos), tW, and WV events. Other background sources, such as W+jets events or tt production in the`+jets final state, can contaminate the signal sample if a jet is misidentified as a lepton, or if an event contains a lepton from the decay of b or c hadrons. These are included in the “non-W/Z” category, since genuine leptons are defined as originating from decays of W or Z bosons. The yields from tW and WV events are estimated from simulation, while the contribu-tion of the Z/γ∗background is evaluated using control samples in data. The rate of non-W/Z backgrounds is extracted from control samples in data for the e±µ∓channel and is estimated
from simulation for the µ±µ∓channel.
A scale factor for the Z/γ∗ background normalization is estimated, as in Ref. [47], from the number of events within the Z boson mass window in data, which is extrapolated to the num-ber of events outside the window. A scale factor of 0.91±0.14 (stat) is obtained in the e±µ∓
channel, and 0.96±0.78 (stat) in the µ±µ∓channel. The estimation is performed using events
with at least two jets, and the dependence on different jet multiplicities is discussed in Section 7. The non-W/Z background in the e±µ∓channel is estimated using an extrapolation from a
con-trol region of same-sign (SS) dilepton events to the signal region of opposite-sign (OS) dilep-tons. The SS control region is defined using the same criteria as for the nominal signal region, except requiring dilepton pairs of the same charge. The muon isolation requirement is relaxed in order to enhance the number of events. The SS dilepton events predominantly contain at least one misidentified lepton. Other SM processes produce genuine SS or charge-misidentified dilepton events with significantly smaller rates; these are estimated using simulation and sub-tracted from the observed number of events in data. The scaling from the SS control region in data to the signal region is performed using an extrapolation factor extracted from MC simu-lation, given by the ratio of the number of OS events with misidentified leptons to the number of SS events with misidentified leptons. The resulting estimate for the non-W/Z background is 1.0±0.9 (stat) events, where the central value comes from the estimation using events with at least two jets. No particular dependence of this scale factor is observed for different jet mul-tiplicities within the large statistical uncertainty.
7
7
Systematic uncertainties
The integrated luminosity has been estimated offline using a pixel cluster counting method [20]. The estimation takes into account normalization uncertainties and uncertainties related to the different conditions during typical physics periods relative to the specially tailored beam-separation scans, adding up to a total uncertainty of±2.3%.
The uncertainties in the electron trigger efficiency (1.5%) and the identification and isolation efficiency (2.5%) are estimated by changing the values of the data-to-simulation scale factors within their uncertainties, as obtained from the “tag-and-probe” method. The uncertainty in the muon identification and isolation efficiency, including the trigger efficiency, is 3% and cov-ers one standard deviation of the scale factor from unity.
The impact of the uncertainty in the jet energy scale (JES) is estimated by changing the pT
-and η-dependent JES corrections by a constant 2.8% [45, 48]. The uncertainty in jet energy resolution (JER) is estimated through η-dependent changes in the JER corrections to the simu-lation [45, 48]. The uncertainty arising from the use of pmiss
T in the µ±µ∓channel is dominated
by the unclustered energy contribution to pmissT [40]. Finally, a 30% uncertainty is conserva-tively assigned to the jet misidentification probability in the `+jets analysis, as no dedicated measurement of this quantity has been performed for the considered data set.
Theoretical uncertainties in the simulation of tt production cause a systematic bias related to the missing higher-order diagrams inPOWHEG, which is estimated through studies of the sig-nal modeling by modifying the µR, µFscales within a factor of two with respect to their nominal
value. In the`+jets analysis, the impact of the µR, µF variations are examined independently,
while in the dilepton analysis they are varied simultaneously. In both analyses, these vari-ations are applied independently at the matrix element (ME) and parton shower (PS) levels. The uncertainty arising from the hadronization model mainly affects the JES and the fragmen-tation of jets. The hadronization uncertainty is determined by comparing samples of events generated with POWHEG, where the hadronization is either modeled with PYTHIA or HER -WIG++ (v2.7.1) [49]. This also accounts for differences in the PS model and the underlying event. The uncertainty from the choice of PDF is determined by reweighting the sample of simulated tt events according to the root-mean-square (RMS) variation of the NNPDF3.0 replica set. Two extra variations of αsare added in quadrature to determine the total PDF uncertainty.
In the`+jets analysis, the uncertainty in the choice of the µR, µFscales in the W+jets simulation
is taken into account by considering alternative shapes and yields after varying independently the µR, µFscales, following a similar procedure to that described above for the signal. Due to
the finite event count in the W+jets simulated sample, an additional bin-by-bin uncertainty is assigned by generating an alternative shape to fit (see Section 8.1), where the bin prediction is varied by±1 standard deviation, while keeping all the other bins at their nominal expectation. The uncertainty assigned to the QCD multijet background includes the statistical uncertainty in the data, and the uncertainty from the non-QCD multijet contributions subtracted from the control region, as described in Section 6.1, and an additional 30%–100% normalization uncer-tainty. The latter depends on the event category and stems from the measured difference with respect to an alternative estimate of the QCD normalization based on the transverse mass, mT,
of the lepton and pmissT system. The magnitude of mT equals √
2pTpmissT (1−cos∆φ), where pT
is the lepton transverse momentum and∆φ is the azimuthal angle between the lepton and the direction of~pmiss
T . Finally, a 30% normalization uncertainty in the theoretical tW, Z/γ∗, and
WV background cross sections is assigned [5], given the previously unexplored√s value and that the final states contain several jets.
In the dilepton channel, an uncertainty of 30% is assumed [5] for the cross sections of the tW and WV backgrounds to cover the theoretical uncertainties and the effect of finite simulated samples. The uncertainty in the Z/γ∗ estimation is calculated by combining in quadrature the statistical uncertainty and an additional 30% from the variation of the scale factor in the dif-ferent levels of selection, resulting in uncertainties of about 30 and 80% in the e±µ∓and µ±µ∓
channels, respectively. The systematic uncertainty in the non-W/Z background is estimated to be 90% in the e±µ∓channel and is dominated by the statistical uncertainty in the method.
Ow-ing to the limited sample size in the data, the method cannot be applied in the µ±µ∓channel.
The estimation is therefore based on MC simulation, and an uncertainty of 100% is conserva-tively assigned.
8
Measurement of the tt cross section
8.1 The
`
+jets final stateIn the`+jets analysis, the tt cross section is measured in a fiducial phase space by means of a fit. Two variables were independently considered for the fit, which are sensitive to the reso-nant behavior of the light jets produced from the W boson hadronic decay in a tt event. Given that these light jets, here denoted by j and j0, are correlated during production, they are also expected to be closer in phase space when compared to pairs of other jets in the event. The an-gular distance∆R can thus be used as a metric to rank all pairs of non-b-tagged jets in the event, maximizing the probability of selecting those from the W boson hadronic decay in cases where more than two non-b-tagged jets are found. From simulation we expect that the signal peaks at low ∆R, while the background is uniformly distributed up to ∆R ≈ 3. Above that value, fewer events are expected and background processes are predicted to dominate. The invari-ant mass M(j, j0)of jets j and j0 also has a distinctive peaking feature for the signal in contrast with a smooth background continuum. From simulation we expect that the minimum angular distance∆R between all pairs of jets j and j0,∆Rmin(j, j0), is robust against signal modeling
un-certainties such as the choice of the µR, µFscales and jet energy scale and resolution, while the
M(j, j0)variable tends to be more affected by such uncertainties. Owing to its more robust sys-tematic uncertainties and signal-to-background discrimination power, the∆Rmin(j, j0)variable
is used to extract the tt cross section.
In order to maximize the sensitivity of the analysis, the ∆Rmin(j, j0)distributions are
catego-rized according to the number of jets–in addition to the ones assigned to the W boson hadronic decay–passing the b quark identification criteria. In total, 6 categories are used, corresponding to electron or muon events with 0, 1, or ≥2 b jets. The expected number of signal and back-ground events in each category prior to the fit and the observed yields are given in Table 1. Good agreement is observed between data and expectations.
The M(j, j0) and ∆Rmin(j, j0) distributions are shown in Fig. 1. The distributions have been
combined for the e+jets and µ+jets channels to maximize the statistical precision and are shown for events with different b-tagged jet multiplicities. Fair agreement is observed between data and the pre-fit expectations.
A profile likelihood ratio (PLR) method, similar to the one employed in Ref. [10], is used to perform the fit. In addition, a scale factor for the b tagging efficiency (SFb) is included as a
parameter of interest in the fit. The PLR is written as:
λ(µ, SFb) = L(µ, SFb, ˆˆΘ)
L(µˆ, ˆSFb, ˆΘ)
8.1 The`+jets final state 9
Table 1: The number of expected background and signal events and the observed event yields in the different b tag categories for the e+jets and µ+jets analyses, prior to the fit. With the exception of the QCD multijet estimate, for which the total uncertainty is reported, the uncer-tainties reflect the statistical uncertainty in the simulated samples.
Source
b tag category
0 b 1 b ≥2 b
e+jets µ+jets e+jets µ+jets e+jets µ+jets
tW 3.03±0.02 5.6±0.03 2.49±0.02 4.5±0.03 0.39±0.01 0.67±0.01 W+jets 776±17 1704±26 13±2 26±3 0.2±0.3 0.8±0.6 Z/γ∗ 136±4 162±5 1.7±0.5 2.8±0.6 0.1±0.1 0.1±0.1 WV 0.52±0.01 1.01±0.02 <0.01 <0.02 <0.01 <0.01 QCD multijet 440±130 490±150 3.6±1.1 28±8 2.5±0.8 2.0±0.8 tt signal 22.8±0.3 42.3±0.4 36.9±0.4 71.1±0.5 13.8±0.2 27.0±0.3 Total 1380±130 2410±150 57.7±2.4 131±9 16.8±0.9 31±1 Observed data 1375 2406 61 129 19 33 0 100 200 300 400 M(j, j') (GeV) 0 200 400 600 Events / 20 GeV Data t t tW W+jets QCD multijet * γ Z/ WV lumi ⊕ Stat 2 jets ≥ l + (5.02 TeV) -1 27.4 pb CMS 0 100 200 300 400 M(j, j') (GeV) 0 20 40 Events / 20 GeV Data t t tW W+jets QCD multijet * γ Z/ WV lumi ⊕ Stat 2 jets ≥ l + (5.02 TeV) -1 27.4 pb CMS 0 100 200 300 400 M(j, j') (GeV) 0 5 10 15 20 Events / 20 GeV Data t t tW W+jets QCD multijet * γ Z/ WV lumi ⊕ Stat 2 jets ≥ l + (5.02 TeV) -1 27.4 pb CMS 0 1 2 3 4 5 6 (j, j') min R ∆ 0 500 1000 Events Data t t tW W+jets QCD multijet * γ Z/ WV lumi ⊕ Stat 2 jets ≥ l + (5.02 TeV) -1 27.4 pb CMS 0 1 2 3 4 5 6 (j, j') min R ∆ 0 10 20 30 40 50 60 Events Data t t tW W+jets QCD multijet * γ Z/ WV lumi ⊕ Stat 2 jets ≥ l + (5.02 TeV) -1 27.4 pb CMS 0 1 2 3 4 5 6 (j, j') min R ∆ 0 2 4 6 8 10 12 14 16 18 Events Data t t tW W+jets QCD multijet * γ Z/ WV lumi ⊕ Stat 2 jets ≥ l + (5.02 TeV) -1 27.4 pb CMS
Figure 1: The predicted and observed distributions of the (upper row) M(j, j0)and (lower row) ∆Rmin(j, j0)variable for`+jets events in the 0 b (left), 1 b (center), and≥2 b (right) tagged jet
cat-egories. The distributions from data are compared to the sum of the expectations for the signal and backgrounds prior to any fit. The QCD multijet background is estimated from data (see Section 5.1). The cross-hatched band represents the statistical and the integrated luminosity uncertainties in the expected signal and background yields added in quadrature. The vertical bars on the data points represent the statistical uncertainties.
where µ=σ/σtheois the signal strength (ratio of the observed tt cross section to the expectation
from theory) andΘ is a set of nuisance parameters that encode the effect on the expectations due to variations in the sources of the systematic uncertainties described in Section 7. The
0.6 0.8 1 1.2 1.4 th
σ
/
σ
=
µ
0.8 0.9 1 1.1 1.2 bSF
Observed Observed 68% CL Expected Expected 68% CL2 jets
≥
l +
(5.02 TeV) -1 27.4 pbCMS
0.6 0.8 1 1.2 1.4 thσ
/
σ
=
µ
µ e µ l = e, Distributions Count (5.02 TeV) -1 27.4 pbCMS
2 jets
≥
l +
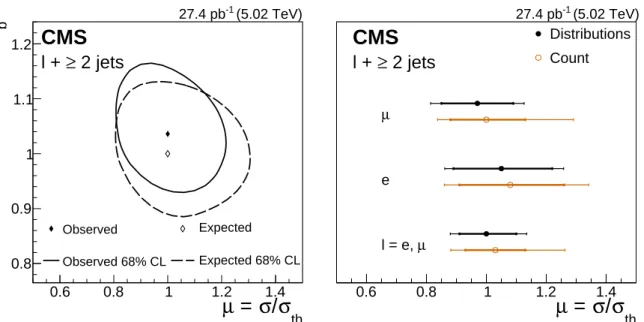
Figure 2: Left: The 68% CL contour obtained from the scan of the likelihood in`+jets analysis, as a function of µ and SFbin the`+jets analysis. The solid (dashed) contour refers to the result
from data (expectation from simulation). The solid (hollow) diamond represents the observed fit result (SM expectation). Right: Summary of the signal strengths separately obtained in the e+jets and µ+jets channels, and after their combination in the`+jets channel. The results of the analysis from the distributions are compared to those from the cross-check analysis with event counting (Count). The inner (outer) bars correspond to the statistical (total) uncertainty in the signal strengths.
quantities ˆˆΘ correspond to the values of the nuisance parameters that maximize the likelihood for the specified signal strength and b tagging efficiency (conditional likelihood), and ˆµ, ˆSFb, ˆΘ
are, respectively, the values of the signal strength, b tagging efficiency, and nuisance parameters that maximize the likelihood.
Figure 2 (left) shows the two-dimensional contours at the 68% confidence level (CL) obtained from the scan of −2 ln(λ), as functions of µ and SFb. The expected results, obtained using
the Asimov data set [50], are compared to the observed results and found to be in agreement well within one standard deviation. The signal strength is obtained after profiling SFband the
result is µ = 1.00+−0.100.09(stat)+−0.090.08(syst). As a cross-check, the signal strength is also extracted by fitting only the total number of events observed in each of the six categories. The observed value µ = 1.03+−0.100.10(stat)−+0.210.11(syst) is in agreement with the analysis using the ∆Rmin(j, j0)
distributions. Figure 2 (right) summarizes the results obtained for the signal strength fit in each channel separately from the analysis of the distributions and from event counting. In both cases, a large contribution to the uncertainty is systematic in nature, although the statistical component is still significant. In the `+jets combination, the µ+jets channel is expected and observed to carry the largest weight.
In order to estimate the impact of the experimental systematic uncertainties in the measured signal strength, the fit is repeated after fixing one nuisance parameter at a time at its post-fit uncertainty (±1 standard deviation) values. The impact on the signal strength fit is then evaluated from the difference induced in the final result from this procedure. By repeating the fits, the effect of some nuisance parameters being fixed may be reabsorbed by a variation of the ones being profiled, owing to correlations. As such, the individual experimental uncertainties obtained and summarized in Table 2 can only be interpreted as the observed post-fit values,
8.1 The`+jets final state 11
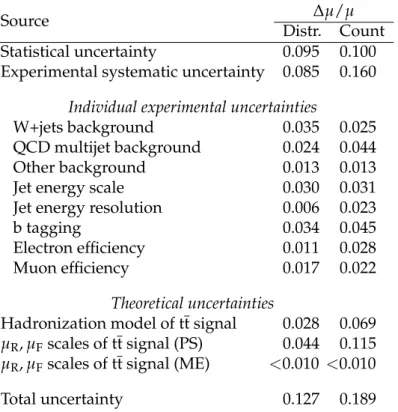
Table 2: Estimated impact of each source of uncertainty in the value of µ extracted from the analysis of distributions, and in the cross-check from event counting. The “Other background” component includes the contributions from Z/γ∗, tW, and WV events. The total uncertainty is obtained by adding in quadrature the statistical, experimental systematic, and theoretical uncertainties. The individual experimental uncertainties are obtained by repeating the fit after fixing one nuisance parameter at a time at its post-fit uncertainty (±1 standard deviation) value. The values quoted have been symmetrized.
Source ∆µ/µ
Distr. Count
Statistical uncertainty 0.095 0.100
Experimental systematic uncertainty 0.085 0.160
Individual experimental uncertainties
W+jets background 0.035 0.025
QCD multijet background 0.024 0.044
Other background 0.013 0.013
Jet energy scale 0.030 0.031
Jet energy resolution 0.006 0.023
b tagging 0.034 0.045
Electron efficiency 0.011 0.028
Muon efficiency 0.017 0.022
Theoretical uncertainties
Hadronization model of tt signal 0.028 0.069
µR, µFscales of tt signal (PS) 0.044 0.115
µR, µFscales of tt signal (ME) <0.010 <0.010
Total uncertainty 0.127 0.189
and not as an absolute, orthogonalized breakdown of uncertainties. With respect to the event counting, the analysis of the distributions is less prone to the uncertainties in the QCD multijet background, jet energy resolution, and signal modeling. In both cases, the signal modeling uncertainties and the b tagging efficiency are among the largest sources of uncertainty.
The fiducial cross section is measured in events with one electron (muon) in the range pT >35
(25) GeV and|η| <2.1 (including the transition region for electrons), and at least two jets with
pT >25 GeV and|η| <2.4. After multiplying the signal strength by the theoretical expectations
(Eq. (1)), we find
σfid=20.8±2.0 (stat)±1.8 (syst)±0.5 (lumi) pb.
The combined acceptance in the e+jets and µ+jets channels is estimated using the NLOPOWHEG simulation to beA =0.301±0.007, with the uncertainty being dominated by the variation of the µR, µFscales at ME and PS levels and the hadronization model used for the tt signal. The
uncertainty due to the PDFs is included but verified to be less important. Taking into account the acceptance of the analysis and its uncertainty, the inclusive tt cross section is determined to be
σtt =68.9±6.5 (stat)±6.1 (syst)±1.6 (lumi) pb,
Number of jets 0 1 2 3 4 ≥ 5 Events 0 20 40 Data t t Non-W/Z WV tW * γ Z/ lumi ⊕ Stat (5.02 TeV) -1 27.4 pb
CMS
e±µ ± (GeV) T H 0 50 100 150 200 250 300 Events / 20 GeV 0 2 4 6 8 Data t t Non-W/Z WV tW * γ Z/ lumi ⊕ Stat (5.02 TeV) -1 27.4 pbCMS
e±µ± (GeV) ± l ± l M 0 50 100 150 200 250 300 Events / 20 GeV 0 5 10 15 Data t t Non-W/Z WV tW * γ Z/ lumi ⊕ Stat (5.02 TeV) -1 27.4 pbCMS
e±µ + ± ≥ 2 jets (GeV) T Dilepton p 0 20 40 60 80 100 120 Events / 10 GeV 0 5 10 Data t t Non-W/Z WV tW * γ Z/ lumi ⊕ Stat (5.02 TeV) -1 27.4 pbCMS
e±µ + ± ≥ 2 jetsFigure 3: Predicted and observed distributions of the (upper row) jet multiplicity and scalar pT
sum of all jets (HT) for events passing the dilepton criteria, and of the (lower row) invariant
mass and pT of the lepton pair after requiring at least two jets, in the e±µ∓channel. The Z/γ∗
and non-W/Z backgrounds are determined from data (see Section 6.2). The cross-hatched band represents the statistical and integrated luminosity uncertainties in the expected signal and background yields added in quadrature. The vertical bars on the data points represent the statistical uncertainties. The last bin of the distributions contains the overflow events.
8.2 The dilepton final state
In the dilepton analysis, the tt cross section is extracted from an event counting measurement. Figure 3 shows the distributions of the jet multiplicity and the scalar pTsum of all jets (HT), for
events passing the dilepton criteria in the e±µ∓channel. In addition, it displays the lepton-pair
invariant mass and pT distributions, after requiring at least two jets in the event in the e±µ∓
channel. Figure 4 shows the pmissT and the lepton-pair invariant mass distributions in the µ±µ∓
channel for events passing the dilepton criteria, and the Z boson veto with the pmissT >35 GeV requirement, in the second case. The predicted distributions take into account the efficiency corrections described in Section 5 and the background estimations discussed in Section 6.2. Good agreement is observed between the data and predictions for both signal and background. The fiducial tt production cross section is measured by counting events in the visible phase space (defined by the same pT, |η|, and multiplicity requirements for leptons and jets as
de-scribed in Section 5, but including the transition region for electrons) and is denoted by σfid. It
is extrapolated to the full phase space in order to determine the inclusive tt cross section using the expression
σtt = N−NB εA L =
σfid
8.2 The dilepton final state 13 (GeV) miss T p 0 20 40 60 80 100 120 140 Events / 10 GeV 1 − 10 1 10 2 10 3 10 4 10 Data t t Non-W/Z WV tW * γ Z/ lumi ⊕ Stat (5.02 TeV) -1 27.4 pb
CMS
µ±µ + Z veto± (GeV) ± l ± l M 0 50 100 150 200 250 300 Events / 20 GeV 1 − 10 1 10 2 10 Data t t Non-W/Z WV tW * γ Z/ lumi ⊕ Stat (5.02 TeV) -1 27.4 pbCMS
miss T p + Z veto + ± µ ± µFigure 4: Predicted and observed distributions of the (left) pmissT in events passing the dilepton criteria and Z boson veto, and of the (right) invariant mass of the lepton pair after the pmissT >
35 GeV requirement in the µ±µ∓ channel. The cross-hatched band represents the statistical
and integrated luminosity uncertainties in the expected signal and background yields added in quadrature. The vertical bars on the data points represent the statistical uncertainties. The last bin of the distributions contains the overflow events.
Table 3: The predicted and observed numbers of dilepton events obtained after applying the full selection. The values are given for the individual sources of background, tt signal, and data. The uncertainties correspond to the statistical component.
Source e±µ∓ µ±µ∓ tW 0.92±0.02 0.29±0.01 Non-W/Z leptons 1.0±0.9 0.04±0.01 Z/γ∗ 1.6±0.2 1.1±0.8 WV 0.44±0.02 0.15±0.01 tt signal 18.0±0.3 6.4±0.2 Total 22.0±0.9 7.9±0.8 Observed data 24 7
where N is the total number of dilepton events observed in data, NB the number of estimated
background events, ε the selection efficiency,Athe acceptance, andLthe integrated luminosity. Table 3 gives the total number of events observed in data, together with the total number of signal and background events expected from simulation or estimated from data, after the full set of selection criteria. The total detector, trigger, and reconstruction efficiency is estimated from data to be ε=0.55±0.02 (0.57±0.04) in the e±µ∓(µ±µ∓) channel. Using the definitions
above, the yields from Table 3, and the systematic uncertainties from Table 4, the measured fiducial cross section for tt production is
σfid=41±10 (stat)±2 (syst)±1 (lumi) pb
in the e±µ∓channel and
σfid=22±11 (stat)±4 (syst)±1 (lumi) pb
in the µ±µ∓channel.
The acceptance, as estimated from MC simulation, is found to beA =0.53±0.01 (0.37±0.01) in the e±µ∓ (µ±µ∓) channel. The statistical uncertainty (from MC simulation) is included in
Table 4: Summary of the individual contributions to the systematic uncertainty in the σtt mea-surements for the dilepton channels. The relative uncertainties ∆σtt/σtt(in %), as well as ab-solute uncertainties in σtt,∆σtt(in pb), are presented. The statistical and total uncertainties are also given, where the latter are the quadrature sum of the statistical and systematic uncertain-ties.
e±µ∓ µ±µ∓
Source ∆σtt/σtt(%) ∆σtt(pb) ∆σtt/σtt(%) ∆σtt(pb)
Electron efficiency 1.4 1.0 — —
Muon efficiency 3.0 2.3 6.1 3.6
Jet energy scale 1.3 1.0 1.3 0.7
Jet energy resolution <0.1 <0.1 <0.1 <0.1
Missing transverse momentum — — 0.7 0.4
µR, µFscales of tt signal (PS) 1.2 0.9 1.7 1.0
µR, µFscales of tt signal (ME) 0.2 0.1 1.1 0.6
Hadronization model of tt signal 1.2 0.9 5.2 3.1
PDF 0.5 0.4 0.4 0.2 MC sample size 1.4 1.1 2.4 1.4 tW background 1.4 1.1 1.6 0.9 WV background 0.7 0.5 0.9 0.5 Z/γ∗background 2.7 2.1 15 9.1 Non-W/Z background 2.5 1.9 0.7 0.4
Total systematic uncertainty
5.8 4.4 18 11
(w/o integrated luminosity)
Integrated luminosity 2.3 1.8 2.3 1.4
Statistical uncertainty 25 19 48 29
Total uncertainty 25 19 52 31
the uncertainty inA. By extrapolating to the full phase space, the inclusive tt cross section is measured to be
σtt=77±19 (stat)±4 (syst)±2 (lumi) pb
in the e±µ∓channel and
σtt=59±29 (stat)±11 (syst)±1 (lumi) pb
in the µ±µ∓ channel. Table 4 summarizes the relative and absolute statistical and systematic
uncertainties from different sources contributing to σtt. The separate total systematic uncer-tainty without the unceruncer-tainty in the integrated luminosity, the part attributed to the integrated luminosity, and the statistical contribution are added in quadrature to obtain the total uncer-tainty. The cross sections, measured with a relative uncertainty of 25 and 52%, are in agreement with the SM prediction (Eq. (1)) within the uncertainties in the measurements.
8.3 Combination
The three individual σttmeasurements are combined using the BLUE method [51, 52] to deter-mine an overall tt cross section. All systematic uncertainties are considered as fully correlated across all channels, with the following exceptions: the uncertainty associated with the finite event size of the simulated samples is taken as uncorrelated; the electron identification is not
15
relevant for the µµ channel; and the b tagging and QCD multijet background uncertainties are only considered for the`+jets channel. In the`+jets channel, the WV and Z/γ∗ backgrounds are not considered separately but as part of the “Other backgrounds” component, which is dominated by tW events. The uncertainty associated with this category is therefore treated as fully correlated with the tW uncertainty in the dileptonic channels and uncorrelated with the WV and Z/γ∗uncertainties.
The combined inclusive tt cross section is measured to be:
σtt=69.5±6.1 (stat)±5.6 (syst)±1.6 (lumi) pb=69.5±8.4 (total) pb,
where the total uncertainty is the sum in quadrature of the individual uncertainties. The weights of the individual measurements, to be understood in the sense of Ref. [52], are 81.8% for`+jets, 13.5% for e±µ∓, and 4.7% for µ±µ∓channels.
The combined result is found to be robust by performing an iterative variant of the BLUE method [53] and varying some assumptions on the correlations of different combinations of systematic uncertainties. Also, the post-fit correlations between the nuisance parameters in the
`+jets channel have been checked and found to have negligible impact.
Figure 5 presents a summary of CMS measurements [5, 6, 9, 10] of σtt in pp collisions at dif-ferent √s in the `+jets and dilepton channels, compared to the NNLO+NNLL prediction us-ing the NNPDF3.0 PDF set with αs(MZ) = 0.118 and mtop = 172.5 GeV. In the inset, the
results from this analysis at √s = 5.02 TeV are also compared to the predictions from the MMHT14 [54], CT14 [55], and ABMP16 [56] PDF sets, with the latter using αs(MZ) = 0.115
and mtop = 170.4 GeV. Theoretical predictions using different PDF sets have comparable
val-ues and uncertainties, once consistent valval-ues of αsand mtopare associated with the respective
PDF set.
9
QCD analysis
To illustrate the impact of the σtt measurements at √s = 5.02 TeV on the knowledge of the proton PDFs, the results are used in a QCD analysis at NNLO, together with the combined measurements of neutral- and charged-current cross sections for deep inelastic electron- and positron-proton scattering (DIS) at HERA [57], and the CMS measurement [58] of the muon charge asymmetry in W boson production at√s=8 TeV. The latter data set is used in order to improve the constraint on the light-quark distributions.
Version 2.0.0 ofXFITTER[59, 60], the open-source QCD-analysis framework for PDF determina-tion, is employed, with the partons evolved using the Dokshitzer–Gribov–Lipatov–Altarelli– Parisi equations [61–66] at NNLO, as implemented in theQCDNUM17-01/13 program [67]. The treatment and the choices for the central values and variations of the c and b quark masses, the strong coupling, and the strange-quark content fraction of the proton follow that of earlier CMS analyses, e.g., Ref. [58]. The µR, µFscales are set to the four-momentum transfer in the case of
the DIS data, the W boson mass for the muon charge asymmetry results, and the top quark mass in the case of σtt.
The systematic uncertainties in all three measurements of σttand their correlations are treated the same way as in the combination described in Section 8.3. The theoretical predictions for
σttare obtained at NNLO using theHATHORcalculation [68], assuming mtop=172.5 GeV. The
bin-to-bin correlations of the experimental uncertainties in the muon charge asymmetry and DIS measurements are taken into account. The theoretical predictions for the muon charge asymmetry are obtained as described in Ref. [58].
(TeV)
s
2
4
6
8
10
12
14
cross section (pb)t
Inclusive t
10
210
310
CMS
) -1 /l+jets 5.02 TeV (L = 27.4 pb µ µ / µ e ) -1 7 TeV (L = 5 fb µ e ) -1 l+jets 7 TeV (L = 2.3 fb ) -1 8 TeV (L = 19.7 fb µ e ) -1 l+jets 8 TeV (L = 19.6 fb ) -1 13 TeV (L = 2.2 fb µ e ) -1 l+jets 13 TeV (L = 2.2 fb NNLO+NNLL PRL 110 (2013) 252004 (TeV) s5.02
40
60
80
NNPDF3.0 MMHT14 CT14 ABMP16* µ µ / µ e l+jets /l+jets µ µ / µ eFigure 5: Inclusive σtt in pp collisions as a function of the center-of-mass energy; previous CMS measurements at√s = 7, 8 [5, 6], and 13 [9, 10] TeV in the separate`+jets and dilepton channels are displayed, along with the combined measurement at 5.02 TeV from this analysis. The NNLO+NNLL theoretical prediction [34] using the NNPDF3.0 [14] PDF set with αs(MZ) =
0.118 and mtop = 172.5 GeV is shown in the main plot. In the inset, additional predictions at √
s = 5.02 TeV using the MMHT14 [54], CT14 [55], and ABMP16 [56] PDF sets, the latter with
αs(MZ) =0.115 and mtop= 170.4 GeV, are compared, along with the NNPDF3.0 prediction, to
the individual and combined results from this analysis. The vertical bars and bands represent the total uncertainties in the data and in the predictions, respectively.
The procedure for the determination of the PDFs follows the approach used in the QCD ana-lysis of Ref. [58] and results in a 14-parameter fit. The parametrized PDFs are the gluon dis-tribution, xg, the valence quark distributions, xuv, xdv, and the u-type and d-type antiquark
distributions, xU, xD. The relations xU =xu and xD= xd+xs are assumed at the initial scale of the QCD evolution Q20 =1.9 GeV2. At this scale, the parametrizations are of the form:
xg(x) =AgxBg(1−x)Cg(1+Dgx), (4) xuv(x) =Auvx Buv(1−x)Cuv (1+D uvx+Euvx 2), (5) xdv(x) =Advx Bdv (1−x)Cdv, (6) xU(x) =AUxBU(1−x)CU(1+E Ux2), (7) xD(x) =ADxBD(1−x)CD. (8)
The normalization parameters Auv, Adv, and Agare determined by the QCD sum rules, the B parameters are responsible for the small-x behavior of the PDFs, and the C parameters describe the shape of the distribution as x →1. Additional constraints BU = BDand AU = AD(1− fs)
17
Table 5: Partial χ2per number of data points, ndp, and the global χ2 per degrees of freedom,
ndof, as obtained in the QCD analysis of DIS data, the CMS muon charge asymmetry
measure-ments, and the σtt results at √s = 5.02 TeV from this analysis. For the HERA measurements, the energy of the proton beam (Ep) is listed for each data set, with the electron/positron energy
of 27.5 GeV. The correlated part of the global χ2value is also given.
Data sets Partial χ2/n
dp
HERA neutral current, e+p, Ep =920 GeV 449/377
HERA neutral current, e+p, Ep =820 GeV 71/70
HERA neutral current, e+p, Ep =575 GeV 224/254
HERA neutral current, e+p, E
p =460 GeV 218/204
HERA neutral current, e−p, Ep =920 GeV 218/159
HERA charged current, e+p, Ep =920 GeV 43/39
HERA charged current, e−p, Ep =920 GeV 53/42
CMS W±muon charge asymmetry 2.4/11
CMS σtt, e±µ∓, 5.02 TeV 1.03/1
CMS σtt, µ±µ∓, 5.02 TeV 0.01/1
CMS σtt,`+jets, 5.02 TeV 0.70/1
Correlated χ2 100
Global χ2/ndof 1387/1145
in Ref. [69], consistent with the value obtained using the CMS measurements of W+c produc-tion [70]. Using the measured values for σtt allows the addition of a new free parameter, Duv, in Eq. (5), as compared to the analysis in Ref. [58].
The predicted and measured cross sections for all the data sets, together with their correspond-ing uncertainties, are used to build a global χ2, minimized to determine the PDF parame-ters [59, 60]. The results of the fit are given in Table 5. The quality of the overall fit can be judged based on the global χ2 divided by the number of degrees of freedom, ndof. For each
data set included in the fit, the partial χ2 divided by the number of the measurements (data points), ndp, is also provided. The correlated part of χ2, also given in Table 5, quantifies the
influence of the correlated systematic uncertainties in the fit. The global and partial χ2values
indicate a general agreement among all the data sets. The somewhat high χ2/n
dpvalues for the
combined DIS data are very similar to those observed in Ref. [57], where they are investigated in detail.
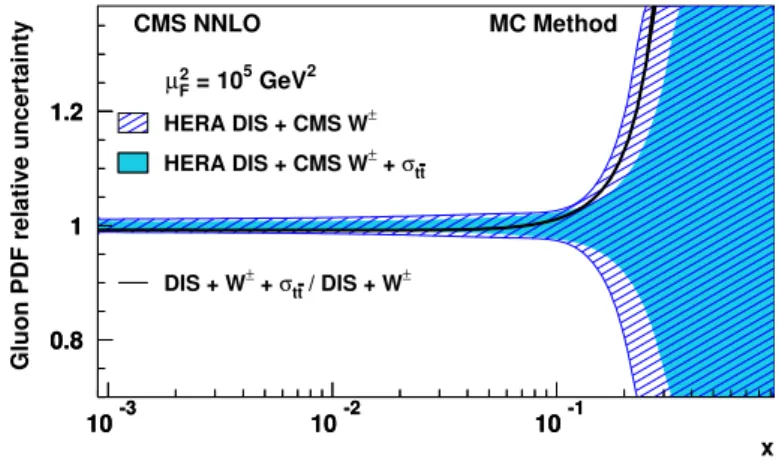
The experimental uncertainties in the measurements are propagated to the extracted QCD fit parameters using the MC method [71, 72]. In this method, 400 replicas of pseudo-data are generated, with measured values for σtt allowed to vary within the statistical and systematic uncertainties. For each of them, the PDF fit is performed and the uncertainty is estimated as the RMS around the central value. In Fig. 6, the ratio and the relative uncertainties in the gluon distributions, as obtained in the QCD analyses with and without the measured values for σtt, are shown. A moderate reduction of the uncertainty in the gluon distribution at x & 0.1 is observed, once the measured values for σtt are included in the fit. The uncertainties in the valence quark distributions remain unaffected. All changes in the central values of the PDFs are well within the fit uncertainties.
Possible effects from varying the model input parameters and the initial PDF parametrization are investigated in the same way as in the similar analysis of Ref. [58]. The two cases when the measured values for σttare included or excluded from the fit are considered, resulting in the same associated model and parametrization uncertainties.
In conclusion, the σtt measurements at √s = 5.02 TeV provide improved uncertainties in the gluon PDF at high x, though the impact is small, owing to the large experimental uncertainties.
µF2 = 105 GeV2 HERA DIS + CMS W± + σ tt -HERA DIS + CMS W± DIS + W± + σ tt / DIS + W ± -x
Gluon PDF relative uncertainty
CMS NNLO MC Method 0.8 1 1.2 10-3 10-2 10-1 0.8 1 1.2 10-3 10-2 10-1
Figure 6: The relative uncertainties in the gluon distribution function of the proton as a function of x at µ2
F=105GeV2from a QCD analysis using the HERA DIS and CMS muon charge
asym-metry measurements (hatched area), and also including the CMS σttresults at √s = 5.02 TeV (solid area). The relative uncertainties are found after the two gluon distributions have been normalized to unity. The solid line shows the ratio of the gluon distribution function found from the fit with the CMS σttmeasurements included to that found without.
10
Summary
The first measurement of the top quark pair (tt) production cross section in pp collisions at
√
s = 5.02 TeV is presented for events with one or two leptons and at least two jets, using a data sample collected by the CMS experiment, corresponding to an integrated luminosity of 27.4±0.6 pb−1. The final measurement is obtained from the combination of the measurements in the individual channels. The result is σtt = 69.5±6.1 (stat)±5.6 (syst)±1.6 (lumi) pb, with a total relative uncertainty of 12%, which is consistent with the standard model prediction. The impact of the measured tt cross section in the determination of the parton distribution functions of the proton is studied in a quantum chromodynamics analysis at next-to-next-to-leading order. A moderate decrease of the uncertainty in the gluon distribution is observed at high values of x, the fractional momentum of the proton carried by the gluon.
Acknowledgments
We congratulate our colleagues in the CERN accelerator departments for the excellent perfor-mance of the LHC and thank the technical and administrative staffs at CERN and at other CMS institutes for their contributions to the success of the CMS effort. In addition, we grate-fully acknowledge the computing centers and personnel of the Worldwide LHC Computing
References 19
Grid for delivering so effectively the computing infrastructure essential to our analyses. Fi-nally, we acknowledge the enduring support for the construction and operation of the LHC and the CMS detector provided by the following funding agencies: BMWFW and FWF (Aus-tria); FNRS and FWO (Belgium); CNPq, CAPES, FAPERJ, and FAPESP (Brazil); MES (Bulgaria); CERN; CAS, MoST, and NSFC (China); COLCIENCIAS (Colombia); MSES and CSF (Croatia); RPF (Cyprus); SENESCYT (Ecuador); MoER, ERC IUT, and ERDF (Estonia); Academy of Fin-land, MEC, and HIP (Finland); CEA and CNRS/IN2P3 (France); BMBF, DFG, and HGF (Ger-many); GSRT (Greece); OTKA and NIH (Hungary); DAE and DST (India); IPM (Iran); SFI (Ireland); INFN (Italy); MSIP and NRF (Republic of Korea); LAS (Lithuania); MOE and UM (Malaysia); BUAP, CINVESTAV, CONACYT, LNS, SEP, and UASLP-FAI (Mexico); MBIE (New Zealand); PAEC (Pakistan); MSHE and NSC (Poland); FCT (Portugal); JINR (Dubna); MON, RosAtom, RAS, RFBR and RAEP (Russia); MESTD (Serbia); SEIDI, CPAN, PCTI and FEDER (Spain); Swiss Funding Agencies (Switzerland); MST (Taipei); ThEPCenter, IPST, STAR, and NSTDA (Thailand); TUBITAK and TAEK (Turkey); NASU and SFFR (Ukraine); STFC (United Kingdom); DOE and NSF (USA).
Individuals have received support from the Marie-Curie program and the European Research Council and Horizon 2020 Grant, contract No. 675440 (European Union); the Leventis Foun-dation; the A. P. Sloan FounFoun-dation; the Alexander von Humboldt FounFoun-dation; the Belgian Fed-eral Science Policy Office; the Fonds pour la Formation `a la Recherche dans l’Industrie et dans l’Agriculture (FRIA-Belgium); the Agentschap voor Innovatie door Wetenschap en Technologie (IWT-Belgium); the Ministry of Education, Youth and Sports (MEYS) of the Czech Republic; the Council of Science and Industrial Research, India; the HOMING PLUS program of the Foun-dation for Polish Science, cofinanced from European Union, Regional Development Fund, the Mobility Plus program of the Ministry of Science and Higher Education, the National Science Center (Poland), contracts Harmonia 2014/14/M/ST2/00428, Opus 2014/13/B/ST2/02543, 2014/15/B/ST2/03998, and 2015/19/B/ST2/02861, Sonata-bis 2012/07/E/ST2/01406; the National Priorities Research Program by Qatar National Research Fund; the Programa Severo Ochoa del Principado de Asturias; the Thalis and Aristeia programs cofinanced by EU-ESF and the Greek NSRF; the Rachadapisek Sompot Fund for Postdoctoral Fellowship, Chulalongkorn University and the Chulalongkorn Academic into Its 2nd Century Project Advancement Project (Thailand); the Welch Foundation, contract C-1845; and the Weston Havens Foundation (USA).
References
[1] CMS Collaboration, “Determination of the top-quark pole mass and strong coupling constant from the tt production cross section in pp collisions at√s= 7 TeV”, Phys. Lett. B 728(2013) 496, doi:10.1016/j.physletb.2013.12.009, arXiv:1307.1907. [Erratum: doi:10.1016/j.physletb.2014.08.040].
[2] CMS Collaboration, “Measurement of double-differential cross sections for top quark pair production in pp collisions at√s=8 TeV and impact on parton distribution functions”, Eur. Phys. J. C 77 (2017) 459, doi:10.1140/epjc/s10052-017-4984-5, arXiv:1703.01630.
[3] ATLAS Collaboration, “Measurement of the top quark pair production cross-section with ATLAS in the single lepton channel”, Phys. Lett. B 711 (2012) 244,
doi:10.1016/j.physletb.2012.03.083, arXiv:1201.1889.
[4] ATLAS Collaboration, “Measurement of the t¯t production cross-section using eµ events with b-tagged jets in pp collisions at√s =7 and 8 TeV with the ATLAS detector”, Eur.
Phys. J. C 74 (2014) 3109, doi:10.1140/epjc/s10052-014-3109-7, arXiv:1406.5375.
[5] CMS Collaboration, “Measurement of the tt production cross section in the eµ channel in proton-proton collisions at√s=7 and 8 TeV”, JHEP 08 (2016) 029,
doi:10.1007/JHEP08(2016)029, arXiv:1603.02303.
[6] CMS Collaboration, “Measurements of the tt production cross section in lepton+jets final states in pp collisions at 8 TeV and ratio of 8 to 7 TeV cross sections”, Eur. Phys. J. C 77 (2017) 15, doi:10.1140/epjc/s10052-016-4504-z, arXiv:1602.09024.
[7] ATLAS Collaboration, “Measurement of the t¯t production cross-section using eµ events with b-tagged jets in pp collisions at√s = 13 TeV with the ATLAS detector”, Phys. Lett. B 761(2016) 136, doi:10.1016/j.physletb.2016.08.019, arXiv:1606.02699. [8] CMS Collaboration, “Measurement of the top quark pair production cross section in
proton-proton collisions at√s=13 TeV”, Phys. Rev. Lett. 116 (2016) 052002, doi:10.1103/PhysRevLett.116.052002, arXiv:1510.05302.
[9] CMS Collaboration, “Measurement of the t¯t production cross section using events in the eµ final state in pp collisions at√s=13 TeV”, Eur. Phys. J. C 77 (2017) 172,
doi:10.1140/epjc/s10052-017-4718-8, arXiv:1611.04040.
[10] CMS Collaboration, “Measurement of the tt production cross section using events with one lepton and at least one jet in pp collisions at√s =13 TeV”, JHEP 09 (2017) 051, doi:10.1007/JHEP09(2017)051, arXiv:1701.06228.
[11] S. Frixione, P. Nason, and C. Oleari, “Matching NLO QCD computations with parton shower simulations: the POWHEG method”, JHEP 11 (2007) 070,
doi:10.1088/1126-6708/2007/11/070, arXiv:0709.2092.
[12] S. Alioli, P. Nason, C. Oleari, and E. Re, “A general framework for implementing NLO calculations in shower Monte Carlo programs: the POWHEG BOX”, JHEP 06 (2010) 043, doi:10.1007/JHEP06(2010)043, arXiv:1002.2581.
[13] S. Frixione, P. Nason, and G. Ridolfi, “A positive-weight next-to-leading-order Monte Carlo for heavy flavour hadroproduction”, JHEP 0709 (2007) 126,
doi:10.1088/1126-6708/2007/09/126.
[14] NNPDF Collaboration, “Parton distributions for the LHC Run II”, JHEP 04 (2015) 040, doi:10.1007/JHEP04(2015)040, arXiv:1410.8849.
[15] D. d’Enterria, K. Krajczar, and H. Paukkunen, “Top-quark production in proton-nucleus and nucleus-nucleus collisions at LHC energies and beyond”, Phys. Lett. B 746 (2015) 64, doi:10.1016/j.physletb.2015.04.044, arXiv:1501.05879.
[16] CMS Collaboration, “Projections for heavy ions with HL-LHC”, CMS Physics Analysis Summary CMS-PAS-FTR-13-025, 2013.
[17] CMS Collaboration, “Observation of top quark production in proton-nucleus collisions”, Phys. Rev. Lett. 119 (2017) 242001, doi:10.1103/PhysRevLett.119.242001,
arXiv:1709.07411.
[18] CMS Collaboration, “The CMS trigger system”, JINST 12 (2017) P01020, doi:10.1088/1748-0221/12/01/P01020, arXiv:1609.02366.
References 21
[19] CMS Collaboration, “The CMS experiment at the CERN LHC”, JINST 3 (2008) S08004, doi:10.1088/1748-0221/3/08/S08004.
[20] CMS Collaboration, “CMS luminosity calibration for the pp reference run at√ s =5.02 TeV”, CMS Physics Analysis Summary CMS-PAS-LUM-16-001, 2016. [21] T. Sj ¨ostrand, S. Mrenna, and P. Skands, “PYTHIA6.4 physics and manual”, JHEP 05
(2006) 026, doi:10.1088/1126-6708/2006/05/026, arXiv:hep-ph/0603175. [22] T. Sj ¨ostrand et al., “An introduction toPYTHIA8.2”, Comput. Phys. Commun. 191 (2015)
159, doi:10.1016/j.cpc.2015.01.024, arXiv:1410.3012.
[23] CMS Collaboration, “Event generator tunes obtained from underlying event and multiparton scattering measurements”, Eur. Phys. J. C 76 (2016) 155,
doi:10.1140/epjc/s10052-016-3988-x, arXiv:1512.00815.
[24] P. Skands, S. Carrazza, and J. Rojo, “Tuning PYTHIA 8.1: the Monash 2013 tune”, Eur. Phys. J. C 74 (2014) 3024, doi:10.1140/epjc/s10052-014-3024-y,
arXiv:1404.5630.
[25] J. Alwall et al., “The automated computation of tree-level and next-to-leading order differential cross sections, and their matching to parton shower simulations”, JHEP 07 (2014) 079, doi:10.1007/JHEP07(2014)079, arXiv:1405.0301.
[26] R. Frederix and S. Frixione, “Merging meets matching in MC@NLO”, JHEP 12 (2012) 061, doi:10.1007/JHEP12(2012)061, arXiv:1209.6215.
[27] K. Melnikov and F. Petriello, “Electroweak gauge boson production at hadron colliders through O(α2s)”, Phys. Rev. D 74 (2006) 114017, doi:10.1103/PhysRevD.74.114017,
arXiv:hep-ph/0609070.
[28] S. Alioli, P. Nason, C. Oleari, and E. Re, “NLO single-top production matched with shower in POWHEG: s- and t-channel contributions”, JHEP 09 (2009) 111,
doi:10.1088/1126-6708/2009/09/111, arXiv:0907.4076. [Erratum: doi:10.1007/JHEP02(2010)011].
[29] E. Re, “Single-top Wt-channel production matched with parton showers using the POWHEG method”, Eur. Phys. J. C 71 (2011) 1547,
doi:10.1140/epjc/s10052-011-1547-z, arXiv:1009.2450.
[30] N. Kidonakis, “Top quark production”, in Proceedings, Helmholtz International Summer School on Physics of Heavy Quarks and Hadrons (HQ 2013), p. 139. Verlag Deutsches Elektronen-Synchrotron, Hamburg, 2014. arXiv:1311.0283.
doi:10.3204/DESY-PROC-2013-03/Kidonakis.
[31] J. M. Campbell and R. K. Ellis, “MCFMfor the Tevatron and the LHC”, Nucl. Phys. Proc. Suppl. 205–206 (2010) 10, doi:10.1016/j.nuclphysbps.2010.08.011,
arXiv:1007.3492.
[32] GEANT4 Collaboration, “GEANT4 — a simulation toolkit”, Nucl. Instrum. Meth. A 506 (2003) 250, doi:10.1016/S0168-9002(03)01368-8.
[33] M. Czakon and A. Mitov, “TOP++: a program for the calculation of the top-pair cross-section at hadron colliders”, Comput. Phys. Commun. 185 (2014) 2930, doi:10.1016/j.cpc.2014.06.021, arXiv:1112.5675.