i
THE OUTSIDER'S METHOD, AN OUTLIER
DETECTION SYSTEM AS LAWYER OF QUALITY
CONTROL TOOL AT CENTRAL BALANCE SHEET
DATA OFFICE
ANTONIO LORENTE SALMERÓN
Subtitle
PROJECT presented as requirement for obtaining the
1
NOVA Information Management School
Instituto Superior de Estatística e Gestão de Informação
Universidade Nova de Lisboa
THE OUTSIDER'S METHOD, AN OUTLIER DETECTION SYSTEM AS
LAWYER OF QUALITY CONTROL TOOL AT CENTRAL BALANCE SHEET
DATA OFFICE
by
ANTONIO LORENTE SALMERÓN
THESIS presented as requirement for obtaining the Master’s degree in Statistics and Information Management
3
DEDICATION
To my beloved Mother (“Puchum”) and Wife (Vicky) and to my amazing sons Antonio, Carlos and Pablo you are the meaning of my life.
5
ABSTRACT
Handling large amounts of granular data of non-financial corporations’ balance sheet and profit and loss statement to fulfil the assigned functions of the Central Balance Sheet Data Office (CBSDO) requires the design and implementation of various layers of quality control that combined with the review of expert analysts to ensure databases with a statistical quality at the expected height of the Statistics Department of an institution such as Banco de España.
Recently, under the umbrella of the quality control systems of the CBSDO, a new outlier detection system has been designed and implemented, the “Outsider’s method”, through which those
observations that deviate considerably from the behaviour of companies regarding sector clustering, according to NACE classification, and size, will be eliminated from database and will maintain those that still have a behaviour that is far from standard but consistent with the reality of mentioned Non-financial corporations.
The purpose of this project is to explain the methodology of this new system, obtain results for different extractions periodically established over several years, analyse these results, and finally test the system's validity by comparing it with other detection methods traditionally used by other statistical entities.
KEYWORDS
Non-financial corporations; CBSDO; outlier; quality control, clustering, validate JEL Classification: C40, C55, C58
7
INDEX
1. Abstract ... 5
2. List of Abbreviations and Acronyms ... 9
3. Introduction ... 10
3.1. Background and problem identification ... 10
3.1.1. Background: ... 10
3.1.2. Problem Identification ... 11
3.2. Study Objectives ... 13
4. Study relevance and importance ... 14
5. Methodology ... 15
5.1. Definition of Node ... 15
5.2. Variables to analyze ... 16
6. “Outsider’s method” system selected by CBSDO to detect outliers at cbb database18 6.1. “phi” Function... 18
6.2. Outlier definition ... 19
6.3. Extractions ... 20
6.4. SAS program ... 21
6.5. Results of SAS program. ... 22
6.6. Outlier key Vs Trace of outlier key. ... 25
7. Analysis of results obtained by the “outsider’s method”. The outliers report. ... 27
8. An introduction to the second part of the thesis, methods to compare and validate the results obtained by the “outsider’s method”. ... 39
9. First method: (p3 – p97) ... 40
10 Second method: interquartile range (IQR) ... 42
11. Third method: lowest and highest observations ... 46
12. Combination of the three validating methods ... 48
13. Method approved as a quality control tool for detecting outliers of CBB’s database50 14. Conclusions ... 59
15. Bibliography ... 61
16. Annexes ... 63
16.1. Benchmark (2.009 – 2.017) ... 63
9
LIST OF ABBREVIATIONS AND ACRONYMS
BdE Banco de EspañaECB European Central Bank
SSM Single Supervisory Mechanism
NCBs National Central Banks
CBSDO Central Balance Sheet Data Office
CBSDO-Q Central Balance Sheet Data Office quarterly survey
CBSDO-A Central Balance Sheet Data Office annual survey
ECCBSO European Committee of Central Balance Sheet Data Offices
FSA WG Financial Statements Analysis Working Group
FCDB Financing Cost Data Base
INE National Statistical Institute (Instituto Nacional de Estadística de España)
MENF Multiplicador de Empresas No Financieras – product from Central Balance Sheet Data
Office that elevates the sample of non-financial corporations to the total population
BACH Bank for the Accounts of Companies Harmonised – database that contains aggregated
and harmonised information on the annual accounts of the non-financial corporations of selected European countries
RSE Sectoral database of Rates of non-financial corporations
10
INTRODUCTION
B
ACKGROUND AND PROBLEM IDENTIFICATION1.1.1. Background:
This project report will be carried out in the Banco de España, more specifically in the Central Balance Sheet Data Office (CBSDO) that belongs to the Statistics Department which in turn is part of the General Directorate of Economy, Statistics and Research
Banco de España is the national central bank, within the framework of the Single Supervisory Mechanism (SSM), the supervisor of the Spanish banking system along with the European Central Bank. Its activity is regulated by the Law of Autonomy of the Banco de España.
Banco de España is one of the members of the EUROSYSTEM that is the monetary authority of the euro area and comprises the European Central Bank (ECB) and the national central banks of the Member States whose currency is the euro. Its primary objective is to maintain price stability.
One of the main tasks entrusted to the General Directorate of Economy, Statistics and Research is Compiling, analysing and disseminating the statistics entrusted to the Banco de España.
Banco de España’s Central Balance Sheet Data Office is a service that analyses the economic and financial information voluntarily submitted by Spanish non-financial corporations, which improves the knowledge about these corporations, enables financial accounts for the Spanish economy to be drawn up, and which analyses corporate performance and the effects of monetary policy measures on corporate financing and results.
The European Committee of Central Balance-Sheet Data Offices (ECCBSO) is a consultative body created in 1987 by a group of European National Central Banks (NCBs) managing Central Balance Sheet Data Offices (CBSOs). Banco de España’s CBSDO is one of its members. The Committee has developed a database named Bank for Accounts of Companies Harmonized (BACH); Is a database containing harmonized annual accounts statistics of European non-financial enterprises. Hence, the database was conceived as a useful tool both for country comparisons and to analyse the structure and performances of the non-financial companies in Europe.
RSE database provides information for the comparative analysis of individual corporations with aggregates of non-financial corporations, enabling the corporation to be positioned in the cross-matching of sector of activity and size in which the corporation fits. The RSE database offers information on 29 significant ratios for economic and financial analysis of the aggregates of non-financial corporations obtained from the cross-matching of three characteristics: activity, size and country.
11
1.1.2. Problem Identification
To ensure the quality of CBSDO products, that they are constructed from micro data, it is necessary to implement several quality controls, one of them consist of eradicate those observations that that can distort aggregated information due to excessive specific weight in their respective samples and subsamples.
There are many definitions of outlier that can be found through the literature, for example, an outlier is generally considered to be a data point that is far outside the norm for a variable or population (e.g., Jarrell, 1994; Rasmussen, 1988; Stevens, 1984). Hawkins described an outlier as an observation that “deviates so much from other observations as to arouse suspicions that it was generated by a different mechanism” (Hawkins, 1980). Outliers have also been defined as values that are “dubious in the eyes of the researcher” (Dixon, 1950) and contaminants (Wainer, 1976).
As a result, they can potentially skew or bias any analysis performed on the dataset. It is therefore very important to detect and adequately deal with them.
Outliers can arise from several different mechanisms or causes. Anscombe (1960) sorts outliers into two major categories: those arising from errors in the data, the ones that we want to wipe out, and those arising from the inherent variability of the data, the ones that we are very interested in keep because they provide very relevant information about the behaviour of the population and can allow us to explain various phenomena, which without them would not be possible..
Not all outliers are illegitimate contaminants, and not all illegitimate scores show up as outliers (Barnett & Lewis, 1994).
It is therefore important to consider the range of causes that may be responsible for outliers in a given data set:
• Outliers from data errors. Outliers are often caused by human error, such as errors in data collection, recording, or entry.
• Outliers from sampling error. Another cause of outliers is sampling. It is possible that a few members of a sample were inadvertently drawn from a different population than the rest of the sample.
• Outliers from faulty distributional assumptions. Incorrect assumptions about the distribution of the data can also lead to the presence of suspected outliers (e.g., Iglewicz & Hoaglin, 1993)
• Outliers as legitimate cases sampled from the correct population. Finally, it is possible that an outlier can come from the population being sampled legitimately through random chance. It is important to note that sample size plays a role in the probability of outlying values.
Within a normally distributed population, it is more probable that a given data point will be drawn from the most densely concentrated area of the distribution, rather than one of the tails (Evans, 1999; Sachs, 1982). As a researcher casts a wider net and the data set becomes larger, the more the sample resembles the population from which it was drawn, and thus the likelihood of outlying values becomes greater.
12 The outliers should only be discarded when we are completely sure they were a result of an experimental or transcription error. Otherwise removing outliers may result in underestimated variance.
13
S
TUDYO
BJECTIVESJohn Tukey (1977) introduced several methods for exploratory data analysis, one of them was the Boxplot. The Boxplot is a graphical display where the outliers appear tagged. Two types of outliers are distinguished:
An observation “x” is declared an extreme outlier if lies outside of the interval (Q1-3*IQR, Q3+3*IQR). Notice that the center of the interval is (Q1+Q3)/2 and its radius is 3.5*IQR, where IQR=Q3-Q1, called the Interquartile Range, is a robust estimator of variability.
An observation x is declared a mild outlier is lies outside of the interval (Q1-1.5I*QR, Q3+1.5*IQR). The interval has a center at (Q1+Q3)/2 and its radius is 2*IQR.
The numbers 1.5 and 3 are chosen by comparison with a normal distribution.
Following Tukey’s theory, the two methods selected to validate the “outsider’s method” are the interquartile range method used by the European Central Bank and EUROSTAT or the exclusion of data below percentile 3 and over percentile 97 as in the Bank for the Accounts of Companies Harmonized – database that contains aggregated and harmonized information on the annual accounts of the non-financial corporations of selected European countries (BACH).
The purposes of this project are:
1. To explain the methodology of this new system of detecting outliers, the “outsider’s method”. 2. Obtain results for different extractions periodically established over several years (bases). 3. Analyse these results, by a regular report system. And finally,
4. Test the system's validity by comparing it with other more traditional detection methods and used by other statistical entities.
14
STUDY RELEVANCE AND IMPORTANCE
At present day, there are numerous sources of information, databases, press, internet, and they have become a source of inspiration for numerous studies, articles and reports.
Not all this information can be considered reliable, nor should it be used if its methodology is not previously known and its quality contrasted.
Banco de España’s CBSDO deals every year with more than eight hundred thousand balance sheets and profit and loss statement and we have complementary information voluntarily contributed by more than ten thousand non-financial companies, we also download from mercantile registrars and from companies’ websites annual reports, in order to check or solve doubts regarding their annual accounts. All this information is checked by expert analysts and by in-house developed programs that ensure the coherency and consistency of the data received.
Even with all this, to pursue the purpose of providing the service of the economic and financial information of Spanish non-financial corporations, it is required to implement quality control mechanisms, such us the revision by an expert analyst of certain parameters of the accounting and corporate information provided. But this is not enough, due to this huge amount of interconnected information it is necessary to include another type of quality control based on statistics theory to improve the quality of CBSDO databases.
One of the most cited definitions in the literature regarding what an outlier is, is stated by David Hawkins in his monographs on applied statistics and probability in 1980: "An outlier is an observation that deviates so much from other observations that it arouses the suspicion of having been generated by a different mechanism" (Hawkins, 1980)
Based on statistics theory on outliers, recently it has been developed a new lawyer of quality control named “outsider’s method” which it is intended to identify the most anomalous observations and, at the same time, their contribution, with respect to the node composed of the breakdown of sector and size, so that what is involved is to eliminate those observations that are really errors; while on the contrary, those observations will be maintained which, even when they deviate from the normal behaviour of their distribution, do correspond to a real and therefore explanatory behaviour of the reality of this phenomenon.
15
METHODOLOGY
All the micro data used in this report comes from Banco de España’s Central Balance Sheet Data Office (CBSDO). This data is obtained from two databases:
• The CBB database - created drawing on the annual accounts filed with the Mercantile Registers; Under the cooperation agreements signed with the Ministry of Justice and the Spanish Association of Property and Mercantile Registrars, Banco de España’ s Central Balance Sheet Data Office and the Mercantile Registries have been working together to facilitate the statistical use of the annual accounts that companies are legally required to file with the mercantile registry of the province in which their registered office is located.
• The CBA database - which compiles information voluntarily reported by corporations in a purpose-designed questionnaire.
Both databases are aggregated and integrated into a data source which, under the name of CBI, provides for the monitoring of aggregate results, with breakdowns by size and sector of activity of the Spanish non-financial corporations.
The use of this micro-data is strictly confidential and only can be used for statistical use.
D
EFINITION OFN
ODEIn order to classify and group the microdata of the CBA and CBB databases and, therefore, of the CBI aggregate, two sector and size cut variables are established, sector and size:
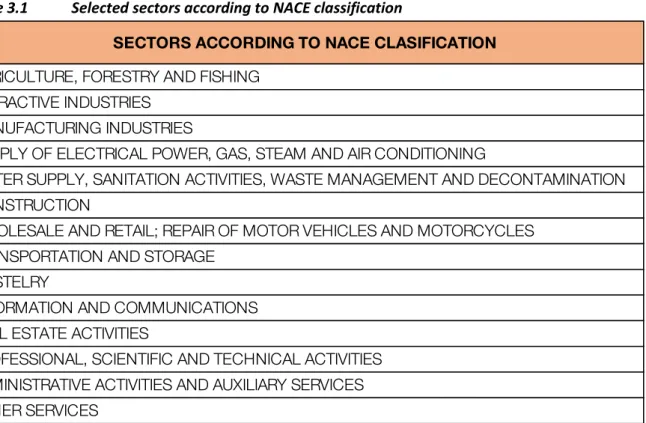
a) Sector: according to NACE classification, at CBSDO fourteen sectors are identified, namely: Table 3.1 Selected sectors according to NACE classification
SECTORS ACCORDING TO NACE CLASIFICATION
AGRICULTURE, FORESTRY AND FISHING EXTRACTIVE INDUSTRIES
MANUFACTURING INDUSTRIES
SUPPLY OF ELECTRICAL POWER, GAS, STEAM AND AIR CONDITIONING
WATER SUPPLY, SANITATION ACTIVITIES, WASTE MANAGEMENT AND DECONTAMINATION CONSTRUCTION
WHOLESALE AND RETAIL; REPAIR OF MOTOR VEHICLES AND MOTORCYCLES TRANSPORTATION AND STORAGE
HOSTELRY
INFORMATION AND COMMUNICATIONS REAL ESTATE ACTIVITIES
PROFESSIONAL, SCIENTIFIC AND TECHNICAL ACTIVITIES ADMINISTRATIVE ACTIVITIES AND AUXILIARY SERVICES OTHER SERVICES
16
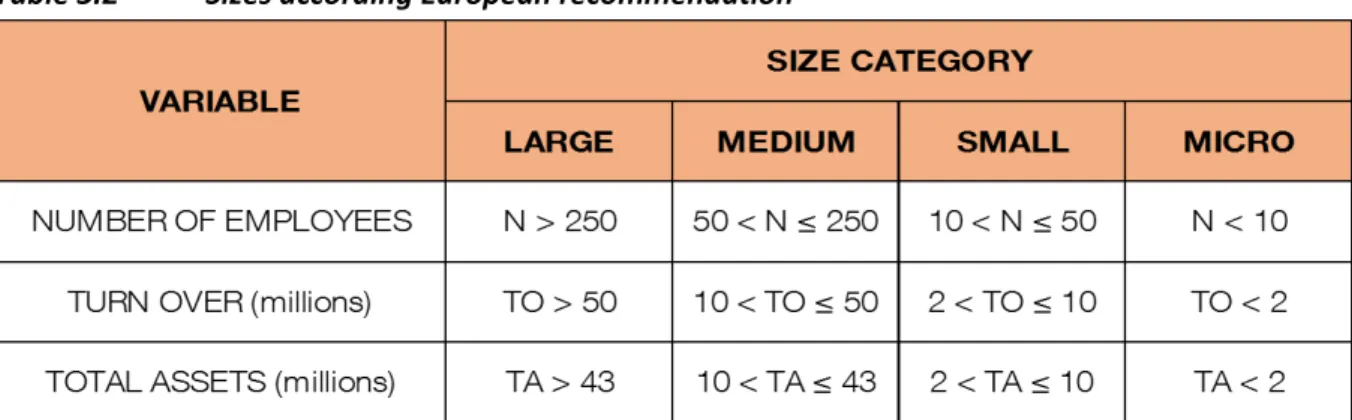
b) Size: according to the European recommendation four sizes can be identified:
i) Large (including public and dependent),
ii) Medium,
iii) Small (excluding micro) and
iv) Micro-enterprises
Table 3.2 Sizes according European recommendation
The node is defined as the crossing between sector and size, therefore for the project a total of 56 nodes will be identified.
V
ARIABLES TO ANALYZERSE is a database that compiles sectoral rates of non-financial corporations and provides information for the comparative analysis of individual corporations with aggregates of non-financial corporations, enabling the corporation to be positioned in the cross-matching of sector of activity and size in which the corporation fits.
The RSE database offers information on 29 significant ratios for economic and financial analysis of the aggregates of non-financial corporations obtained from the cross-matching of three characteristics: activity, size and country.
In this project seventeen ratios have been selected to analyse their distributions, search for anomalous observations try to identify and study them, the observations considered mistakes will be eliminated from database and those that still have a behaviour that is far from standard but consistent with the reality of mentioned will be maintained at database.
In the table 3.3 can be found a small methodological box with the name, abbreviations and content for the seventeen selected ratios (three debt ratios (E1, E2 and E3), four margin ratios (M1, M2, M3 and M4), three profitability (R1, R2 and R3), two of average periods (AVCP and AVPP) and five rates of variation (NA, FC, GOP, ONP and GVA).
17 Table 3.3 RSE selected ratios
18
“OUTSIDER’S METHOD” SYSTEM SELECTED BY CBSDO TO DETECT OUTLIERS AT
CBB DATABASE
The method to be applied for the CBB database in the Banco de España’s Central Balance Sheet Data Office is going to be named the "Outsider’s method" it will be applied to the nodes formed by the crossing between the fourteen sectors according to NACE classification and the four sizes of the European recommendation and for each of the seventeen RSE ratios selected.
“
PHI”
F
UNCTIONThe aforementioned method is basically that, for each observation and each ratio, the function φ is calculated as the difference between the value of the ratio for the node and its marginal value, that is, the value it would take excluding observation, see Box 4.1.
This magnitude expresses in some way the contribution of each observation to its node implicitly pondering its contribution to the numerator, its contribution to the denominator and the quantile in which it is found. The absolute value expresses its greater or lesser contribution and the sign if its inclusion increases or decreases the ratio
Box 4.1 φ Function (i) (ii) (iii) R for Ratio N for Numerator D for Denominator i for each company j for each node
By ordering the distribution in a decreasing way, to the left are the observations that increase the ratio significantly (positive tale), in the center the observations that are no relevant to be analysed, (zone zero) and to the right, those that make the ratio decrease significantly (negative tale), so that, in order to find atypical data, it is sufficient to study the tales to analyse the whole node.
19 Chart 4.1 The tales, and the zone cero, the φ function areas
O
UTLIERDEFINITION
(Barnett and Lewis, 1994) indicate that an outlying observation, or outlier, is one that appears to deviate markedly from other members of the sample in which it occurs.
(Johnson, 1992) defines an outlier as an observation in a data set which appears to be inconsistent with the remainder of that set of data.
In our project, the problem consists of finding those observations of the tales of the distribution that behave very differently from the observations closest to it, for which the empirical study, twenty observations have been considered sufficient.
First analysis shows the masking effect produced by an extreme outlier in the rest of the
measurements and the large differences in level observed between them. To solve the first problem the function φ was recalculated for the truncated distributions and for the second one a new function was defined in terms of differences.
For each tail it was compared with its regression line and the distance between the two curves for each observation was measured in order to detect outliers when comparing it with a threshold. It was observed that, although the curves were adjusted to a very low number of schemes, there was a great difference in levels, which would require different thresholds.
Given the difficulty of empirically setting a threshold for each ratio and node, parameterize the threshold by size, ratio, sector was replaced by number of observations of the node, the possibility of comparing each observation not with an external threshold, but with an appropriate statistic was evaluated so that it is the tail itself that determines the threshold.
The fact that what is relevant, is the comparison of the observation with the immediate ones to it, excludes any order statistic, which drive us to use the arithmetic mean. In addition, as several
20 outliers might be found is also discarded and for the same reason the comparison with the rest of the non-outlier’s part.
Fixed the statistic as the average of the tail and defined the outlier as that observation that exceeds more than ten times the average, it remains to solve the problem of excessive weight that may have in the same outlier, for what is proposed to increase the tails to fifty observations.
The results obtained were satisfactory for the tails containing all the observations, but insufficient for those nodes in which they do not have enough observations, these tails can only reach a very low number of elements.
To solve this problems, the arithmetic mean was replaced by the geometric mean and multiplied it by a corrective coefficient for the nodes with not enough observations, which are fixed, so that the initial condition for the most usual case of tails with a single outlier and twenty observations is equivalent to the previous one of ten times the average.
To simplify the calculations, logarithms are taken in the φ function and the “Ind” (Ind comes from index) function is defined as:
Box 4.2 “Ind” function (iv)
Therefore, those observations in which their "Ind" function are greater than one are defined as outliers.
E
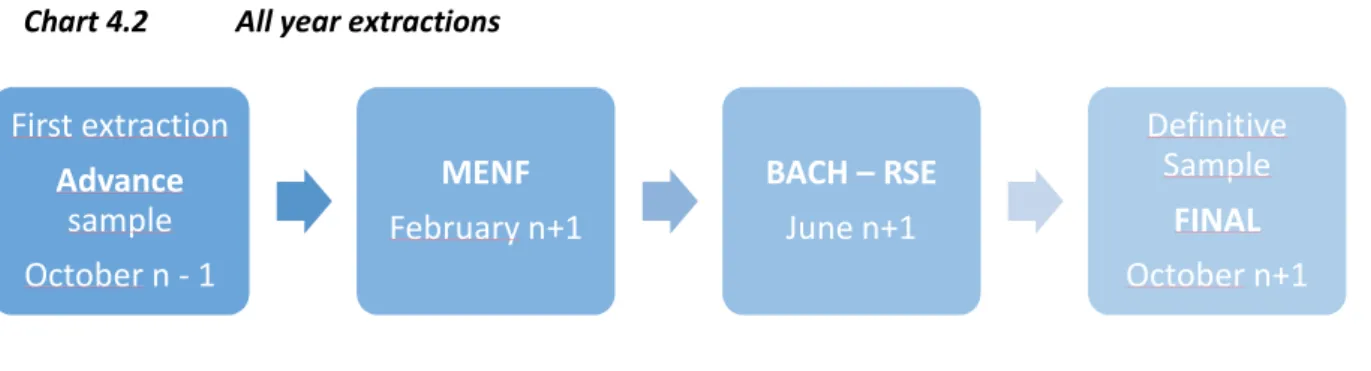
XTRACTIONSThe CBSDO carries out four extractions of information from its CBB database throughout the year (base), subjecting the outlier’s detection procedure to hundreds of thousands of companies before preparing their statistical products:
• October of the year n, to obtain the advance information used in the Annual Report, and the BACH and RSE databases, for the last available observation (n-1).
• February of the year n + 1, to obtain the aggregates that are used in the product MENF (Multiplier of Non-Financial Companies), which are the source of the Financial Accounts of the Spanish Economy, and of the National Accounts of Spain.
• June of the year n + 1, for updating the BACH and RSE databases.
• October of the year n + 1, for the definitive (final) sample of the data of year n-1 that are presented in the Annual Report.
21 1) the final sample of the previous year base (n-1), and
2) The advance sample of current year base (n).
Chart 4.2 All year extractions
Data collected from 2015 Advance sample to 2017 Advance sample, data of more than seven hundred thousand companies every year (base) distributed as table 4.1 shows:
Table 4.1 Number of companies in every extraction, from 2015 to 2017
SAS
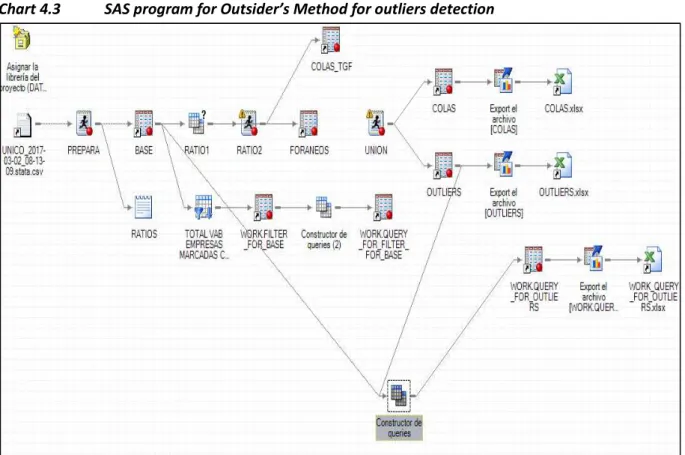
PROGRAMTo deal with this huge amount of data, a statistical tool is required, the program finally selected was SAS. The work flow process can be seen at chart 4.3, and follows the next steps:
YEAR SAMPLE Nº o f COMPANIES 2.015 AVANCE 317.116 2.015 MENF 594.130 2.015 BACH_RSE 668.230 2.015 FI NAL 737.410 2.016 AVANCE 418.423 2.016 MENF 547.491 2.016 BACH_RSE 659.903 2.016 FI NAL 753.458 2.017 AVANCE 564.914 First extraction Advance sample October n - 1 MENF February n+1 BACH – RSE June n+1 Definitive Sample FINAL October n+1
22 Chart 4.3 SAS program for Outsider’s Method for outliers detection
• Defining the paths by assigning the process libraries
• Import the data with the accounting information for the calculation of the numerators and denominators of the ratios
• The program that calculates the numerators and denominators of the ratios (program “prepara”)
• The query that calculates the ratios for every company. (“ratio1”)
• The program that calculate the function φ and calculate the nodes and order the observations in their respective node according to the descending value of φ. (“ratio2”)
• The program that calculates the function “Ind” and prepare the final output of the program that includes the companies that has Ind>1 which is the condition to be categorized as outlier.
R
ESULTS OFSAS
PROGRAM.
Once the SAS program is executed it is obtained two excel files as a raw information: 1) “Colas.xls”
Table 4.2 “Colas.xls” raw output
RATIO id NIF NOMB SUBTIPO NUM DEN PHI COLA NUMT DENT No loga
E1 2342188 B25704438 GRANJA SEROS 10, S.L.N 0 -53.35075 0.00015593 A1<+ 7.44037 -1622.42424 1 -8.76610873 E1 1964830 B36527513 MEIJOMIN SL N -220.93268 -24.26857 0.03001797 A3<+ 751.95362 -7465.71132 1 -3.50595895 E1 184314 A81795171 PETROLEUM OIL & GAS ESPAÑA S AN 114145 136420 0.0559543 B1>+ 420051.87 1488262 1 -2.88321991 E1 74582 A50021518 SAINT GOBAIN PLACO IBERICA, S.A.R 6174 253124 0.05284311 B1>- 420051.87 1488262 1 -2.94042793 E1 67809 A46022687 CAOBAR, S.A. R 10315.1289 16485.8077 0.03199965 B2>+ 41157.626 256014.035 1 -3.44203046
23 In this excel file it can be found:
a. Ratio in which the program detects an outlier
b. Id: code to identify the company (used to overtake confidentiality constrictions) c. NIF: Fiscal Id of the firm (hidden due to confidentiality reasons)
d. NOMB: Name of the firm (hidden due to confidentiality reasons) e. Any: year of the annual accounts from which the data are obtained f. NUM: Numerator of the Ratio
g. DEN: Denominator of the Ratio
h. NUMT: Numerator of the ratio for the whole node i. DENT: Denominator of the ratio for the whole node j. PHI: Value of the φ function
k. COLA: four-digit code that identify: (example: A1<-)
i. A: identify the sector: Agriculture, Forestry and Mining… ii. 1: identify the size: Large
iii. <-: identify the tale: (left + or right -) l. Loga: is the logarithm of the φ function
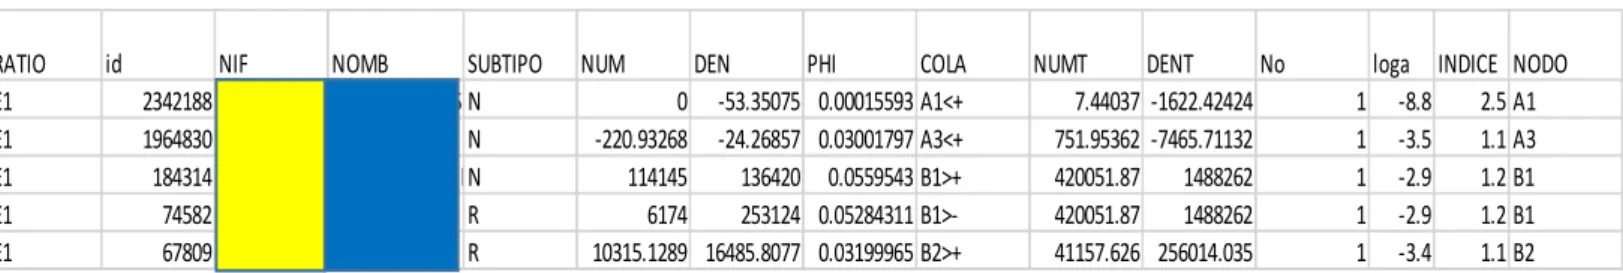
2) “Outlier.xls”
Table 4.3 “Outlier.xls” raw output
In this file it can be found the same information as in previous one, but including also: a) INDICE: Is the “Ind” function, all observations in which “Ind>1” will be considered
outliers.
RATIO id NIF NOMB SUBTIPO NUM DEN PHI COLA NUMT DENT No loga INDICE NODO
E1 2342188 B25704438 GRANJA SEROS 10, S.L.N 0 -53.35075 0.00015593 A1<+ 7.44037 -1622.42424 1 -8.8 2.5 A1
E1 1964830 B36527513 MEIJOMIN SL N -220.93268 -24.26857 0.03001797 A3<+ 751.95362 -7465.71132 1 -3.5 1.1 A3
E1 184314 A81795171 PETROLEUM OIL & GAS ESPAÑA S AN 114145 136420 0.0559543 B1>+ 420051.87 1488262 1 -2.9 1.2 B1 E1 74582 A50021518 SAINT GOBAIN PLACO IBERICA, S.A.R 6174 253124 0.05284311 B1>- 420051.87 1488262 1 -2.9 1.2 B1
25
O
UTLIER KEYV
ST
RACE OF OUTLIER KEY.
The results obtained are subjected to a stability control, to analyse the anomalous values in the different extractions and to study the evolution of the nodes to which they belong in successive bases.
With this objective, two keys have been designed:
• “Outlier” key: that takes value one for those companies in which in at least one of the ratios an anomalous observation was found, and zero, otherwise.
• Key "Trace of Outlier": value that shows the characterization and evolution of the company as an outlier throughout the four extractions of a base.
This trace allows to know if a company has been or is classified as an outlier in any of the extractions of data as well as to follow up on which of them has ceased to be, if it had lost that condition.
This key is relevant to assess the “outsider’s method”, as the number of observations in each of the four extraction is growing, approximately by one hundred thousand companies by extraction.
According to the design of this outliers detection system the purpose is to find those observations that deviates extraordinarily from the normal behaviour of their node and also contributes to explain the differences on the behaviour, so it is expected that most of the outliers detected in the first extraction (advance) should remain till last extraction (final). To check the outlier classification according to extraction it is defined the following table of possible values:
26 Table 4.4 Values of key trace of outlier
In the “MAP OF EXTRACTIONS” is coloured in blue, when an observation is classified as outlier and in white when it ceases to be.
As it can be deducted from the table, the number of outliers and the percentages of them, that remain as outlier since they have been marked with that condition, and the percentage of outliers that lose that condition seems to be very stable in the two bases.
On the other hand, the % of outliers that lose that condition but at the final extraction remain as outliers diminish by 6% in 2.016 base, the figures related to the observations that are considered outliers at MENF and FINAL extractions decrease from 45 in 2.015 to 7 in 2.016.
At the end the % of observation that at the final extraction are considered as outliers either because since they acquire the condition of outlier they do not lose it until the end or because even if they have lost it in some extraction they end up maintaining it in the final extraction is higher than 50%, as can be expected according to the design of the outsider’s outlier detection system.
ADVANCE MENF BACH_RSE FINAL
NO OUTLIER 0 ADVANCE 1 903 951 MENF 2 498 355 ADVANCE + MENF 3 331 582 BACH_RSE 4 365 274 ADVANCE + BACH_RSE 5 15 28 MENF + BACH_RSE 6 153 185
ADVANCE + MENF + BACH_RSE 7 123 289
FINAL 8 587 743
ADVANCE + FINAL 9 15 14
MENF + FINAL 10 222 33
BACH_RSE + FINAL 11 271 14
ADVANCE + MENF + FINAL 12 276 672
ADVANCE + BACH_RSE + FINAL 13 523 14
MENF + BACH_RSE + FINAL 15 89 393
ADVANCE + MENF + BACH_RSE + FINAL 16 824 771
TOTAL OUTLIERS 5197 5319
% OF OUTLIERS THAT REMAIN AS AOUTLIERS SINCE IT HAS BEEN MARKED WITH THAT CONDITION 34% 36%
% OF OUTLIERS THAT LOSE THAT CONDITION 66% 64%
% OF OUTLIERS THAT LOSE THAT CONDITION BUT AT THE FINAL EXTRACTION REMAIN AS OUTLIER 20% 14% DESCRIPTION KEY TRACE OF OUTLIER VALUE OF
THE KEY
MAP OF ESTRACTIONS KEY TRAZE OF OUTLIERS
27
ANALYSIS OF RESULTS OBTAINED BY THE “OUTSIDER’S METHOD”. THE
OUTLIERS REPORT.
To analyse the results obtained with the outsider’s method, after every extraction it is implemented an outlier regular report, which it is useful to be able to see from a higher perspective the
performance of the method. In this report it can be observed:
• Number of companies labelled as outliers in the extraction, this number always must necessarily match with the “Outlier key” and represent the total number of companies identified as outliers at CBB database.
• Company with the highest “Ind” function, accompanying the identification number of this one it is included the ratio affected and the sector and size to which this firm belongs.
• Selection of companies with more ratios labelled as outliers, more than 6 of the 17 ratios analysed marked as outliers. See table 4.5
Table 4.5 Companies with more than 6 ratios labelled as outliers
This is a very illustrative panel, as it gives the clue on those companies with many potential mistakes, those companies are checked afterwards by an expert analyst, in order to be sure, and to avoid including them in our CBB database, because they are not effectively
28 When the expert analyst find a company marked as outlier but its behaviour represents the reality of the firm, the mark of outlier of this company is immediately removed, and
therefore it is included again in our CBB database.
Also, we can find a heat map, from beige to red, all the outliers according to the value of the “Ind” function, from lower to higher value.
• Ratio with the highest number of outliers labelled
• Companies with the highest “Ind” in each ratio:
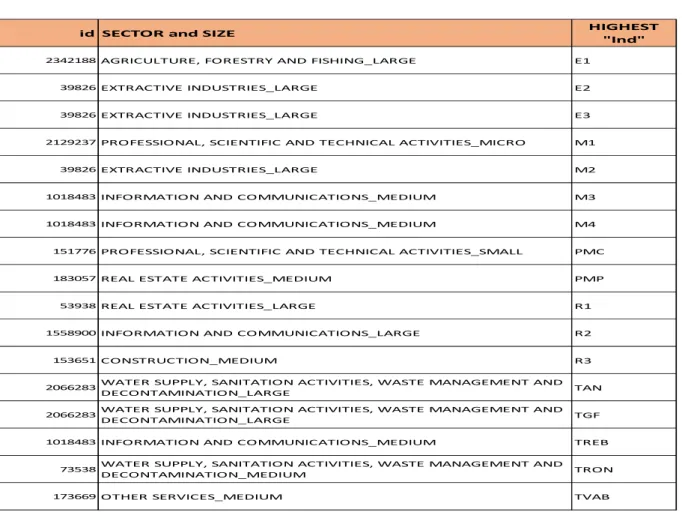
This panel helps to analyse the behaviour of sectors and ratios and their outliers’ patterns. As it can be seen in the table 4.6 some of the observations (companies) are repeated in several ratios as the highest value of the “Ind” function. That drive us to go again to the micro data and analyse the company in order to check by an expert analyst if this behaviour comes from a mistake in reporting or other similar reason or on the contrary, it is presenting the right development of the company, in that situation, the key of outlier is immediately removed.
Table 4.6 Companies the highest “Ind” in each ratio
id SECTOR and SIZE HIGHEST
"Ind"
2342188AGRICULTURE, FORESTRY AND FISHING_LARGE E1
39826EXTRACTIVE INDUSTRIES_LARGE E2
39826EXTRACTIVE INDUSTRIES_LARGE E3
2129237PROFESSIONAL, SCIENTIFIC AND TECHNICAL ACTIVITIES_MICRO M1
39826EXTRACTIVE INDUSTRIES_LARGE M2
1018483INFORMATION AND COMMUNICATIONS_MEDIUM M3
1018483INFORMATION AND COMMUNICATIONS_MEDIUM M4
151776PROFESSIONAL, SCIENTIFIC AND TECHNICAL ACTIVITIES_SMALL PMC
183057REAL ESTATE ACTIVITIES_MEDIUM PMP
53938REAL ESTATE ACTIVITIES_LARGE R1
1558900INFORMATION AND COMMUNICATIONS_LARGE R2
153651CONSTRUCTION_MEDIUM R3
2066283WATER SUPPLY, SANITATION ACTIVITIES, WASTE MANAGEMENT AND
DECONTAMINATION_LARGE TAN
2066283WATER SUPPLY, SANITATION ACTIVITIES, WASTE MANAGEMENT AND
DECONTAMINATION_LARGE TGF
1018483INFORMATION AND COMMUNICATIONS_MEDIUM TREB
73538WATER SUPPLY, SANITATION ACTIVITIES, WASTE MANAGEMENT AND
DECONTAMINATION_MEDIUM TRON
29
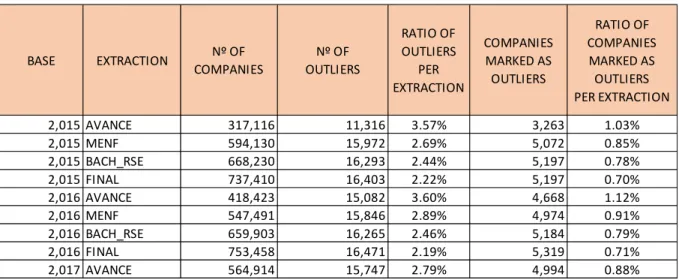
• Ratios of outliers per extraction and number of companies marked as outliers pre extraction: Table 4.7 Outliers by extraction and Companies marked as outliers by extraction
This table shows by base, year of the reported financial statements, and extraction, the number of companies analysed and the results of the SAS program, as it can be seen the ratio of outliers per extraction varies from 3.60% in the advance samples, as it can be expected because of the smaller number of companies analysed by the temporality of the extraction, to 2.22% in the final sample. It is to be highlighted that for 2017 base, the number of companies analysed has grown and is similar to the second extraction (MENF), around 2.70%, and the ratio of outliers per extraction behaves in the same way.
As it is mentioned, when an observation has one of the ratios labelled as an outlier, this one is considered as an outlier, as it can be checked at the ratio of companies marked as outliers per extraction, it is approximately half of the results shown at the column of ratio of outliers per extraction. That bring us to the conclusion that approximately half of the companies marked as outliers has more than one outlier among its ratios.
• Evolution of number of outliers by base, extraction and ratio
With the aim of analysing the stability of the number of outliers per ratio and extraction, it is performed the table 4.8 in which it can be observed that in most of the ratios and for all the extractions, the number of outliers found remains very stable despite in every further one of each base, the number of companies grows, around 100,000 by each extraction.
This leads to asses this method that identifies the observations that deviates more from the normal distribution and also contributes more to the variation of their respective node making this method a very efficient lawyer of quality control due to the reduced number of abnormal observations explain the most important part of the variation of the node. This stability of number of outliers per extraction and ratio can be checked graphically at chart 4.4 BASE EXTRACTION Nº OF COMPANIES Nº OF OUTLIERS RATIO OF OUTLIERS PER EXTRACTION COMPANIES MARKED AS OUTLIERS RATIO OF COMPANIES MARKED AS OUTLIERS PER EXTRACTION 2,015 AVANCE 317,116 11,316 3.57% 3,263 1.03% 2,015 MENF 594,130 15,972 2.69% 5,072 0.85% 2,015 BACH_RSE 668,230 16,293 2.44% 5,197 0.78% 2,015 FINAL 737,410 16,403 2.22% 5,197 0.70% 2,016 AVANCE 418,423 15,082 3.60% 4,668 1.12% 2,016 MENF 547,491 15,846 2.89% 4,974 0.91% 2,016 BACH_RSE 659,903 16,265 2.46% 5,184 0.79% 2,016 FINAL 753,458 16,471 2.19% 5,319 0.71% 2,017 AVANCE 564,914 15,747 2.79% 4,994 0.88%
30 Table 4.8 Evolution of Nº of outliers by base, extraction and ratio
NODO AVANCE 2015 MENF 2015 BACH_RSE 2015 FINAL 2015 AVANCE 2016 MENF 2016 BACH_RSE 2016 FINAL 2016 AVANCE 2017 E1 832 1,131 1,303 1,469 784 1,012 1,388 1,357 972 E2 939 1,105 1,173 1,126 1,183 1,070 1,053 1,149 1,222 E3 868 1,291 1,238 1,175 1,260 1,272 1,221 1,149 1,208 M1 416 453 538 473 373 419 412 351 486 M2 440 532 424 392 360 419 427 319 333 M3 535 1,025 1,173 1,224 1,054 1,229 1,205 1,405 1,139 M4 737 1,491 1,564 1,616 1,620 1,822 1,877 1,867 1,764 ACCP 357 413 391 277 219 347 259 287 305 ASPP 416 413 440 343 399 419 366 447 403 R1 654 932 1,010 1,110 707 824 1,099 1,213 653 R2 832 772 1,043 963 759 781 915 1,069 819 R3 606 1,291 1,271 1,306 1,054 1,113 1,190 1,069 1,028 RV NA 927 972 994 1,077 900 1,012 961 1,053 805 RV FC 511 532 424 473 771 665 549 399 569 RV GOP 761 1,118 978 1,012 1,029 940 931 910 1,278 RV ONP 737 958 733 653 913 925 763 622 1,083 RV GVA 749 1,544 1,597 1,714 1,697 1,576 1,648 1,804 1,680 Total 11,316 15,972 16,293 16,403 15,082 15,846 16,265 16,471 15,747
31
32
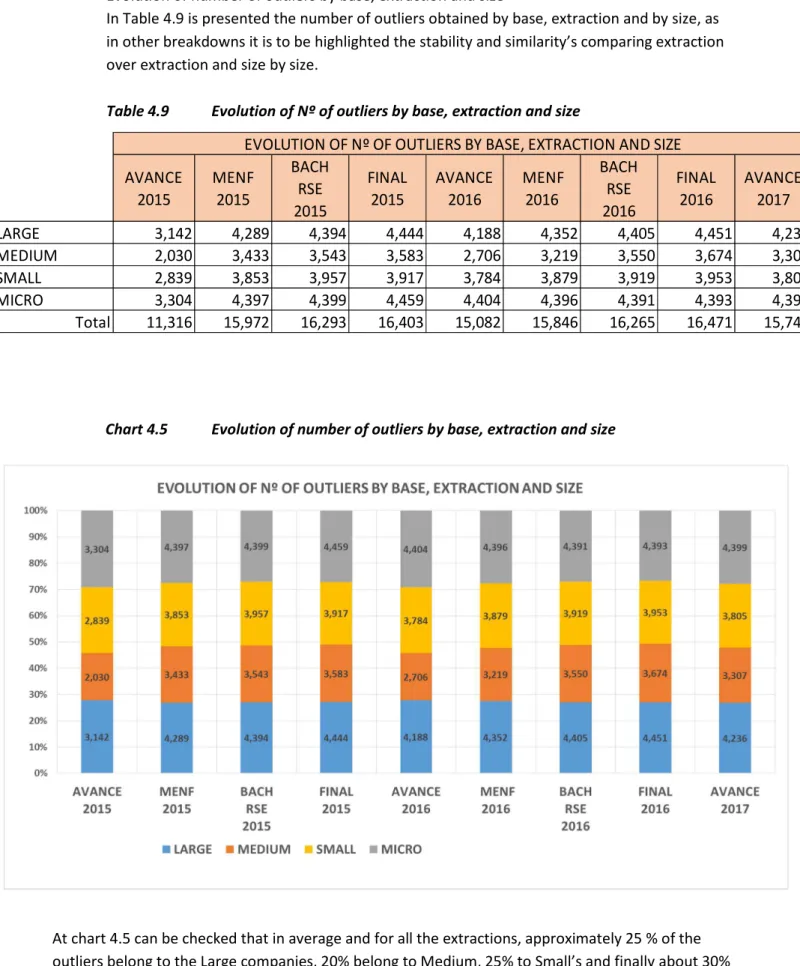
• Evolution of number of outliers by base, extraction and size
In Table 4.9 is presented the number of outliers obtained by base, extraction and by size, as in other breakdowns it is to be highlighted the stability and similarity’s comparing extraction over extraction and size by size.
Table 4.9 Evolution of Nº of outliers by base, extraction and size
Chart 4.5 Evolution of number of outliers by base, extraction and size
At chart 4.5 can be checked that in average and for all the extractions, approximately 25 % of the outliers belong to the Large companies, 20% belong to Medium, 25% to Small’s and finally about 30% of the outliers belong to Micro’s , as can be expected, as at the outsider’s method it is measured the
AVANCE 2015 MENF 2015 BACH RSE 2015 FINAL 2015 AVANCE 2016 MENF 2016 BACH RSE 2016 FINAL 2016 AVANCE 2017 LARGE 3,142 4,289 4,394 4,444 4,188 4,352 4,405 4,451 4,236 MEDIUM 2,030 3,433 3,543 3,583 2,706 3,219 3,550 3,674 3,307 SMALL 2,839 3,853 3,957 3,917 3,784 3,879 3,919 3,953 3,805 MICRO 3,304 4,397 4,399 4,459 4,404 4,396 4,391 4,393 4,399 Total 11,316 15,972 16,293 16,403 15,082 15,846 16,265 16,471 15,747
33 contribution of the observation to its node, and the 30% in which the number of observations are much bigger and the distributions can widen the range of the outlier caliber and the contribution to its node.
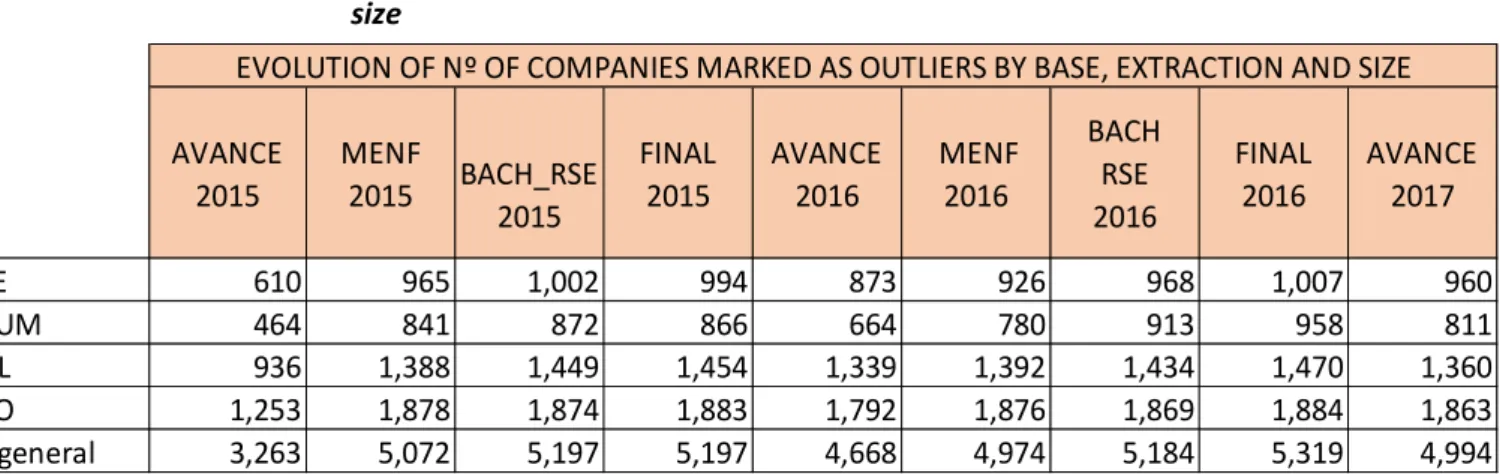
Similar figures can be seen regarding the number of companies marked as outlier by base, extraction and size at table 4.10 and chart 4.6:
Table 4.10 Evolution of Nº of companies marked as outliers by base, extraction and size
Chart 4.6 Evolution of Nº of companies marked as outliers by base, extraction and size AVANCE 2015 MENF 2015 BACH_RSE 2015 FINAL 2015 AVANCE 2016 MENF 2016 BACH RSE 2016 FINAL 2016 AVANCE 2017 LARGE 610 965 1,002 994 873 926 968 1,007 960 MEDIUM 464 841 872 866 664 780 913 958 811 SMALL 936 1,388 1,449 1,454 1,339 1,392 1,434 1,470 1,360 MICRO 1,253 1,878 1,874 1,883 1,792 1,876 1,869 1,884 1,863 Total general 3,263 5,072 5,197 5,197 4,668 4,974 5,184 5,319 4,994
34 In the following two pages we can see the Table 4.11 that represents the evolution of number of outliers detected by size sector and extraction, to the right it can be found charts corresponding to every sector, size and extraction in which it is represented graphically the evolution of the
aforementioned labelled outliers.
This allows a quick assessment of the outsider’s method through analysing the performance of the outliers founded throughout the extractions by a simple view of the charts.
35
Table 4.11 Evolution of number of outliers by sector size and extraction
NODE SECTOR Y TAMAÑO ADVANCE
2015 MENF 2015 BACH_RSE 2015 FINAL 2015 ADVANCE 2016 MENF 2016 BACH_RSE 2016 FINAL 2016 ADVANCE 2017 MEAN STANDARD DEVIATION
A1 AGRICULTURE, FORESTRY AND FISHING_LARGE 439 287 387 247 585 308 325 308 239 347.09 102.91
A2 AGRICULTURE, FORESTRY AND FISHING_MEDIUM 249 269 581 550 331 441 542 532 283 419.78 128.80
A3 AGRICULTURE, FORESTRY AND FISHING_SMALL 227 261 258 269 302 267 249 189 274 255.09 30.02
A4 AGRICULTURE, FORESTRY AND FISHING_MICROS 117 0 65 67 156 215 195 201 18 114.88 76.81
B1 EXTRACTIVE INDUSTRIES_LARGE 453 593 194 191 604 462 683 1,006 575 528.80 235.69 B2 EXTRACTIVE INDUSTRIES_MEDIUM 117 404 581 606 156 215 336 331 380 347.39 160.95 B3 EXTRACTIVE INDUSTRIES_SMALL 124 548 366 381 166 62 141 201 363 261.23 150.45 B4 EXTRACTIVE INDUSTRIES_MICROS 351 216 387 404 468 308 228 225 248 314.76 86.90 C1 MANUFACTURING INDUSTRIES_LARGE 51 269 172 180 68 164 130 130 212 152.99 64.01 C2 MANUFACTURING INDUSTRIES_MEDIUM 73 278 140 157 97 154 173 213 345 181.21 81.00 C3 MANUFACTURING INDUSTRIES_SMALL 22 171 140 146 29 21 0 118 212 95.39 73.66 C4 MANUFACTURING INDUSTRIES_MICROS 37 63 0 0 49 62 22 12 44 31.93 23.18
Nº OUTLIERS BY SECTOR, SIZE and EXTRACTION
GRAPHICAL EVOLUTION 0 100 200 300 400 500 600 700 ADVANCE 2015 MENF 2015 BACH_RSE 2015 FINAL 2015 ADVANCE 2016 MENF 2016 BACH_RSE 2016 FINAL 2016 ADVANCE 2017
AGRICULTURE, FORESTRY AND FISHING
AGRICULTURE, FORESTRY AND FISHING_LARGE AGRICULTURE, FORESTRY AND FISHING_MEDIUM AGRICULTURE, FORESTRY AND FISHING_SMALL AGRICULTURE, FORESTRY AND FISHING_MICROS
0 200 400 600 800 1,000 1,200 ADVANCE 2015 MENF 2015 BACH_RSE 2015 FINAL 2015 ADVANCE 2016 MENF 2016 BACH_RSE 2016 FINAL 2016 ADVANCE 2017 EXTRACTIVE INDUSTRIES
EXTRACTIVE INDUSTRIES_LARGE EXTRACTIVE INDUSTRIES_MEDIUM
EXTRACTIVE INDUSTRIES_SMALL EXTRACTIVE INDUSTRIES_MICROS
0 50 100 150 200 250 300 350 400 ADVANCE 2015 MENF 2015 BACH_RSE 2015 FINAL 2015 ADVANCE 2016 MENF 2016 BACH_RSE 2016 FINAL 2016 ADVANCE 2017 MANUFACTURING INDUSTRIES
MANUFACTURING INDUSTRIES_LARGE MANUFACTURING INDUSTRIES_MEDIUM
36
Table 4.11 Evolution of number of outliers by sector size and extraction (cont.)
D1 SUPPLY OF ELECTRICAL POWER, GAS, STEAM AND
AIR CONDITIONING_LARGE 205 314 409 426 273 441 271 118 195 294.63 106.67
D2 SUPPLY OF ELECTRICAL POWER, GAS, STEAM AND AIR CONDITIONING_MEDIUM 1,001 1,114 699 729 1,335 1,590 1,246 1,065 1,043 1,091.40 264.20
D3 SUPPLY OF ELECTRICAL POWER, GAS, STEAM AND
AIR CONDITIONING_SMALL 373 674 516 426 497 677 856 603 628 583.35 139.29
D4 SUPPLY OF ELECTRICAL POWER,GAS, STEAM AND
AIR CONDITIONING _MICROS 102 225 247 258 136 154 217 189 177 189.49 49.29
E1 WATER SUPPLY, SANITATION ACTIVITIES, WASTE
MANAGEMENT AND DECONTAMINATION_LARGE 446 620 925 976 594 513 412 615 477 619.82 190.30
E2 WATER SUPPLY, SANITATION ACTIVITIES, WASTE
MANAGEMENT AND DECONTAMINATION_MEDIUM 132 494 226 236 175 256 325 556 292 299.10 133.08
E3 WATER SUPPLY, SANITATION ACTIVITIES, WASTE
MANAGEMENT AND DECONTAMINATION_SMALL 132 225 645 673 175 246 336 414 177 335.89 191.15
E4 WATER SUPPLY, SANITATION ACTIVITIES, WASTE
MANAGEMENT AND DECONTAMINATION_MICROS 102 278 140 146 136 246 347 319 309 224.97 88.57
F1 CONSTRUCTION_LARGE 212 180 398 415 283 287 184 343 195 277.37 86.49
F2 CONSTRUCTION_MEDIUM 534 440 366 258 711 451 423 414 336 436.97 121.47
F3 CONSTRUCTION_SMALL 183 314 398 415 244 462 488 461 301 362.78 101.04
F4 CONSTRUCTION_MICROS 15 18 11 11 19 10 0 0 9 10.35 6.47
G1 WHOLESALE AND RETAIL REPAIR OF MOTOR
VEHICLES AND MOTORCYCLES_LARGE 29 54 32 34 39 51 108 154 53 61.62 39.63
G2 WHOLESALE AND RETAIL REPAIR OF MOTOR
VEHICLES AND MOTORCYCLES_MEDIUM 132 135 183 191 175 205 260 189 177 182.96 35.90
G3 WHOLESALE AND RETAIL REPAIR OF MOTOR
VEHICLES AND MOTORCYCLES_SMALL 15 126 43 45 19 21 11 35 115 47.73 40.53
G4 WHOLESALE AND RETAIL REPAIR OF MOTOR
VEHICLES AND MOTORCYCLES_MICROS 0 9 0 0 0 0 0 0 9 1.98 3.71 Nº OUTLIERS BY SECTOR, SIZE and EXTRACTION
0 500 1,000 1,500 2,000 ADVANCE 2015 MENF 2015 BACH_RSE 2015 FINAL 2015 ADVANCE 2016 MENF 2016 BACH_RSE 2016 FINAL 2016 ADVANCE 2017
SUPPLY OF ELECTRICAL POWER, GAS, STEAM AND AIR CONDITIONING
SUPPLY OF EL ECTRICAL PO WER, GAS, STEAM AND AIR CONDITIONING_LARGE SUPPLY OF EL ECTRICAL PO WER, GAS, STEAM AND AIR CONDITIONING_MEDIUM SUPPLY OF EL ECTRICAL PO WER, GAS, STEAM AND AIR CONDITIONING_SMALL
0 200 400 600 800 1,000 1,200 ADVANCE 2015 MENF 2015 BACH_RSE 2015 FINAL 2015 ADVANCE 2016 MENF 2016 BACH_RSE 2016 FINAL 2016 ADVANCE 2017
WATER SUPPLY, SANITATION ACTIVITIES, WASTE MANAGEMENT AND DECONTAMINATION
WATER SUPPLY, SANITATION ACTIVITIES, WASTE MANAGEMENT AND DECONTAMINATION_LARGE WATER SUPPLY, SANITATION ACTIVITIES, WASTE MANAGEMENT AND DECONTAMINATION_MEDIUM WATER SUPPLY, SANITATION ACTIVITIES, WASTE MANAGEMENT AND DECONTAMINATION_SMALL WATER SUPPLY, SANITATION ACTIVITIES, WASTE MANAGEMENT AND DECONTAMINATION_MICRO S
0 100 200 300 400 500 600 700 800 ADVANCE 2015 MENF 2015 BACH_RSE 2015 FINAL 2015 ADVANCE 2016 MENF 2016 BACH_RSE 2016 FINAL 2016 CONSTRUCTION
CONSTRUCTION_LARGE CONSTRUCTION_MEDIUM CONSTRUCTION_SMALL CONSTRUCTION_MICROS
0 50 100 150 200 250 300 ADVANCE 2015 MENF 2015 BACH_RSE 2015 FINAL 2015 ADVANCE 2016 MENF 2016 BACH_RSE 2016 FINAL 2016 ADVANCE 2017
WHOLESALE AND RETAIL REPAIR OF MOTOR VEHICLES AND MOTORCYCLES
WHO LESALE AND RETAIL REPAIR OF MOTOR VEHICLES AND MOTORCYCLES_LARGE WHO LESALE AND RETAIL REPAIR OF MOTOR VEHICLES AND MOTORCYCLES_MEDIUM WHO LESALE AND RETAIL REPAIR OF MOTOR VEHICLES AND MOTORCYCLES_SMALL WHO LESALE AND RETAIL REPAIR OF MOTOR VEHICLES AND MOTORCYCLES_MICROS
37
Table 4.11 Evolution of number of outliers by sector size and extraction (cont.)
H1 TRANSPORTATION AND STORAGE_LARGE 234 296 312 191 312 103 152 83 327 223.22 89.70
H2 TRANSPORTATION AND STORAGE_MEDIUM 66 386 505 527 88 246 390 497 371 341.90 163.42
H3 TRANSPORTATION AND STORAGE_SMALL 183 287 301 314 244 174 184 308 283 253.13 54.84
H4 TRANSPORTATION AND STORAGE_MICROS 73 63 0 0 97 103 98 106 62 66.88 39.07
I1 HOSTELRY_LARGE 227 602 269 280 302 338 412 343 566 371.01 124.28
I2 HOSTELRY_MEDIUM 285 225 323 292 380 513 358 390 265 336.68 80.81
I3 HOSTELRY_SMALL 219 81 118 123 292 185 65 71 88 138.13 73.58
I4 HOSTELRY_LARGE 15 0 0 0 19 41 0 0 0 8.35 13.54
J1 INFORMATION AND COMMUNICATIONS_LARGE 468 27 387 404 624 390 390 284 141 346.08 166.08
J2 INFORMATION AND
COMMUNICATIONS_MEDIUM 212 710 1,086 1,133 283 892 921 840 831 767.58 303.84
J3 INFORMATION AND COMMUNICATIONS_SMALL 351 386 484 505 468 503 509 509 354 452.00 64.41
J4 INFORMATION AND COMMUNICATIONS_MICROS 22 135 140 146 29 21 11 12 133 71.93 59.64
Nº OUTLIERS BY SECTOR, SIZE and EXTRACTION
0 100 200 300 400 500 600 ADVANCE 2015 MENF 2015 BACH_RSE 2015 FINAL 2015 ADVANCE 2016 MENF 2016 BACH_RSE 2016 FINAL 2016 ADVANCE 2017
TRANSPORTATION AND STORAGE
TRANSPORTATION AND STORAGE_LARGE TRANSPORTATION AND STORAGE_MEDIUM TRANSPORTATION AND STORAGE_SMALL TRANSPORTATION AND STORAGE_MICROS
0 100 200 300 400 500 600 700 ADVANCE 2015 MENF 2015 BACH_RSE 2015 FINAL 2015 ADVANCE 2016 MENF 2016 BACH_RSE 2016 FINAL 2016 ADVANCE 2017 HOSTELERÍA
HOSTELRY_LARGE HOSTELRY_MEDIUM HOSTELRY_SMALL HOSTELRY_LARGE
0 200 400 600 800 1,000 1,200 ADVANCE 2015 MENF 2015 BACH_RSE 2015 FINAL 2015 ADVANCE 2016 MENF 2016 BACH_RSE 2016 FINAL 2016 ADVANCE 2017
INFORMATION AND COMMUNICATIONS
INFORMATION AND COMMUNICATIONS_LARGE INFORMATION AND COMMUNICATIONS_MEDIUM INFORMATION AND COMMUNICATIONS_SMALL INFORMATION AND COMMUNICATIONS_MICROS
38
Table 4.11 Evolution of number of outliers by sector size and extraction (cont.)
L1 REAL ESTATE ACTIVITIES_LARGE 366 359 333 348 487 554 553 532 433 440.60 87.17
L2 REAL ESTATE ACTIVITIES_MEDIUM 373 368 635 662 497 544 813 852 566 589.84 160.93
L3 REAL ESTATE ACTIVITIES_SMALL 212 269 172 180 283 256 282 308 256 246.42 45.00
L4 REAL ESTATE ACTIVITIES_MICROS 22 0 0 0 29 31 0 0 18 11.07 12.88
M1 PROFESSIONAL, SCIENTIFIC AND TECHNICAL
ACTIVITIES_LARGE 212 198 22 22 283 267 282 189 168 182.43 94.18
M2 PROFESSIONAL, SCIENTIFIC AND TECHNICAL
ACTIVITIES_MEDIUM 344 548 527 550 458 277 477 568 734 497.97 125.31
M3 PROFESSIONAL, SCIENTIFIC AND TECHNICAL
ACTIVITIES_SMALL 88 611 516 539 117 349 65 47 557 320.93 226.67
M4 PROFESSIONAL, SCIENTIFIC AND TECHNICAL ACTIVITIES_MICROS 0 9 0 0 0 0 0 0 9 1.98 3.71
N1 ADMINISTRATIVE ACTIVITIES AND AUXILIARY SERVICES_LARGE 256 287 258 269 341 328 303 296 354 299.20 33.64
N2 ADMINISTRATIVE ACTIVITIES AND AUXILIARY SERVICES_MEDIUM 556 755 505 527 740 800 563 355 663 607.22 135.28
N3 ADMINISTRATIVE ACTIVITIES AND AUXILIARY SERVICES_SMALL 197 216 129 135 263 185 455 402 221 244.75 106.56
N4 ADMINISTRATIVE ACTIVITIES AND AUXILIARY SERVICES_MICROS 58 45 43 45 78 21 11 0 62 40.28 23.91
Z1 OTHER SERVICES_LARGE 7 81 97 101 10 62 0 0 177 59.34 57.37
Z2 OTHER SERVICES_MEDIUM 270 350 602 651 360 215 303 367 363 386.93 137.02
Z3 OTHER SERVICES_SMALL 73 99 22 22 97 92 108 118 62 77.13 33.53
Z4 OTHER SERVICES_MICROS 58 0 0 0 78 72 54 47 0 34.41 31.91
TOTAL OUTLIERS 11,316 15,972 16,293 16,403 15,082 15,846 16,265 16,471 15,747 15,488 1,530
Nº OUTLIERS BY SECTOR, SIZE and EXTRACTION
0 100 200 300 400 500 600 700 800 900 ADVANCE 2015 MENF 2015 BACH_RSE 2015 FINAL 2015 ADVANCE 2016 MENF 2016 BACH_RSE 2016 FINAL 2016
REAL ESTATE ACTIVITIES
REAL ESTATE ACTIVITIES_LARGE REAL ESTATE ACTIVITIES_MEDIUM REAL ESTATE ACTIVITIES_SMALL REAL ESTATE ACTIVITIES_MICROS
0 100 200 300 400 500 600 700 800 ADVANCE 2015 MENF 2015 BACH_RSE 2015 FINAL 2015 ADVANCE 2016 MENF 2016 BACH_RSE 2016 FINAL 2016 ADVANCE 2017
PROFESSIONAL, SCIENTIFIC AND TECHNICAL ACTIVITIES
PROFESSIONAL, SCIENTIFIC AND TECHNICAL ACTIVITIES_LARGE PROFESSIONAL, SCIENTIFIC AND TECHNICAL ACTIVITIES_MEDIUM PROFESSIONAL, SCIENTIFIC AND TECHNICAL ACTIVITIES_SMALL PROFESSIONAL, SCIENTIFIC AND TECHNICAL ACTIVITIES_MICROS
0 100 200 300 400 500 600 700 800 900 ADVANCE 2015 MENF 2015 BACH_RSE 2015 FINAL 2015 ADVANCE 2016 MENF 2016 BACH_RSE 2016 FINAL 2016 ADVANCE 2017
ADMINISTRATIVE ACTIVITIES AND AUXILIARY SERVICES
ADMINISTRATIVE ACTIVITIES AND AUXILIARY SERVICES_LARGE ADMINISTRATIVE ACTIVITIES AND AUXILIARY SERVICES_MEDIUM ADMINISTRATIVE ACTIVITIES AND AUXILIARY SERVICES_SMALL ADMINISTRATIVE ACTIVITIES AND AUXILIARY SERVICES_MICROS
0 100 200 300 400 500 600 700 ADVANCE 2015 MENF 2015 BACH_RSE 2015 FINAL 2015 ADVANCE 2016 MENF 2016 BACH_RSE 2016 FINAL 2016 ADVANCE 2017 OTHER SERVICES
39
AN INTRODUCTION TO THE SECOND PART OF THE THESIS, METHODS TO
COMPARE AND VALIDATE THE RESULTS OBTAINED BY THE OUTSIDER’S
METHOD.
The results of the Outsider’s method seem to be very promising, for two reasons mainly:
• The proportion of outliers detected in relation to the total observations in each sample analysed overtime.
• The stable trends of number of outliers, by size and by sector through all the extractions. But in order to ensure the quality and effectiveness of this method, and finally to validate its selection as a definitive lawyer of quality control at Banco de España’ s CBSDO is mandatory to compare its results with other outlier detection methods with a proven history of use.
The methods, to be selected to do such validation, are frequently used in institutions like ECB, Eurostat, BACH or the Spanish National Statistics Institute; therefore, they will serve as a framework in which we can compare, test and validate the outsider’s method.
Those methods will be: 1. P3-P97 (1st method)
2. IQR (2nd method)
3. Highest and Lowest observations (3rd method)
It will be used another statistical tool, the one selected is STATA, the main reason to use a different tool is due to ensure the resilience of CBSDO to risks derived from technological dependence.
The Stata code, it will be run by each of these three methods to each of the nine sample extractions and the results obtained will be subsequently compared with the ones obtained by outsider’s method.
Finally, in the chapter of conclusions, the main hypothesis will be to validate the outsider's method as a method of quality control applicable in the CBSDO, and it is desired that this can be contrasted.
40
FIRST METHOD: (P3 – P97)
This approach will try to find out observations with extreme data and a high contribution to the aggregated data, those companies (observations) are eliminated of the sample, which is exactly the same purpose of the outsider’s method.
This method is used in many institutions such EUROSTAT, INE (Spanish National Statistical Institute), etc.; and its results are widely accepted.
It is based in:
• cut-off points (fences),
o above the percentile 97, and o below the percentile 3
• Contribution of each observation to the whole aggregated data.
Table 4.11 First method to validate outsider’s method: P3 – P97
It has been designed an Stata code to be run in each extraction, the results of this P3_P97 method on the different extractions can be seen in the following table 4.12
41 Table 4.12 Results obtained by P3_P97 method and comparison with outsider’s method
The match ratio between the P3_P97 method and the outsider’s method it is proved to be fairly constant in all extractions and slips around 45%.
The number of companies marked as outliers by the P3_P97 method is much greater than the results obtained by the outsider’s method.
In table 4.13 it can be found that the % of companies marked as outliers by the outsider’s method is around 1% over the total companies of the sample while the same figure for the P3_P97 is around 12% in all extractions.
Table 4.13 Coverage ratios of firms marked as outliers over the total obtained by P3_P97 method and comparison with outsider’s method
It is very important for Banco de España, to be accurate in our quality control procedures, in one hand to eliminate those observation that disturb our sample, but in other to lose the less observations possible and in order to have the sample with the widest possible coverage. So, the number of companies expelled from the sample by the P3_P97 method is not acceptable while the number of them by the outsider’s method seems to be more reasonable.
AVANCE 2017 FINAL 2016 BACH_RSE 2016 MENF 2016 AVANCE 2016 FINAL 2015 BACH_RSE 2015 MENF 2015 AVANCE 2015 NUMBER OF FIRMS 564,914 753,458 659,903 547,491 418,423 753,458 659,903 547,491 418,423
NUMBER OF FIRMS MARKED AS OUTLIERS
OUTSIDER'S 4,994 5,319 5,184 4,974 4,668 5,197 5,197 5,072 3,263
P3_P97 67,078 91,874 80,342 66,481 50,728 91,874 80,342 66,481 50,728
% MATCHING BETWEEN P3_P97 & OUTSIDER'S 45% 47% 45% 44% 43% 48% 48% 47% 40%
NUMBER OF FIRMS MARKED AS OUTLIERS THAT MATCH 2,254 2,524 2,348 2,200 1,998 2,516 2,516 2,390 1,306
% NO MATCHING BETWEEN P3_P97 & OUTSIDER'S 55% 53% 55% 56% 57% 52% 52% 53% 60%
NUMBER OF FIRMS MARKED AS OUTLIERS THAT DON'T MATCH 2,740 2,795 2,836 2,774 2,670 2,681 2,681 2,682 1,957
INTERSECTION P3_P97 Vs OUTSIDER'S EXTRACTIONS AVANCE 2017 FINAL 2016 BACH_RSE 2016 MENF 2016 AVANCE 2016 FINAL 2015 BACH_RSE 2015 MENF 2015 AVANCE 2015 % FIRMS MARKED AS OUTLIERS OVER TOTAL
OUTSIDER'S 0.9% 0.7% 0.8% 0.9% 1.1% 0.7% 0.8% 0.9% 0.8%
P3_P97 11.9% 12.2% 12.2% 12.1% 12.1% 12.2% 12.2% 12.1% 12.1%
INTERSECTION P3_P97 Vs OUTSIDER'S
42
SECOND METHOD: INTERQUARTILE RANGE (IQR)
This method for identifying outliers is used at ECB, EUROSTAT1, BACH and many other institutions,
and its results are widely accepted. The main elements of this method are:
• Lower quartile (Q1),
• Upper quartile (Q3), and
• The caliber, (k)
This method contains cut-off points (fences), k(Q3-Q1), above the upper quartile and below the lower quartile: [Q1 – k(Q3-Q1), Q3 + k(Q3-Q1)]
Observations beyond the fences are considered as potential outliers. In our proposal, k=25, with the aim of excluding only very extreme data, especially, because it must be taken into account that in some of our distributions, the first and third quartiles may have values very close to zero, which would imply that the interquartile range would be very wide and would not have a discriminating character when distinguishing anomalous observations of other normal and representative of the sample reality.
In this method is included, as a variable, the contribution of the observation to the aggregated data. It is considered relevant to analyse with this not homogeneous methodological approach because it can be tested the correlation of the extreme observations founded by the outsider’s method with the extreme observations that this method will be found.
Table 4.12 Second method to validate outsider’s method: IQR
1Practical guide to data validation in EUROSTAT (2.007): “Among all the different measures and graphs,
the boxplot deserves a special reference, because it is particularly good in showing the main characteristics of the data and the existence of outliers. In fact, it was designed to do so. Letting Q1 and Q3 denote the first and the third quartiles respectively and IQR = Q3 –Q1 the interquartile range, the commonly used rule is the following:
• A data value i X is considered a moderate outlier if X< Q1 - 1.5*IQR or if X >Q3+ 1.5*IQR.
• A data value i X is considered a severe outlier if X< Q1 - 3*IQR or if X >Q3+ 3*IQR.
The values Q1 – 3*IQR - and Q3 + 3*IQR are called the lower and upper outer fences respectively and the values Q1 – 1.5*IQR - and Q3 + 1.5*IQR are called the lower and upper and inner fences respectively. The boxplot clearly marks the eventual outliers, often using different symbols for moderate (for example, an asterisk) and for severe (for example, a circle) outliers. Moreover, the value taken for the lower whisker is the lowest observation below Q1 that does not cross the lower inner fence, and the value taken for the upper whisker is the highest observation above Q3 that does not cross the upper inner fence, i.e.:
• Lower whisker = min {X: Q1 -1.5*IQR <= X<= Q1}.
• Upper whisker = max {X: Q3 <= X<= Q3 + 1.5IQR}. This choice for the whiskers makes outlier detection easier.”
43 These box plots produce graphical representation and allows to usually pinpoint the outlying observations, in the previous x-scale chart values, for the normal data are included within the limits set by the whiskers which, are fixed by the difference of the interquartile range and by the chosen caliber. Box plots make no assumptions about the data distribution model but are reliant on a human to note the extreme points plotted on the box plot.
It has been designed an Stata code to obtain the companies marked as outliers by this method, the results of the IQR method on the different extractions can be seen in the following table 4.13 Table 4.13 Results obtained by IQR method and comparison with outsider’s method
The match ratio between the IQR method and the outsider’s method proves to be fairly constant in all extractions and slips around 12%.
The number of companies marked as outliers by the IQR method is similar to the results obtained by the outsider’s method.
In table 4.14 it can be found that the % of companies marked as outliers by the outsider’s method is around 1% over the total companies of the sample while the same figure for the P3_P97 is around 12% in all extractions. AVANCE 2017 FINAL 2016 BACH_RSE 2016 MENF 2016 AVANCE 2016 FINAL 2015 BACH_RSE 2015 MENF 2015 AVANCE 2015 NUMBER OF FIRMS 564,914 753,458 659,903 547,491 418,423 753,458 659,903 547,491 418,423
NUMBER OF FIRMS MARKED AS OUTLIERS
OUTSIDER'S 4,994 5,319 5,184 4,974 4,668 5,197 5,197 5,072 3,263
IQR25 7,974 8,220 8,542 7,914 6,613 8,506 8,502 7,851 4,833
% MATCHING BETWEEN IQR25 & OUTSIDER'S 11% 10% 11% 12% 13% 11% 11% 11% 14%
NUMBER OF FIRMS MARKED AS OUTLIERS THAT MATCH 564 556 587 587 591 561 561 551 456
% NO MATCHING BETWEEN IQR25 & OUTSIDER'S 89% 90% 89% 88% 87% 89% 89% 89% 86%
NUMBER OF FIRMS MARKED AS OUTLIERS THAT DON'T MATCH 4,430 4,763 4,597 4,387 4,077 4,636 4,636 4,521 2,807
INTERSECTION IQR25 Vs OUTSIDER'S
44 Table 4.14 Coverage ratios of firms marked as outliers over the total obtained by IQR method and comparison with outsider’s method
The preliminary conclusions of this validating method would consist in:
• Reduced percentage of coincidence between this IQR method and the Outsider’s one, the reasons behind this are linked to the distributions of the different nodes, even though the caliber to set up the fences is designed to be extremely wide, seems that the differences of interquartile ranges (Q3 – Q1) make the outlier selection even wider, and that is the main reason for the reduced coincidence of both methods.
• The percentage of firms marked as outliers over the total are closer in this two methods and are more acceptable if compared with P3_P97 percentages.
Finally, to compare the results obtained by these two validating methods, the list of companies marked as outliers were merged and the results can be seen in the following table 4.15
Table 4.15 Results obtained by IQR method and comparison with P3_P97 method
It can be highlighted the high ratio of coincidence of the companies selected by the IQR method compared with the ones selected by the P3_P97 is around 90% in all extractions.
In Both methods, P3_P97 and IQR, the condition to be declared outlier is a combination of 1. Being out of the respective cut-off points (fences);
• below percentile 3 and above percentile 97 in the case of the P3_P97 method and
AVANCE 2017 FINAL 2016 BACH_RSE 2016 MENF 2016 AVANCE 2016 FINAL 2015 BACH_RSE 2015 MENF 2015 AVANCE 2015 % FIRMS MARKED AS OUTLIERS OVER TOTAL
OUTSIDER'S 0.9% 0.7% 0.8% 0.9% 1.1% 0.7% 0.8% 0.9% 0.8%
IQR 1.4% 1.1% 1.3% 1.4% 1.6% 1.1% 1.3% 1.4% 1.2%
INTERSECTION IQR25 Vs OUTSIDER'S
EXTRACTIONS AVANCE 2017 FINAL 2016 BACH_RSE 2016 MENF 2016 AVANCE 2016 FINAL 2015 BACH_RSE 2015 MENF 2015 AVANCE 2015 NUMBER OF FIRMS 564,914 753,458 659,903 547,491 418,423 753,458 659,903 547,491 418,423
NUMBER OF FIRMS MARKED AS OUTLIERS
P3_P97 67,078 91,874 80,342 66,481 50,728 91,874 80,342 66,481 50,728
IQR25 7,974 8,220 8,542 7,914 6,613 8,506 8,502 7,851 4,833
% MATCHING BETWEEN IQR25 & OUTSIDER'S 91% 90% 85% 91% 93% 93% 95% 92% 90%
NUMBER OF FIRMS MARKED AS OUTLIERS THAT MATCH 7,240 7,363 7,298 7,196 6,143 7,882 8,103 7,231 4,345
% NO MATCHING BETWEEN IQR25 & OUTSIDER'S 9% 10% 15% 9% 7% 7% 5% 8% 10%
NUMBER OF FIRMS MARKED AS OUTLIERS THAT DON'T MATCH 734 857 1,244 718 470 624 399 620 488
INTERSECTION IQR25 Vs P3_P97
45
• In the case of IQR, the value of the variable in absolute value is over 25 times the interquartile range measured by the difference between the third quartile and the first one.
2. Having a contribution to it respective node over 1%
With this methodology we are comparing two very similar approaches, the two aforementioned validating methods (P3_P97 and IQR) with the outsider’s method with its φ function, that includes both conditions, the contribution of the observation to its own node measured by the difference between the value of the node for that observation and the value of that node would have if that observation were not in the sample; and the cut-off points obtained by ordering by node the φ function values obtained for every company in the sample and selecting those that for each node in absolute value belongs to the 20 greatest.
(i) (ii) (iii) R for Ratio N for Numerator D for Denominator i for each company j for each node
And to avoid the masking effect, and to properly define the condition of outlier, declare those observations in which their "Ind function” in Absolut value are greater than one are defined as outliers.