Março, 2019
Ana Sofia de Castro Brandão
Licenciada em Física
T cell polarization influences the development
of IBD-associated neoplasia
Dissertação para obtenção do Grau de Mestre em
Genética Molecular e Biomedicina
Orientador: Professor Doutor José Carlos Machado,
Universidade do Porto
Júri:
Presidente: Professora Doutora Maria Alexandra Núncio de Carvalho Ramos Fernandes
Arguente: Professora Doutora Marília Lopes Cravo Vogal: Professor Doutor José Carlos Lemos Machado
iii
Ana Sofia de Castro Brandão
Licenciada em Física
T cell polarization influences the
development of IBD-associated neoplasia
Dissertação para obtenção do Grau de Mestre em
Genética Molecular e Biomedicina
Orientador: Professor Doutor José Carlos Machado,
Universidade do Porto
Júri:
Presidente: Professora Doutora Maria Alexandra Núncio de Carvalho Ramos Fernandes
Arguente: Professora Doutora Marília Lopes Cravo Vogal: Professor Doutor José Carlos Lemos Machado
iv
T cell polarization influences the development of IBD-associated neoplasia
Copyright © Ana Sofia de Castro Brandão, Faculdade de Ciências e Tecnologia, Universidade Nova de Lisboa.
A Faculdade de Ciências e Tecnologia e a Universidade Nova de Lisboa têm o direito, perpétuo e sem limites geográficos, de arquivar e publicar esta dissertação através de exemplares impressos reproduzidos em papel ou de forma digital, ou por qualquer outro meio conhecido ou que venha a ser inventado, e de a divulgar através de repositórios científicos e de admitir a sua cópia e distribuição com objetivos educacionais ou de investigação, não comerciais, desde que seja dado crédito ao autor e editor.
v
Acknowledgements
.
Esta caminhada não seria possível sem uma multitude de pessoas, que sempre me apoiaram e estiverem disponíveis para me esclarecer todas as dúvidas.
Em primeiro lugar tenho de agradecer ao Professor Doutor José Carlos Machado, que amavelmente me aceitou no grupo e me deu um ambiente que me permitiu aprender e progredir. Como orientador esteve sempre disponível para me apoiar ao longo dos últimos meses.
Ao Professor Doutor José Luís Costa, pelo tempo disponibilizado e colaboração na resposta a dúvidas e problemas que foram surgindo ao longo deste trabalho.
Um grande agradecimento a todo o GEDY, demasiadas pessoas para enumerar, mas que tornaram os dias mais alegres, o trabalho mais simples e onde sempre houve apoio para tudo o que fosse necessário. Uma menção honrosa tem de ir para a Carolina, que com a sua natureza persistente me motivou para nunca deixar de trabalhar.
Ao Carlos, que me acompanhou ao longo de todo o projeto, sempre ajudou a superar as dificuldades que apareceram e sem o qual este trabalho não teria sido possível.
À Helena e à Sara, que sempre conseguiram arranjar maneira de me ajudar mesmo com os seus horários preenchidos
Não me posso esquecer da minha família, que me apoiaram incondicionalmente. Estarei para sempre grata por toda a ajuda.
Maria, por ter sido conselheira, amiga e pela ajuda toda que me deu não só nesta fase como desde o dia em que nos conhecemos.
Hugo, por ser um fofinho e me aturar TODOS os dias. Obrigada sinceramente por todo o apoio que me tens dado.
vii
Publications
This thesis contains data and methodologies presented as a poster in the following scientific meetings: Brandão, S. et al. T cell polarization influences the development of IBD-associated neoplasia. I3S meeting (2018). 7th i3S Annual Meeting. Axis Vermar Conference & Beach Hotel in Póvoa de Varzim, Portugal. 29th and 30th of November, 2018.
Brandão, S. et al. T cell polarization influences the development of IBD-associated neoplasia. IJUP
(2019). IJUP 2019 – Encontro de Investigação Jovem da Universidade do Porto. Reitoria da
Universidade do Porto. 13th-15th of February, 2019. Distinguished as one of the best poster communications (https://ijup.up.pt/2019/melhores-comunicacoes/).
ix
Resumo
A doença inflamatória intestinal (DII) é uma patologia do trato gastrointestinal e um exemplo de que a inflamação crónica é um fator de risco para cancro, uma vez que os pacientes com DII têm um risco aumentado de cancro colo-rectal. Classicamente, esta associação é explicada por um ambiente inflamatório que favorece o desenvolvimento de neoplasias. Neste trabalho coloca-se a hipótese que, além da inflamação em si, a polarização de células T helper (Th) em células com ação pró- ou anti-tumorigénica é um fator de risco para desenvolvimento de cancro associado a DII. Neste contexto, as células Th1 teriam uma ação anti-tumorigénica, enquanto as células Th17 seriam facilitadoras da sobrevivência de células neoplásicas.
De modo a recapitular o desenvolvimento tumoral num contexto de inflamação crónica, utilizou-se o modelo animal de carcinogénese química azoxymethane e dextran sulphate sodium (AOM+DSS). Citocinas produzidas pelos subtipos de células a serem estudados - IFN-γ para células Th1 ou IL-17F para células Th17 – foram administradas a murganhos C57BL/6 tratados com AOM+DSS de modo a polarizar diferencialmente a resposta inflamatória. Os murganhos foram eutanasiados após dois (early-endpoint) ou três (late-(early-endpoint) ciclos de DSS. O número de tumores e a sua área foram quantificados macroscopicamente e o tecido foi coletado para estudo dos marcadores de linhagem linfocítica CD4, CD8 e Rorγt.
Macroscopicamente, os murganhos tratados com IL-17F desenvolveram mais lesões que os tratados com IFN-γ, embora esta diferença só seja significativa na experiência late-endpoint. Histologicamente, na experiência late-endpoint os murganhos tratados com IFN-γ desenvolveram menos lesões neoplásicas que os grupos controlo e tratado com IL-17F. Nenhuma diferença significativa foi
encontrada na densidade de células CD4+, CD8+ e Rorγt+ nos tumores dos diferentes grupos.
A administração de citocinas influenciou o desenvolvimento de neoplasias: murganhos com aumento da resposta Th1 tiveram menos lesões neoplásicas que murganhos com estímulo da resposta Th17.
xi
Abstract
Inflammatory bowel disease (IBD) is characterized by chronic relapsing inflammation of the gastrointestinal tract. It is an example of the widespread concept that chronic inflammation is a cancer risk factor since patients have an increased risk of colorectal cancer. Classically, this association has been explained by the establishment of an inflammatory environment that favors cell proliferation, angiogenesis and, ultimately, neoplastic risk. We hypothesize that, besides inflammation itself, the polarization of T helper (Th) cells towards branches that are pro- or anti-tumourigenic is an important cancer risk factor in chronic inflammation, namely IBD, and that Th1 cells are anti while Th17 cells are pro-tumourigenic in this setting.
To recapitulate tumour development in the context of chronic inflammation we used the azoxymethane and dextran sulphate sodium (AOM+DSS) chemical carcinogenesis mouse model. Cytokines produced by each of the cell subsets - IFN-γ for Th1 cells or IL-17F for Th17 cells - were administered to AOM+DSS treated C57BL/6 mice to polarize inflammation into the two different types of response. Mice were euthanized after two (early-endpoint experiment) or three (late-endpoint) DSS cycles. Tumour number and area were quantified macroscopically and tissue was collected for histological analysis and for immunohistochemistry with the lymphocytic lineage markers CD4, CD8 and Rorγt.
Macroscopically, IL-17F treated mice had more lesions than IFN-γ treated mice in both experiments, though only statistically significantly in the late-endpoint experiment. Histologically, IFN-γ treated mice in the late-endpoint experiment had fewer neoplastic lesions than the control group and the IL-17F
group, although not significantly. No major differences were observed in the tumour CD4+, CD8+ and
Rorγt+ cell densities between the groups for both experiments.
The cytokine treatment influenced malignancy development: mice treated with IFN-γ, which mimics a Th1 cell response, developed less neoplastic lesions than mice treated with IL-17F, which mimics a Th17 cell response.
xiii
Table of Contents
Acknowledgements ...v Publications ... vii Resumo... ix Abstract ... xi List of figures ... xvList of tables ... xvii
List of abbreviations ... xix
1. Introduction ... 1
1.1. Cancer and inflammation
... 1
1.2. Inflammatory Bowel Disease
... 2
1.3. Cancer and Inflammatory Bowel Disease
... 3
1.3.1. Epidemiology ... 3 1.3.2. Molecular pathways ... 3 1.4. T helper cells
... 4
1.5. Aim... 6
1.6. Animal model... 7
1.6.1. Azoxymethane ... 71.6.2. Dextran sulphate sodium ... 7
1.6.3. Azoxymethane and dextran sulphate sodium mouse model ... 7
2. Material and methods ... 9
2.1. Mice
... 9
2.2. Colitis-inducing treatment
... 9
2.3. Tumour development monitoring
... 9
2.4. Inflammatory response manipulation
... 10
2.5. Euthanasia and necropsy
... 11
2.6. Immunohistochemistry assays
... 11
2.7. Cell counting
... 13
xiv
3.1. Pilot experiment – C57BL/6 mice
... 15
3.2. Manipulation of inflammatory response – late-endpoint
... 17
3.3. Manipulation of inflammatory response – early-endpoint
... 25
4. Discussion... 29
5. Conclusion ... 35
xv
List of figures
Figure 1.1. Two possible pathways for Th cell differentiation. ...6
Figure 2.1. Representative images from colonoscopies performed on B6 mouse... 10
Figure 2.2. BL6 mice are treated with AOM+DSS to recapitulate tumour development in the context of colitis and the inflammatory response is manipulated by the administration of IL-17F and IFN-γ (late-endpoint experiment). ... 10
Figure 2.3. Large intestine of a mouse. ... 11
Figure 2.4. B6 mouse large intestine stained with methylene blue. ... 11
Figure 3.1. B6 mice treated with AOM and DSS. ... 16
Figure 3.3. AOM+DSS treated B6 mice were administered the cytokines IL-17F or IFN-γ. ... 18
Figure 3.4. CD4+, CD8+ and Rorγt+ cell densities in tumours from the AOM+DSS IL-17F or IFN-γ treated B6 mice. ... 20
Figure 3.5. Representative images of the immunohistochemistry against CD4 performed on tumours from the AOM+DSS IL-17F or IFN-γ treated B6 mice. ... 21
Figure 3.6. Representative images of the immunohistochemistry against CD8 performed on tumours from the AOM+DSS IL-17F or IFN-γ treated B6 mice. ... 22
Figure 3.7. Representative images of the immunohistochemistry against Rorγt performed on tumours from the AOM+DSS IL-17F or IFN-γ treated B6 mice. ... 23
Figure 3.8. Analysis of the grade of lesions and colonic inflammatory score in the AOM+DSS IL-17F or IFN-γ treated B6 mice. ... 24
Figure 3.9. Early endpoint experiment with AOM+DSS+IL-17F or IFN-γ treated B6 mice. ... 26
Figure 3.10. CD4+, CD8+ and Rorγt+ cell densities in tumours from the early-endpoint AOM+DSS IL-17F or IFN-γ treated B6 mice. ... 27
Figure 3.11. Representative images of the immunohistochemistry performed on tumours from the early-endpoint AOM+DSS IL-17F or IFN-γ treated B6 mice. ... 28
xvii
List of tables
Table 1.1. Association between different cancers and their inflammatory triggers. ...1 Table 3.1. Table with the criteria used to assess the colonic inflammatory score. ... 24
xix
List of abbreviations
ANOVA Analysis of variance
AOM Azoxymethane
APC Adenomatous polyposis coli
B6 mice C57BL/6 mice
CRC Colorectal carcinoma
DNA Deoxyribonucleic acid
DPX A mixture of distyrene, a plasticizer and xylene
DSS Dextran sulphate sodium
EDTA Ethylenediaminetetraacetic acid
FFPE Formalin-fixed paraffin-embedded
H2O2 Hydrogen peroxide
HIV Human immunodeficiency virus
IBD Inflammatory bowel disease
ICR mice Institute of Cancer Research mice
IFN-γ Interferon-γ
IL Interleukin
iNOS Inducible nitric oxide synthase
MAM Methylazoxymethanol
MIF Macrophage migration inhibitory factor
MW Molecular weight
PBS Phosphate-buffered saline
PCR Polymerase chain reaction
Py Patient-years
Pyd Person years duration
qRT-PCR Quantitative real-time PCR
RNA Ribonucleic acid
RONS Reactive oxygen and nitrogen species
Rorγt Retinoic acid receptor-related orphan nuclear receptor γt
RT Room temperature
SIR Standardized incidence ration
SMR Standardized mortality rate
T Tween 20
TGF-β Transforming growth factor-β
Th T helper
Treg T regulatory
UC Ulcerative colitis
v/v Volume/volume
1
1. Introduction
1.1. Cancer and inflammation
Inflammation was hypothesized to be linked to cancer by Virchow in 1863 after he observed leukocytes in neoplastic lesions (Balkwill & Mantovani 2001). This hypothesis has recently been sustained, with inflammation being a risk factor for numerous types of cancers (Balkwill & Mantovani 2001). Some of these malignancies and the underlying inflammatory condition are presented in table 1.1. About 15% of the new cancer cases in 2012 could be attributed to carcinogenic infections, where inflammation is a key component (Plummer et al. 2016; Balkwill & Mantovani 2001). Elevated risks of malignancy development are also connected to chronic inflammation of unknown cause or as a consequence of chemical and physical agents (Balkwill & Mantovani 2001; Gulumian 1999; Yazici et al. 1990).
Table 1.1. Association between different cancers and their inflammatory triggers. Adapted from Balkwill &
Mantovani 2001.
Malignancy Inflammatory stimulus/condition Bladder Schistosomiasis
Cervical Papillomavirus
Ovarian Pelvic inflammatory disease/talc/tissue remodelling Gastric H. pylori induced gastritis
MALT lymphoma H. pylori
Oesophageal Barrett's metaplasia
Colorectal Inflammatory bowel disease Hepatocellular Hepatitis virus (B and C)
Bronchial Silica, asbestos, cigarette smoke Mesothelioma Asbestos
Kaposi's sarcoma Human herpesvirus type 8
It is important to distinguish acute from chronic inflammation. Acute inflammation rapidly culminates in the secretion of anti-inflammatory cytokines that extinguish it (Coussens & Werb 2002). Conversely, chronic inflammation fails to end in due time, either because the stimulus persists or because there is some malfunction in the mechanisms necessary to terminate the inflammation (Coussens & Werb 2002). In a chronic inflammatory context many factors contribute to the increased risk of developing cancer. In colonic mouse tissue, reactive oxygen and nitrogen species (RONS) are responsible for DNA damage in models of chronic inflammation (Meira et al. 2008; Munn 2017). Macrophage migration inhibitory factor (MIF), a cytokine expressed at inflammatory sites by macrophages and T lymphocytes, has been found to be able to inhibit p53 function by its transcriptional activity, showing a direct way in which inflammatory factors can directly influence adjacent cells. Long-term inactivation of p53 function due to chronic inflammation will then contribute to enhanced proliferation rates, extended life spans and inability to control the spread of prospective oncogenic mutations (Hudson et al. 1999; Coussens & Werb 2002).
2
Moreover, work done in the association of chronic inflammation and gastric cancer indicates that inflammation also has damaging effects on the gastric epithelium, increasing cell death, which results in atrophy and leads to repair by increased cell turnover (Resende et al. 2016; Konturek et al. 2003). Combining this augmented cell turnover with an environment rich in growth factors, risk of transformation is increased (Resende et al. 2016).
1.2. Inflammatory Bowel Disease
Inflammatory bowel disease (IBD) includes both ulcerative colitis and Crohn’s disease. Ulcerative colitis was acknowledged as early as 1875 whereas Crohn’s disease was described in 1932 (Wilks & Moxon 1875; Crohn et al. 1932). Both diseases’ emergence seems to be correlated with industrialization and economical improvement (Kaplan & Ng 2016).
IBD is a chronic relapsing inflammation of the gastrointestinal tract that arises due to genetic and environmental risk factors (Neurath 2014; Danese & Fiocchi 2011; Baumgart & Sandborn 2012). These susceptibility factors seem to be involved in the initiation of malfunction in the epithelial barrier that allows the entry of antigens present in the lumen into the intestinal wall and result in an abnormal immune response (Neurath 2014; Strober et al. 2002). When this response is not controlled, chronic inflammation ensues, with and unrestrained stimulation of immune system (Neurath 2014). Innate immunity is thought to be associated with initiation of intestinal inflammation, being related to acute inflammation, while the acquired immune response contributes to chronic inflammation (Ullman & Itzkowitz 2011).
In patients with Crohn’s disease, inflammation can involve any region of the gastrointestinal tract,
appears in patches and is transmural (affecting the entire intestinal wall), whereas ulcerative colitis’
inflammation is restricted to the colon, beginning in the rectum and spreading proximally in a continuous manner, and is superficial, affecting only the mucosa (Kaplan & Ng 2016).
A comprehensive systematic review of the published literature on the incidence and prevalence of IBD from 1990 to 2016 concluded that the highest prevalence values were found in Europe and North America, where both Crohn’s disease and ulcerative colitis’ incidence seems to be stable or even decreasing according to the majority of the studies analysed. This decline in incidence might be related to environmental exposure. The prevalence of IBD in North America, Oceania and several countries in Europe surpassed 0.3%. The scenario is different in newly industrialized countries in Africa, Asia and South America, however, where the incidence has been rising since 1990 (Ng et al. 2017).
Estimates made using a pharmaco-epidemiological approach found the IBD prevalence in Portugal to be 146 patients per 100 000 persons in 2007, therefore being a country with a moderate prevalence of IBD among European countries (Azevedo et al. 2010). This value rose, however, from 2003, where it was 86 patients per 100 000 persons, indicating that Portugal is heading into the highest prevalences in Europe (Azevedo et al. 2010).
3
1.3. Cancer and Inflammatory Bowel Disease
1.3.1. Epidemiology
In 2001, a meta-analysis of 116 published studies found that the prevalence of colorectal carcinoma (CRC) in any patient with ulcerative colitis (UC) is 3.7% (5.4% if the patient has pancolitis). When the duration of the disease was taken into account, in 41 studies, the incidence of CRC in patients with UC was estimated to be at 3/1000 person years duration (pyd). This study also found that the incidence rates change with time of disease, regardless of disease extent, being 2/1000 pyd at 10 years, 7/1000 pyd at 20 years and 12/1000 at 30 years of disease (Eaden et al. 2001). However, a more recent systematic review and meta-analysis analyzing 81 studies found an incidence rate of CRC in UC patients to be 1.58 per 1000 patient-years (py). During the first 10 years of disease, the incidence rate was 0.91/1000 py, in the second decade 4.07/1000 py and in the third 4.55/1000 py. Overall, this shows a significant decrease in the incidence rate of CRC in UC patients, which could be explained by an increase in the adherence to endoscopic surveillance programs, among other factors. Still, CRC risk continues to increase with disease duration (Castaño-Milla et al. 2014). In both cases, the incidence rates are higher than the one reported for the general population (the annual incidence rate given by the Office of National Statistics of the United Kingdom being 0.6/1000) (Castaño-Milla et al. 2014; Eaden et al. 2001).
As for Crohn’s disease, it was shown in 2006 that the cumulative risk of CRC 10 years after diagnosis is 2.9%. This risk augmented to 5.6% at 20 years and 8.3% at 30 years. The relative risk of CRC was 2.5 (4.5 for patients with colonic disease and 1.1 in ileal disease). Again, these patients have a higher risk of developing CRC than the general population (Canavan et al. 2006). There is, however, some controversy around the increased risk of colorectal cancer in Crohn’s disease; for example, a study on Kaiser Permanente patients that ranged from 1998 to 2010 found that patients with Crohn’s disease (and ulcerative colitis) had a risk of colorectal cancer 1.6-fold higher when compared to members of the general Kaiser Permanente population (Stidham & Higgins 2018; Herrinton et al. 2012).
Notwithstanding the incidence and prevalence of colorectal cancer in inflammatory bowel disease patients, colorectal cancer is a significant cause of death in those patients; the five year survival for cancer patients with Crohn’s disease was found to be 10.1% (median of follow up time= 2.0 years) and 9.7% for patients with ulcerative colitis (median follow up time=3.6 years) (Choi & Zelig 1994). A more recent study analysed inflammatory bowel disease patients with colorectal adenocarcinoma from 1998 to 2008, finding that the standardized mortality rate (SMR) for Crohn’s disease was 2.3 and 2.0 for ulcerative colitis (Herrinton et al. 2012).
1.3.2. Molecular pathways
Many of the cellular abnormalities associated with sporadic colorectal cancer are also associated with colitis-associated cancer. For example, a study analysing ulcerative colitis’ patients found that 85% of cancer lesions had chromosome instability, whereas only 15% of them had high levels of microsatellite instability; this values are similar to sporadic cancer (Ullman & Itzkowitz 2011; Willenbucher et al. 1999; Thibodeau et al. 1993; Aust et al. 2000).
4
However, the inflammatory setting seems to influence the timing and frequency of some of the genetic and molecular alterations that occur in both scenarios (Ullman & Itzkowitz 2011). This is the case for the APC gene product. APC is a tumour-suppressor gene that is inactivated when both alleles are mutated (Sokic-Milutinovic 2019); most sporadic colorectal tumours possess somatic mutations in this gene. Mutations in this gene are frequent and considered an early event in sporadic colorectal cancer, but are less common and seem to appear later in colitis-associated cancer (Ullman & Itzkowitz 2011; Aust et al. 2002; Redston et al. 1995; Tarmin et al. 1995; Miyoshi et al. 1992; Smith et al. 1993). These mutations are seldom detected in areas that are negative or indefinite for dysplasia, and account to less than 14% in regions of low grade dysplasia or cancer (Ullman & Itzkowitz 2011; Redston et al. 1995; Aust et al. 2002; Umetani et al. 1999). Most previous studies were performed exclusively in ulcerative colitis patients.
p53 is also an important tumour-suppressor protein, being responsible for monitoring the integrity of the genome (Vieler & Sanyal 2018; Lane 1992). A key step in the development of colitis-associated cancer seems to be p53 loss of function. Loss of a TP53 allele is very frequent in these tumours (approximately 50-85%) and correlates with malignant progression, being detected in 6% of biopsy samples that were histologically classified as indefinite for dysplasia, in 33% of the ones with low grade dysplasia, in 63% when biopsy samples with high grade dysplasia were considered, and in 85% of carcinoma samples (Yin et al. 1993; Burmer et al. 1992; Ullman & Itzkowitz 2011; Itzkowitz & Yio 2004). TP53 mutations can be found in nondysplastic tissue adjacent to dysplastic areas and were observed to correlate well with histological grade, occurring in the beginning of the tumour development (Ullman & Itzkowitz 2011; Brentnall et al. 1994). Another study that analysed only non-cancerous ulcerative colitis patients found that TP53 mutation frequency was increased in more than 50% of ulcerative colitis cases when compared to normal adult controls. The frequency was also increased when comparing inflamed to non-inflamed regions in ulcerative colitis patients, which indicates that the occurrence of these mutations may be a result of chronic inflammation (Ullman & Itzkowitz 2011; Hussain et al. 2000). In contrast, loss of p53 function in sporadic colorectal cancer occurs later and is thought to define the adenoma to carcinoma transition (Itzkowitz & Yio 2004).
These genetic alterations are considered driver mutations since they confer a selective growth advantage to the cell where they occur. This is in direct opposition to passenger mutations, which don’t influence directly the neoplastic process (Vogelstein et al. 2013).
1.4. T helper cells
CD4+ naïve T lymphocytes differentiate into different T helper (Th), or CD4+, cell subtypes that have
various important roles in the immune system. Their importance is exemplified by the fact that in HIV
infection when CD4+ T cells’ numbers in blood are below a defined concentration opportunistic infections
risk increase (Zhu et al. 2010). Among other functions, they may enhance and maintain CD8+ T
(cytotoxic) cell responses, control macrophage function and orchestrate immune responses against a multitude of microorganisms (Zhu et al. 2010; Bailey et al. 2014).
5
Th cells belong to the adaptive immune system and the first two lineages were defined in 1989: Th1 cells, which produce interferon-γ (IFN- γ), and Th2 cells, which produce interleukin (IL)-4. The former subtype promotes cell-mediated immune responses, being important in the eradication of intracellular microorganisms, whereas the latter supports humoral immunity, having a major role in the immunity against extracellular pathogens such as helminths (Bailey et al. 2014; Mosmann & Coffman 1989; Zhu & Paul 2008; Paul & Seder 1994; Weaver et al. 2006). Th1 cells differentiate in the presence of IL-12 and IFN-γ whereas Th2 cells differentiate in the presence of IL-4 and IL-2 (Zhu & Paul 2008; Sehra et al. 2014; Le gros et al. 1990; Cote-Sierra et al. 2004; Zhu et al. 2010; Lighvani et al. 2001; Hsieh et al. 1993). Despite their different phenotypes, both Th cell subtypes seem to be able to aid both primary and
memory cytotoxic CD8+ T cell responses, thereby enhancing anti-tumour immunity (Bailey et al. 2014;
Ankathatti Munegowda et al. 2012; Chamoto et al. 2003; Ekkens et al. 2007). Later, another type of Th cells was defined, the T regulatory (Treg) cells (Sakaguchi et al. 1995). These cells promote immune tolerance, regulate immune responses and were found to inhibit cytotoxic T cells, thereby suppressing anti-tumour immunity (Bailey et al. 2014; Turk et al. 2004).
Finally, a subtype of Th cells which produce IL-17 has been identified, and these cells were named Th17 cells (Kurts 2008; Aggarwal et al. 2003; Harrington et al. 2005; Park et al. 2005; Bettelli et al. 2006). They have a role in the elimination of extracellular bacteria and differentiate in the presence of both IL-6 and transforming growth factor (TGF)-β; interestingly, TGF-β induces the differentiation of Treg cells and IL-6 inhibits their generation, showing a dichotomy between these two lineages (Bettelli et al. 2006; Weaver et al. 2006; Bailey et al. 2014). Moreover, Th17 cell differentiation and expansion is inhibited by Th1 and Th2 cytokines (IL-12, IL-4 and IFN-γ), which could serve as a mechanism to protect from
excessive inflammation and inadequate polarization into one Th branch (Park et al. 2005).
Th17 cells show cellular plasticity since they are able to convert into the Th1 lineage (in this case they are referred to as non-classical Th1 cells), therefore starting to secrete IFN-γ and no longer secreting IL-17 (Lee et al. 2009; Bailey et al. 2014). The non-classical Th1 cells can be distinguished from the classical Th1 cells because they express the surface marker lectin-like receptor CD161, a remainder of their Th17 cell provenance (Bailey et al. 2014; Cosmi et al. 2008). Another example of plasticity is the
case of Treg cells, which are capable of producing IL-17, upregulating Rorγt,if they are treated with
IL-6 (Zhu et al. 2010; Xu et al. 2007; Yang et al. 2008). There is also evidence of Th17 cells converting into Treg cells (Hoechst et al. 2011; Gagliani et al. 2015). This and other accounts of Th cells converting into other lineages show the enormous plasticity present inside the Th cell type (Zhu et al. 2010). Th17 cells are important in gut homeostasis and abundant in mucosal tissues, but they are not easily found in the peripheral blood of healthy individuals – about 0.1 to 0.5% of circulating Th cells are Th17 cells (Kagami et al. 2010; Chen et al. 2011; Martin et al. 2012; Bailey et al. 2014). This number of circulating Th17 cells is not greatly affected in individuals with cancer, but the number of Th17 cells that infiltrate tumours was found to be significantly increased when compared to homologous or normal tumour-adjacent tissues (Bailey et al. 2014; Martin et al. 2012). This was found to be valid, among others, in colorectal cancer and implies that tumour-associated factors could be involved in the increased density of Th17 cells infiltrating tumours (Tosolini et al. 2011; Martin et al. 2012). An increased
6
density of Th17 cells was found to be associated with a good or bad prognosis depending on the tumour, or not associated with prognosis at all (Martin et al. 2012). For example, substantial Th17 infiltration was
associated with bad prognosis in colorectal cancer,but, in patients with ovarian carcinoma, survival was
associated with high density of Th17 cells in tumour associated-ascitis (Martin et al. 2012; Tosolini et al.
2011; Kryczek, Banerjee, et al. 2009). Moreover, mice deficient in Th17 cells, IL-17-/- mice, were used
with contrasting results: growth of the MC38 colon carcinoma cell line was enhanced while growth of the B16 melanoma and the MB49 bladder carcinoma cell lines was diminished when compared to wild type animals (Martin et al. 2012; Wang et al. 2009; Kryczek, Wei, et al. 2009). Again, we find conflicting results, with Th17 cells having either protective or detrimental effects. Indeed, tumour infiltrating Th17
cells can cause tumour regression by promoting an anti-tumourigenic CD8+ T cell response but they are
also capable of suppressing tumour immunity and facilitating angiogenesis which results in tumour growth; these cells are, therefore, capable of having completely opposite effects on tumour growth (Martin et al. 2012).
1.5. Aim
It was found that the colonic mucosa of IBD patients has an increased number of IL-17+ cells, both
CD68+ monocytes/macrophages and CD3+ T cells, when compared to both the mucosa of inactive
patients and normal mucosa (Fujino et al. 2003). This points to a probable increased frequency of Th17 cells in the development of IBD-associated cancer and to a possible role for these cells in this process. This way, it was hypothesized that inflammation itself is not the major cause of tumour development in inflammatory bowel disease patients, but that Th cell polarization that is associated with inflammation is responsible for the increased risk of cancer in this group. Th1 cells are proposed to be anti-tumourigenic while Th17 cells are posited to be pro-tumourigenic in this chronic inflammatory context. Furthermore, different susceptibilities to cancer development in IBD patients can be explained by different intrinsic tendencies to have a certain type of Th cell response.
In order to address our hypothesis, an animal model was employed (described in the section below), since an in vitro system would not have the required complexity to model the effects of the entire immune system on tumour development. This work aims to assess if, in the inflammatory conditions of IBD, the different subtypes of Th cells would indeed impact tumour growth and development differently, being the initial task in a project that aims to evaluate the validity of the entire hypothesis. We focused on the above-mentioned Th17 cells, that are thought to be increased in IBD patients, and on Th1 cells, previously described to be capable of enhancing anti-tumour immunity. To accomplish this, the polarization of Th cells was exogenously manipulated to assess if there is indeed a change in tumour number, area, and/or stage. To understand the mechanism by which Th cell polarization influences tumour burden, different types of cells will be quantified in various tumours by immunohistochemistry.
Th0
Th17
Th1
IFN-γ
IL-17F
Figure 1.1. Two possible
pathways for Th cell
differentiation. Adapted from
7
1.6. Animal model
In this study, the azoxymethane (AOM) and dextran sulphate sodium (DSS) mouse model of inflammation-driven tumour progression was used.
1.6.1. Azoxymethane
AOM was shown to be not only a tumour initiator, but also a strong strain-dependent tumour promoter (Bissahoyo et al. 2005; Neufert et al. 2007). This compound is not by itself the carcinogen that acts on the rodent’s colon, but it suffers sequential activation after being injected intraperitoneally (Neufert et al. 2007). AOM is first hydroxylated by cytochrome P450 (isoform CYP2E1) in the liver, forming methylazoxymethanol (MAM) (Chen & Huang 2009; Sohn et al. 2001; Neufert et al. 2007). MAM is then excreted by the bile and factors of the colonic flora appear to be needed for further metabolization that results in formaldehyde and a highly reactive product, most likely methyldiazonium, which induces the appearance of O6-methylguanine and O4-methylthymine (Neufert et al. 2007; Reddy et al. 1974; Chen & Huang 2009; O’Toole et al. 1993; Fiala 1977). These altered nucleotides cause base mispairings, leading to point mutations (Swann 1990; Wirtz et al. 2010; Neufert et al. 2007).
The point mutations caused by the alkylated DNA can occur in different genes that are part of pathways implicated in the regulation of apoptosis and cell cycle, such as K-ras, β-catenin and TGFβ, although the mechanism behind this model is not fully explained yet (Chen & Huang 2009).
1.6.2. Dextran sulphate sodium
DSS is a proinflammatory reagent that, when dissolved in the drinking water, is toxic to the epithelial lining of the murine colon and has been used to induce both acute and chronic colitis that is characterized by bloody diarrhea (Neufert et al. 2007; Okayasu et al. 1990; De Robertis et al. 2011). The severity of DSS-induced colitis depends on the load of DSS, which is a function of the dosage of DSS in the drinking water and the weight of the animal, but also of the water intake. In order to have reliable colitis induction, a critical load of DSS needs to be reached. However, monitoring the DSS load (by monitoring the daily drinking volumes) is not usually done for practical reasons (Thorsten Vowinkel et al. 2004; Anon 2016).
1.6.3. Azoxymethane and dextran sulphate sodium mouse model
When treatment of ICR male mice with both AOM and DSS was performed, a model that mimics colitis-driven tumour development and produces colonic adenocarcinoma with a 100% incidence at week 20 was obtained; this first protocol applied only one intraperitoneal injection of AOM followed by one week of DSS in the drinking water (starting one week after the injection) (Neufert et al. 2007; Tanaka et al. 2003). Tubular adenoma, dysplasia and colitis with mucosal ulceration were also present and all the adenocarcinomas that were induced were positive for β-catenin, cyclooxygenase 2 (COX-2) and inducible nitric oxide synthase (iNOS), but negative for p53 (Tanaka et al. 2003).
A four-stage model was later developed, where tumour progression was not driven by a period of acute inflammation (as in the previous model), but by chronic inflammation, that displayed flares of increased activity; this model results in multiple large tumours by week 10 (Neufert et al. 2007; Becker et al. 2005;
8
Becker et al. 2004). Different susceptibilities (dependent on the mouse strain) to the treatment with either AOM or DSS that are translated into the treatment with both reagents have been observed; this way, it is important to select a strain that has an appropriate susceptibility to the treatment and to adjust the dosages to the strain that one wants to use (Suzuki et al. 2006; Bissahoyo et al. 2005; Papanikolaou et al. 2000; Neufert et al. 2007). The result of the treatment seems to also depend on the intestinal microflora, thus varying between animal facilities, and lot-dependent differences of the AOM (Neufert et al. 2007; Reddy et al. 1974).
The AOM+DSS treatment seems to have different severities depending on the sex of the mice. A study applying one intraperitoneal injection of AOM (10 mg/kg) and one week of DSS (2.5%), one week after the injection, on ICR mice found tumour number to be significantly increased in males and the number of tumours with the diameter larger than 2 mm to be higher in male mice when compared to female mice (Lee et al. 2016). Interestingly, this trend is similar in humans: risk of colorectal cancer in ulcerative colitis was found to be higher in men than in women (SIR equal to 2.6 vs 1.9, respectively) (Jess et al. 2012).
9
2. Material and methods
2.1. Mice
All animals were housed in the i3S Animal Facility and all studies were performed according to the Ethics Committee and Direção Geral de Alimentação e Veterinária (DGAV) guidelines for care and use of laboratory animals. C57BL/6 (B6) were acquired in-house, kept on a 12-hour light/dark cycle and housed in polycarbonate cages (two to five per cage). All mice had access to food and drinking water ad libitum. Mice were between 8 and 12 weeks old at the beginning of the treatments.
2.2. Colitis-inducing treatment
Azoxymethane (AOM [Sigma-Aldrich®, St. Louis, MO, USA]) was injected intraperitoneally at a dosage of 10 mg per body weight of the animal, using a 25 or 26G needle. The following day no procedure was done so that the mice could recuperate from the AOM treatment. After that day, dextran sulphate sodium (DSS, 36000-50000 MW [MP Biomedicals, Santa Ana, CA, USA]) treatment was started. This treatment consisted of administering DSS in the drinking water at 2% (w/v) during 3 cycles of 1 week each. All cycles were separated by a 2-week interval. An additional early-endpoint experimental group of C57BL/6 mice was formed and was only subjected to two DSS cycles.
2.3. Tumour development monitoring
The Mainz Coloview mini-endoscopic system [Tuttlingen, Germany] was used to perform colonoscopies on the mice after the second and third DSS cycles to assess the formation and development of colonic lesions in the treated mice. In the first (pilot) experiment, this procedure was also done at the end of the first DSS cycle. All colonoscopies were performed a week after the end of the preceding DSS cycle, so as to minimize damage to the colonic mucosa.
Firstly, the animal was anesthetised with a volatile anaesthetic in an induction chamber (5% isoflurane, 1L/min oxygen), and, after the mouse was recumbent and unresponsive to stimuli, it was transferred to a heating pad, where a continued depth of anaesthesia was ensured by facemask (2% isoflurane, 1L/min oxygen).
The animal then received an enema: 100-150 µl of saline solution (0.9% NaCl) was inserted with a catheter. The colonoscopy approach was then started by inserting the endoscope with the camera slowly, with appropriate lighting and airflow to visualize and inflate the colon, respectively. Images of the colon and lesions were captured and the endoscope was removed. The facemask was also removed and the mouse was placed in a recovery cage and observed until its behavior returned to normality. This process was repeated for all the animals.
10
Figure 2.1. Representative images from colonoscopies performed on B6 mouse. A non-treated mouse (left) and an
AOM+DSS treated mouse (right) are represented. Colonoscopy performed after the second DSS cycle. * - visible colonic lesions.
2.4. Inflammatory response manipulation
The cytokines IFN-γ [BioLegend, San Diego, CA, USA] and IL-17F [BioLegend, San Diego, CA, USA] were injected intraperitoneally (using a 25 or 26G needle) 3 days a week, for a total of 15 injections (5 weeks). The injections started 3 days before the start of the second cycle of DSS and ended on the last day of the third (final) cycle of DSS. The early-endpoint experimental group was also injected 3 days a week, but for a total of 2 weeks, starting on the same day after the beginning of the experiment as the other groups but with the treatment being continued until euthanasia. The doses injected per animal were 3 µg of IFN-γ and 0.5 µg of IL-17F, both diluted in saline solution (0.9% NaCl) in order to complete 150 µl of solution, or 150 µl of saline solution only (in the case of control groups).
Figure 2.2. B6 mice are treated with AOM+DSS to recapitulate tumour development in the context of colitis and the inflammatory response is manipulated by the administration of IL-17F and IFN-γ (late-endpoint experiment). An intraperitoneal injection of AOM (10 mg/kg body weight) is given on day 0. On day 2, the first 2%
DSS cycle is started, lasting until day 8. The cytokines (IL-17F and IFN-γ) and saline solution intraperitoneal injections start on day 20, 3 days before the start of the second DSS cycle. Thereafter, 3 injections of cytokines/saline solution were done each week during 5 weeks, ending two days after the end of the last DSS cycle. The second DSS cycle starts on day 23 and ends on day 29 whereas the last one starts on day 44 and ends on day 50. Mice were euthanized on day 58. – cytokine/saline solution injection. X – euthanasia.
11
2.5. Euthanasia and necropsy
Every animal was anesthetized with isoflurane before euthanasia and then euthanized by cervical dislocation. During necropsy, the abdominal cavity was carefully opened and the spleen removed and weighed. The intestine was removed by cutting above the stomach and around the anus and distended. The large intestine was then measured from the anus to the base of the cecum and cut below the cecum to separate it from the rest of the intestine. The large intestine (figure 2.3) was then washed with saline solution (0.9% NaCl).
For the pilot experiments, the large intestine was then opened, and the lesions were counted and measured by gross macroscopic examination. In the case of the cytokine experiments (B6 mice), the large intestine was stored in formalin to later be processed. After being fixed (for at least 24h),
the large intestine was opened and dipped repeatedly for about 30 seconds in an methylene blue solution and then washed in water. The methylene blue solution was prepared by adding 15 mg of methylene blue to 30 ml of water. The lesions were then counted and measured (figure 2.4).
Figure 2.4. B6 mouse large intestine stained with methylene blue. Example of visible intestinal lesions are marked with a red
arrow. One mouse was treated with AOM+DSS+IL-17F (left) and the other with AOM+DSS+IFN-γ (right).
2.6. Immunohistochemistry assays
In order to prepare samples for immunohistochemistry, the sections of the large intestine where lesions were macroscopically visible were cut longitudinally or transversally, placed in a cassette and immersed in 10% formalin [Bio-optica, Milan, Italy] for at least 24h. After this period, the cassettes were inserted in a tissue processor where tissues were immersed in a sequence of solutions as follows: 70% ethanol, 80% ethanol, 90% ethanol, 2 rounds in 100% ethanol, 3 rounds in Clear Rite for 1h each and 2 rounds Figure 2.3. Large intestine of a mouse. Adapted from
12
in paraffin for 1h and 20 min each. Finally, tissues were embedded in paraffin wax for later analysis of histological sections.
Tissue sections from all animals were obtained in coated slides [Thermo Scientific, Waltham, MA, USA], 4 µm each section, using the MICROM HM 335E microtome followed by incubation at 65ºC for 30 minutes or at 37% overnight to adhere the sections to the slides. The sections were stored at room temperature (RT) until analysis.
After the previous procedures, the slides were ready to be used in the immunohistochemistry assays. They were first deparaffinised through immersion in xylene solution in two 5 minute rounds [VWR, Radnor, PA, USA], and subsequently hydrated with ethanol (two rounds of 5 minutes in 100% ethanol and one more in 70% ethanol) and running water for 5 minutes.
Next, antigen retrieval was performed in buffers previously optimized for the specific antibody, for 35 minutes in a vaporizer (at ~99ºC) or in the microwave during 10 minutes (see specific information for each antibody below). The slides were then left to reach room temperature.
After two washes with 0.1% (v/v) PBS-Tween solution (PBS [[Fisher Scientific, Hampton, New Hampshire, EUA]), always with agitation, the endogenous peroxidase was inactivated with 3% hydrogen
peroxide (H2O2 [Sigma-Aldrich®, St. Louis, MO, USA]) in methanol [VWR, Radnor, PA, USA] (1:10) for
45 minutes and then the slides were washed again two times.
The samples used for the Rorγt target and the ones that originated from the early-endpoint experiment were blocked for the endogenous biotin. This method was found to decrease the background noise since the detection system used is based on the binding of streptavidin to biotin conjugated with the secondary antibody. This was done by incubating in avidin block during 12 minutes, washing two times with 0.1% PBS-T, incubating 12 minutes in biotin block and washing again two times (avidin/biotin blocking system [Thermo Scientific, Waltham, MA, USA]).
The tissues were then surrounded with a hydrophobic pen and blocked with Ultravision Protein-Block solution [Thermofisher Scientific, Waltham, MA, USA] for 15 minutes at room temperature. After, the slides were incubated with the primary antibody in a humidified chamber either overnight at 4ºC, or 1 hour at room temperature. Negative controls were performed by incubating with the antibody diluent (Lab Vision™ Antibody Diluent OP Quanto [Thermofisher Scientific, Waltham, MA, USA]) without the primary antibody.
After this, the tissues were washed with 0.1% PBS-T (3 rounds, 10 minutes each). They were then incubated with secondary antibody (1:100 Swine Anti-Rabbit Immunoglobulins/Biotin [Agilent, Santa Clara, CA, USA] in the antibody diluent) for 30 minutes at room temperature, washed again (3 times, 5
minutes each) and incubated with streptavidin (Lab Vision™ Ready-To-Use Streptavidin Peroxidase
[Thermofisher Scientific, Waltham, MA, USA]) for 30 minutes at room temperature) and washed once more (3 times, 5 minutes each).
The slides were incubated with 1:100 3,3'-diaminobenzidine (Dako REAL™ Diaminobenzidine [Agilent, Santa Clara, CA, USA]) for 30 seconds and the reaction was stopped by washing in running water for 5 minutes. The slides were placed in a haematoxylin solution [Merck, Darmstadt, Germany] for 1 minute
13
in order to stain the cell nuclei (counterstain) and then washed with running water for 5 minutes. Slides were then dehydrated with ethanol (5 minutes in 70% ethanol and two rounds of 5 minutes in 100% ethanol solutions) followed by incubation in xylene solution (two rounds of 5 minutes), Finally, slides were mounted with DPX mounting medium [Sigma-Aldrich®, St. Louis, MO, USA] between the slide and the coverslip [Normax, Marinha Grande, Portugal]. Slides were then analysed under the optical microscope.
Different markers: CD3:
o antigen retrieval with EDTA buffer, pH8, in a steam device for 35 minutes o incubation with anti-CD3 antibody [Abcam, Cambridge, UK], 1:200, 1h at RT CD4:
o antigen retrieval with citrate based buffer, pH6, in a microwave for 10 minutes o incubation with anti-CD4 antibody [Abcam, Cambridge, UK], 1:200, overnight
at 4˚C CD8:
o antigen retrieval with Tris/EDTA buffer, pH9, in a steam device for 35 minutes
(some samples were processed with EDTA buffer and had higher background noise)
o incubation with anti-CD8 antibody [Abcam, Cambridge, UK], 1:2000, overnight at 4˚C
Rorγt:
o antigen retrieval with Tris/EDTA buffer, pH9, in a steam device for 35 minutes
o incubation with anti-Rorγt antibody [Abcam, Cambridge, UK], 1:3000, overnight at 4˚C
2.7. Cell counting
CD4+, CD8+ and Rorγt+ cells were counted in tumours and/or normal-adjacent tissue from each mouse
in the AOM+DSS+IL-17F/IFN-γ experiments. For this, an Olympus optical CX31RBSF microscope [Olympus, Shinjuku, Tokyo, Japan] and an Olympus DP25 digital camera [Olympus, Shinjuku, Tokyo, Japan] were used and 4 images were taken of the selected region using the Cell^B software [Olympus, Shinjuku, Tokyo, Japan]. Cells were counted using the ImageJ software [National Institutes of Health, Bethesda, MD, USA and the Laboratory for Optical and Computational Instrumentation (LOCI), University of Wisconsin, Madison, WS, USA]. This way, the numbers presented result from the average of 4 non-overlapping images taken of the area being analysed.
15
3. Results
3.1. Pilot experiment – C57BL/6 mice
A pilot experiment was performed on C57BL/6 mice, where treated animals received both AOM and DSS. This experiment was done in order to confirm that the dosages chosen were appropriate and to monitor the development of colonic lesions so that the suitable time to start the cytokine treatment in the following experiments and its frequency could be selected. By colonoscopy, it was assessed that a week after the first DSS cycle only 2 out of the 8 treated mice had tumours. However, after the second cycle, 5 out of 7 AOM+DSS treated mice had already developed at least one lesion visible through colonoscopy.
The weight of all the animals was measured throughout disease progression and is presented in figure 3.1 A and B. In figure 3.1 A, we can see that the weight of AOM+DSS treated female mice decreased concomitantly with the first two DSS cycles, whereas no decrease was observed in the non-treated females in those time intervals. However, only the second decrease in weight is statistically significant. The non-treated females seem to have a steady increase in weight over time, as would be expected of non-treated young mice. After the third DSS cycle, the treated female group weight starts to decrease. This also happens to the non-treated females, although earlier. For the AOM+DSS treated male mice (figure 3.1 B), similar decreases coincident with the first two DSS cycles were observed, even though only the first one was statistically significant.
After euthanasia, the spleen was removed and weighed (figure 3.1 C). The average weight of the spleen seems to always be higher in AOM+DSS treated versus non-treated mice for each sex, although this is not significant.
The large intestine was dissected and subjected to gross macroscopic examination: none of the non-treated) mice had any lesion whereas all the AOM+DSS treated mice developed lesions, with male mice having a tendency towards more lesions than the female mice (figure 3.1 D). In terms of tumour
area, it varied from 1.91 to 29.03 mm2 and no differences were observed between the two sexes (figure
3.1 E).
The number of lesions in each AOM+DSS treated mouse with area above or below the threshold of π
mm2 was counted and presented in figure 3.1 F. Interestingly, we could observe that male treated mice
had somewhat more large lesions when compared to treated females, although the number of small lesions was similar.
16
F e m a le s D a y s W e ig h t (g ) 0 2 0 4 0 6 0 1 8 2 0 2 2 2 4 N o n - tr e a te d A O M + D S S * D S S M a l e s D a y s W e ig h t (g ) 0 2 0 4 0 6 0 2 0 2 2 2 4 2 6 2 8 3 0 N o n - tr e a te d A O M + D S S **** D S S S p le e n w e ig h t (g ) N o n - t r e a t e d A O M + D S S N o n - t r e a t e d A O M + D S S 0 .0 0 0 .0 5 0 .1 0 0 .1 5 0 .2 0 0 .2 5 F e m a le s M a le s N u m b e r o f le s io n s F e m a le s M a le s 0 2 4 6 8 1 0 A r e a o f le s io n s ( m m 2) F e m a le s M a le s 0 1 0 2 0 3 0 4 0 N u m b e r o f le s io n s F e m a le s M a le s 0 2 4 6 A r e a > m m2 A r e a m m2 A C B F E DFigure 3.1. B6 mice treated with AOM and DSS. A/B. Weigh of female/male mice as a function of days since the
start of the experiment. AOM was administered on day 0 and the DSS cycles are marked as grey columns. Significant differences presented are in comparison to the previous time point. 2way ANOVA, Tukey multiple comparisons test. *, P < 0.05. ****, P < 0.0001. C. Spleen weight of the different groups, after necropsy. Kruskal-Wallis, Dunn's multiple comparisons test – no significant differences between any groups. D. Number of lesions in each treated mice. No non-treated mouse had any lesion. Mann-Whitney test – no significant differences between the groups. E. Area of all the lesions of the treated mice, independently of the mice they derived from. Mann-Whitney test – no significant differences between the groups. F. Number of lesions per animal with area higher than or smaller or equal to π mm2. Kruskal-Wallis, Dunn's multiple comparisons test – no significant differences between
17
3.2. Manipulation of inflammatory response – late-endpoint
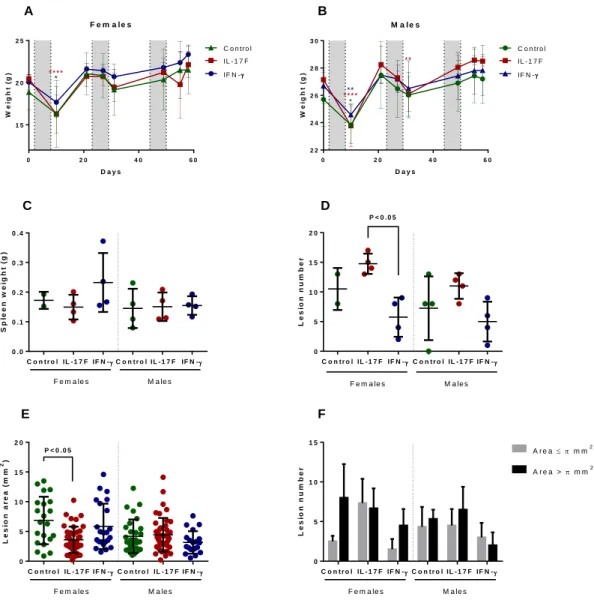
Mice were divided into 6 different groups by sex and treatment (control, IL-17F and IFN-γ). The treatment for all the animals followed the standard AOM+DSS protocol plus one of the cytokines (or saline solution in the control animals) administered by intraperitoneal injection. The cytokine treatment started 3 days before the second DSS cycle, with the frequency being 3 times a week. Two female mice from the control group did not resist the first DSS cycle, therefore diminishing that group to only two females. The weight of all the animals was monitored as disease developed and is presented in figure 3.3 A and B. All the animals in each graphic have similar weights and changes in weight over time. In females (figure 3.3 A), all mice have a decrease in weight during the first DSS cycle (only statistically significant for the IL-17F and IFN- γ groups) and have a non-significant decrease in weight during the second DSS cycle. After the second cycle, the weight increases steadily for all the mice except the IL-17F group, where we can observe a drop followed by an increase in weight just before euthanasia. In males (figure 3.3 B), all mice have statistically significant decreases in weight during the first DSS cycle, and the weight also decreases during the second DSS cycle (only significantly in the IL-17F group).
After euthanasia, the spleen of all mice was removed and weighed (figure 3.3 C). All groups have no significant differences between the values of the spleen weight. After removal and cleaning of the large intestine, it was opened and colonic lesions were counted by gross macroscopic evaluation (figure 3.3 D). No significant differences exist between the sexes for the same group.
The number of lesions in the IL-17F female group is statistically significantly higher than that number in the IFN-γ female group. None of these groups are significantly different from the control female group, even though the control group appears to have more lesions than the IFN-γ group but less than the IL-17F group.
Male mice had no significant differences between the 3 groups, even though the IL-17F group also seems to have higher lesion numbers than the IFN-γ group. The range of the control group, interestingly, is greater than that of the other two groups combined and is notably increased by a mouse that had no lesions at the time of euthanasia.
As for lesion area, all the values are represented in figure 3.3 E, irrespective of the mouse where the lesion was located. In females, the lesion area is significantly lower in the IL-17F group when compared
to the control group. It also appears to be lower when compared to the IFN- γ group, however this
difference is not statistically significant.
In male mice no significant differences existed between any of the groups, although a minor decrease in the lesion area is observed between the IFN-γ group and the two others. Between the sexes but for the same group no significant differences were found.
The number of lesions in each mouse with area above or below the threshold of π mm2 was counted
and presented in figure 3.1 F. No statistically significant differences were found, even if some apparent dissimilarities can be ascertained. In females, the IL-17F group seems to have the number of small lesions increased when compared to the other two groups. The IL-17F group is, indeed, the only female
18
group where the number of small lesions is similar to the number of large lesions. The IFN-γ group’s areas appear to follow the same trend of the control, but have less overall number of lesions. In contrast, all male groups have similar number of small and large lesions.
F e m a le s D a y s W e ig h t (g ) 0 2 0 4 0 6 0 1 5 2 0 2 5 IF N - IL - 1 7 F C o n tr o l * **** M a l e s D a y s W e ig h t (g ) 0 2 0 4 0 6 0 2 2 2 4 2 6 2 8 3 0 C o n tr o l IL - 1 7 F IF N - * ****** ** S p le e n w e ig h t (g ) C o n t r o l I L - 1 7 F I F N - C o n tr o l IL -1 7 F IF N - 0 . 0 0 . 1 0 . 2 0 . 3 0 . 4 F e m a le s M a le s L e s io n n u m b e r C o n t r o l I L - 1 7 F I F N - C o n tr o l IL -1 7 F IF N - 0 5 1 0 1 5 2 0 F e m a le s M a le s P < 0 .0 5 L e s io n a r e a ( m m 2) C o n t r o l I L - 1 7 F I F N - C o n tr o l IL -1 7 F IF N - 0 5 1 0 1 5 2 0 P < 0 .0 5 F e m a le s M a le s L e s io n n u m b e r C o n t r o l I L - 1 7 F I F N - C o n tr o l IL -1 7 F IF N - 0 5 1 0 1 5 A r e a > m m2 A r e a m m2 F e m a le s M a le s A F D C E B
Figure 3.3. AOM+DSS treated B6 mice were administered the cytokines IL-17F or IFN-γ. Cytokine treatment
performed 3 times a week and started before the second DSS cycle. A/B. Weigh of female/male mice as a function of days since the start of the experiment. AOM was administered on day 0 and the DSS cycles are marked as grey columns. Significant differences presented are in comparison to the timepoint where weight started to decrease. 2way ANOVA, Tukey multiple comparisons test. *, P < 0.05. **, P < 0.01. ****, P < 0.0001. The color indicates the group where the decrease in weight was statistically significant. C. Spleen weight of the different groups, after necropsy. Kruskal-Wallis, Dunn's multiple comparisons test – no significant differences between any groups. D. Number of lesions in each treated mouse. Kruskal-Wallis, Dunn's multiple comparisons test. E. Area of all the lesions of the mice who developed at least one lesion, independently of the mice they derived from. Kruskal-Wallis, Dunn's multiple comparisons test. F. Number of lesions per animal with area higher than or smaller or equal to π mm2. Kruskal-Wallis, Dunn's multiple comparisons test – no significant differences between any groups. Error bars
19
For each mouse, the distal region of the large intestine, where most of the lesions appeared, was
processed into FFPE blocks. After immunohistochemistry against CD4, CD8 and Rorγt, two different
tumours were selected to count positive cells. Immunohistochemistry of some samples was not ideal and, for this reason, some mice are not represented in these results or have only one tumour represented. For each tumour, a region with normal adjacent tissue was also selected.
The tumours and normal-adjacent areas were photographed at a magnification of 400x and counted
afterwards (figure 3.5, 3.6 and 3.7). The results of the CD4+, CD8+ and Rorγt+ cell densities in each
selected region for each group are presented in figure 3.4. A, B and C, respectively. For CD4+ cells, no
significant differences were found between the normal tissue and the tumour, as well as between the 3
different groups for each type of tissue (figures 3.4 A and 3.5). In the case of CD8+ cells (figures 3.4 B
and 3.6), the only significant difference found was between the normal tissue and tumour in the IFN-γ
group, even though the tumour appears to have a higher density of CD8+ cells than the normal tissue in
all the groups. In both cases, the densities for normal mucosa of three untreated mice was also represented so that it is possible to understand the baseline for these densities in strictly normal mucosa. No significant differences were observed between these non-treated mice and the other groups for the two types of cells, even though the densities seem to be inferior and have a lower dispersion in the
non-treated group. For the Rorγt+ cells (figures 3.4 C and 3.7), no significant differences were observed, but
the tumour always had higher cell densities when compared to the respective normal-adjacent mucosa. For the tumours, the IL-17F group appears to have a lower average density than the other two groups.
We then tried to determine if the density of either CD4+ or CD8+ in the tumours cells correlated with the
number of lesions that animal had. For the CD4+ cells (figure 3.4 D), a negative correlation seems to
exist for the IFN-γ group, even though it is weak (low R2). In the case of the IL-17F group, the correlation
is negligible. For CD8+ cells (figure 3.4 E), a correlation between their density and the lesion number of
the animal is negligible in all groups.
Furthermore, we confirmed if the ratio of the density of CD4+ cells by CD8+ cells in tumours correlated
with the number of lesions (figure 3.4 F). In this case, only the tumours that had been counted for both types of cells were taken into account and the ratio was calculated for each individual tumour. We
observe stronger correlations (higher R2) in both the IL-17F and the IFN-γ groups than seen before,
20
C D 4 + c e ll s /m m 2 C o n t r o l I L - 1 7 F I F N - N o tr e a tm e n t 0 1 0 0 2 0 0 3 0 0 4 0 0 T u m o r N o rm a l C D 8 + c e ll s /m m 2 C o n t r o l I L - 1 7 F I F N - N o tr e a tm e n t 0 1 0 0 2 0 0 3 0 0 4 0 0 T u m o r N o rm a l P < 0 .0 1 L e s io n n u m b e r C D 4 + c e ll s /m m 2 0 5 1 0 1 5 2 0 0 1 0 0 2 0 0 3 0 0 4 0 0 C o n tr o l IF N - R2 = 0 .2 9 4 IL - 1 7 F - R2= 0 .1 6 5 L e s io n n u m b e r C D 8 + c e ll s /m m 2 0 5 1 0 1 5 2 0 0 1 0 0 2 0 0 3 0 0 4 0 0 C o n tr o l - R2= 0 .0 7 3 IF N - R2 = 0 .0 3 7 IL - 1 7 F - R2= 0 .1 7 1 L e s io n n u m b e r R a ti o o f c e ll s /m m 2 (C D 4 +/C D 8 +) 0 5 1 0 1 5 2 0 0 2 4 6 C o n tr o l IF N - R2 = 0 .4 7 1 IL - 1 7 F - R2= 0 .5 3 7 A E F D B R o r t + c e ll s /m m 2 C o n t r o l I L - 1 7 F I F N - 0 5 0 1 0 0 1 5 0 N o rm a l T u m o r CFigure 3.4. CD4+, CD8+ and Rorγt+ cell densities in tumours from the AOM+DSS IL-17F or IFN-γ treated B6
mice. A. Density of CD4+ cells in normal tumour-adjacent tissue and dysplastic tissue. When possible, two areas
for each type of tissue were selected in each animal. Kruskal-Wallis, Dunn's multiple comparisons test – no significant differences between any groups. B. Density of CD8+ cells in the normal tumour-adjacent tissue and
dysplastic tissue. When possible, two areas for each type of tissue were selected in each animal. Kruskal-Wallis, Dunn's multiple comparisons test. C. Density of Rorγt+ cells in normal tumour-adjacent tissue and dysplastic tissue.
When possible, two areas for each type of tissue were selected in each animal. Kruskal-Wallis, Dunn's multiple comparisons test – no significant differences between any groups. D. Density of CD4+ cells in tumours in function
of the number of lesions in the corresponding animal. The R2 (coefficient of determination) for each group is
represented in the legend and is calculated from the Pearson correlation coefficient. E. Density of CD8+ cells in
tumours in function of the number of lesions in the corresponding animal. The R2 (coefficient of determination) for
each group is represented in the legend and is calculated from thePearson correlation coefficient. F. Ratio of the density of CD4+ cells by the density of CD8+ cells in each tumour in function of the number of lesions in the
corresponding animal. Only cases where the same dysplastic lesion was selected for both CD4+ and CD8+ counting
were selected. The R2 (coefficient of determination) for each group is represented in the legend and is calculated
21
Figure 3.5. Representative images of the immunohistochemistry against CD4 performed on tumours from the AOM+DSS IL-17F or IFN-γ treated B6 mice. The images were taken at an amplification of 40x while the
22
Figure 3.6. Representative images of the immunohistochemistry against CD8 performed on tumours from the AOM+DSS IL-17F or IFN-γ treated B6 mice. The images were taken at an amplification of 40x while the