Residence Time Distribution of Liquids in a Continuous
nbular Thermal Processing System
Part II: Relating Hold nbe Efficiency to Processing
Conditions
A. Pinheiro Torres” & F. A. R. Oliveirah*
“ Escola Superior de Biotecnologia, R. Dr. Antbnio Bernardino de Almeida. P-4200 Porto, Portugal
“Instituto Inter-Univcrsitkio de Macau. Palricio da Penha, Macau (Received 16 June 1997: acccptcd Ii December 1997)
ABSTRACT
The concept of efficiency of a holding tube is essential to guarantee the safety of continuously processed fluid foods. A good prediction of efficiency allows a better control of the processing conditions, guaranteeing product safety while decreasing product quality losses due to overprocessing. Different published methods were compared to data obtained in this work and to reported data, to assess their ability to predict tube efficiency in a range of Reynolds number (Re) covering laminar; transient and turbulent flow. Furthermore, a model assuming dispersed plug flow and a power-law relation between Peclet number (PC) and Re was developed and evaluated. Published models were shown to be, in general, conservative for both laminar and turbulent flow, but often overpredicted the experimental efficiency in the zone of 2100 < Re <4000. Deviations between predicted and experimental values were very considerable (errors from -25% to 90%). The model proposed has proved to be conservative over the whole range, but more accurate (errors ~tp to 15Vrj). 0
1998 Elsevier Science Limited. All rights reserved
NOMENCLATURE
d Diameter (cm)
D Axial dispersion coefficient (m2/s)
*Author to whom correspondence should bc addressed. Fax: 00 853 970 327; e-mail: t’ernan- da@iium.edu.mo
166 L In ,172 ’ n Pe
Q
Re RTD t twin T V V C G,p +Cd 11 0 P TA. Pinheiro Torres, F: A. R. Oliveira Length (m)
Exponent for the velocity distribution Flow behaviour index, dimensionless Peclet number (Pe = vL/D)
Flow rate (l/h)
Reynolds number (Re = pvdlp) Residence time distribution Time (min)
Minimum residence or holding time (min) Temperature (“C) Velocity (m/s) Volume (I) Efficiency (t: = tmin/t) Experimental efficiency Predicted efficiency Viscosity (poise) Time, dimensionless (0 = t/r) Density (kg/m’)
Mean holding time (T = V/Q) (min)
INTRODUCTION
The theory of residence times may be readily adopted to determined sterilisation efficiency in continuous thermal processes, thus guaranteeing that the main design objective - product safety - is attained. This concept was first applied to commer- cial equipment for processing food products in the late 1960s. Rao and Loncin (1974) Lin (1979) and Pinheiro Torres and Oliveira (1998) presented reviews on studies of tube efficiency in continuous thermal processing. The efficiency of a hold tube (2:) is defined as (Rao & Loncin, 1974):
frnir, I’= -
(1) z
where tmin is the minimum holding or residence time of the fluid in the tube. Several studies determining tmin of fluids in holding tubes may be found in the literature (Jordan et al., 1949; Jordan & Holland, 19.53; Dickerson et al. 1968; Kaufman et al., 1968; Scalzo et al., 1969; Edgerton et al., 1970; D’Aoust et al., 1987; Rodrigo et al., 1990; Sancho & Rao, 1992). These studies analysed a variety of products, namely water, sucrose and guar gum solutions, milk and egg products, and crushed tomato. Pinheiro Torres and Oliveira (1998) reviewed tested products, experimental methods and operating conditions used in the different works. Some authors studied the effects of processing conditions on t,i” or the corresponding holding tube efficiencies: Scalzo et al. (1969) verified that t,i” of different egg products decreases with increasing viscosity (corresponding to a decrease in hold tube efficiency); Dickerson et al. (1968) analysed various milk products and holding tubes and con- cluded that t,i, is related to tube diameter, tube length and number of bends and to product viscosity; Edgerton et al. (1970) related effects of excess pressure and temperature to maximum velocity in a hold tube and compared experimental t,i, to
Relating RTD to processing conditiotrs - II I 67 predict values (Nikuradse, 1932) concluding that a positive deviation of experi- mental results could be observed, which increased with the Reynolds number (Re). All these experimental findings indicate a possible relation between tube efficiency and Re.
Although some authors advise the experimental determination of t,,,,, (Jordan et al., 1949; Anon., 195(I), others propose different conservative models for calculating t,,,i,, from mean holding times in the holding tubes (t), which depend on whether laminar or turbulent flow conditions are observed. Table 1 summarises published models for Newtonian fluids, though models for pseudoplastic fluids are also avail- able (Pinheiro Torres & Oliveira, 1998). Values for tube efficiency are never below 0.5 for Newtonian fluids in laminar flow while values below 0.5 may be found for dilatant fluids (Rao, 1973). In turbulent flow, the predicted efficiency is always above 0.78. According to Pinheiro Torres and Oliveira (1998) these models yield in general results showing positive deviations from experimental data, while being dependent on the flow regime (relative deviations ~2.4% for turbulent, ~5%. for transient and ~22% for laminar flow).
The objectives of this work were: (i) to assess the accuracy of published models for the prediction of tube efficiency in a range of Re covering high laminar and low turbulent flow, (ii) to develop and evaluate a model able to yield conservative yet accurate predictions, based on the relation between flow properties (Peclet number. Pe) and process parameters (Re) and (iii) to apply this model to select processing conditions that guarantee product safety while reducing overprocessing, thus improving quality.
TABLE 1
Models for Predicting Minimum Holding Times for Newtonian Fluids
Laminar flow 0.5 T None so Dickerson et rrl.
(I’)#) Rao & L,oncin
(1974u) Turbulent and/or (OC% log Re+()+h2)~ Re > 4000 and 78-87 Edgerton rf ul.
transient flow 1 <d (cm)<lO ( 1970)
04T None 80 Rao & L,oncin
2/(l +t'?l')/(2+WZ')T 2m’/(m+1)/(2m+l)r (1974) 2 100 < Re < 12 000 88-97 Nassauer & WOY > m’ > 0.02 Kessler I 2 000 < Re < 20 000 97 (lY7Y) 07’ = 0.02
4000 < Re < 2E6 79-80 Sancho iyr Rao (1992) nr = exponent for the velocity distribution.
168 A. Pinheiro Torres, F: A. R. Oliveira MATERIAL AND METHODS
Residence time experiments were conducted in a continuous thermal processing pilot plant (Pinheiro Torres & Oliveira, 1993) according to the methods described in Part I (Pinheiro Torres et al., 1998). Additional replicates were conducted in order to increase the statistical significance of the results. A total of 110 experiments was analysed.
Mean holding times, z, and Re were calculated for each processing condition, as described in Part I. Re values between 1350 and 9700 were obtained, thus covering a range of laminar, transient and turbulent fluid flow. Minimum residence times (tmin) were determined when absorbance reached values of 0.001 to O-004, corre- sponding to the first 0.03-0.05% of fluid exiting the test area. The corresponding efficiency was then calculated using eqn (1). Experimental results where the mean holding time r differed significantly from the mean residence time estimated from the RTD curve (errors above 10%) were rejected, as this indicated that a channel- ling in the fluid circuit might have occurred.
RESULTS AND DISCUSSION
Evaluation of published models predicting tube efficiency
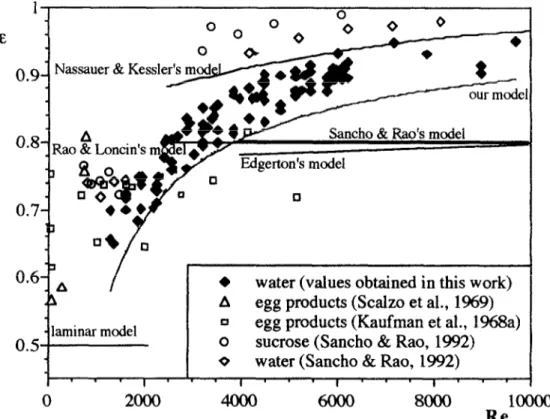
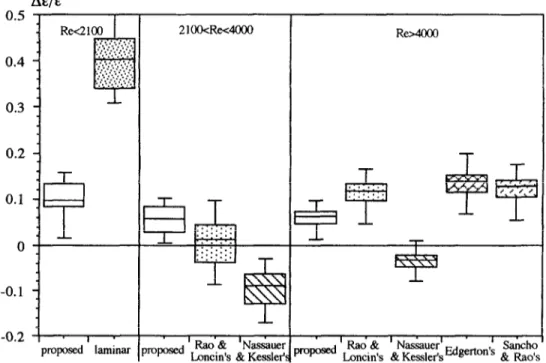
Figure 1 shows efficiency values calculated from our experimental data, as well as efficiencies reported in the literature or evaluated from reported data (Newtonian fluids only were considered); values predicted with published models (see Table 1) are also included. It should be stressed that the reported models were developed assuming fully developed flow in straight tubes. In a real situation this is often not the case in a considerable part of the tubes, and furthermore the pipe bends influence the flow: streamlines are broken and more turbulence is therefore pro- moted, inducing a higher mixing of fluid and thus a higher efficiency. This may partially explain why all models predict little or no effect of Re in a given flow regime, while a significant effect of Re on experimental efficiency values can be observed. Figure 2 shows the relative deviations between our experimental results and the predicted values, (E,,,, - E~~~~)/E~,.~~. Underprediction of the experimental efficiency (positive relative deviation) is desirable as this yields a conservative result in terms of safety of the process.
Figures 1 and 2 show that in the laminar regime (Re<2100) the model for laminar flow predicts conservatively our experimental results, with relative devia- tions between 0.31 and 0.50. In turbulent flow (Re > 4000) Rao and Loncin’s, Edgerton’s and Sancho & Rao’s models also show conservative predictions with relative deviations up to O-20, whereas Nassauer and Kessler’s model in general overpredicts our experimental efficiency (relative deviations down to -0.09). In the transition zone (2100 <Re <4000), where flow shows both laminar and turbulent characteristics (Bird et al., 1960), none of the reported models (Rao & Loncin’s and Naussauer & Kessler’s) guarantees conservative predictions of the experimental results (relative deviations down to -0.09 and -0.17 respectively). In terms of the experimental data reported in literature, it was found that the predicted values are, in general, conservative both in the laminar and in the turbulent regime, though the relative deviations are high: up to 0.52 in laminar flow and 0.24 in turbulent flow.
Relating RTD to processing conditions - II 169 On the other hand, efficiencies predicted for egg products in the transition flow regime were underestimated, with relative deviations down to -0.09. Furthermore, a larger scatter of the experimental data was observed, which may be due (i) to the influence of the different methods used for tracer detection and (ii) to the methods used for the calculation of the mean holding times. In fact, insufficient sensitivity of the tracer detection method (Jordan et al., 1949; Jordan & Holland, 1953) will lead to a delay in the measurement of t,i, and thus larger efficiencies are calculated. On the other hand, an excessively sensitive detection method will give a value of t,,,, corresponding to an infinitesimal amount of fluid first exiting the test area, which may not be significant for guaranteeing the safety of the product. From Fig. 1, two clusters of data can be distinguished: data from Sancho and Rao (1992) for water and sugar solutions, and data for egg products showing Newtonian flow behaviour (Kaufman et al., 1968; Scalzo et al., 1969); this suggests that the tracers used in egg products might have quite a different detection level than the salt conductivity test used in the other model fluids.
To illustrate the effect of different tracer detection levels on efficiency determina- tion, efficiencies were simulated from theoretical RTD curves, based on the dispersion model. Different percentages of fluid were considered as the ‘minimal
Jassauer & Ke;
A
.a0 & Loncin’s
7
Edger-ton’s model 0 0 0 R&s model 8 our - moden*
0 :, /0.6- ~ l water (values obtained in this work) A egg products (Scalzo et al., 1%9) - laminar model a egg products (Kaufman et al., 1968a)
0.5 0 sucrose (Sancho & Rao, 1992) 0 water (Sancho & Rao, 1992)
I ” ’ I ” ’ I m * ‘I’ m ’
0 2000
8ooo
10000Re
Fig. 1. Comparison between experimental tube efficiency and values estimated by both published models and the model proposed in this work.
170 A. Pinheiro Torres, l! A. R. Oliveira
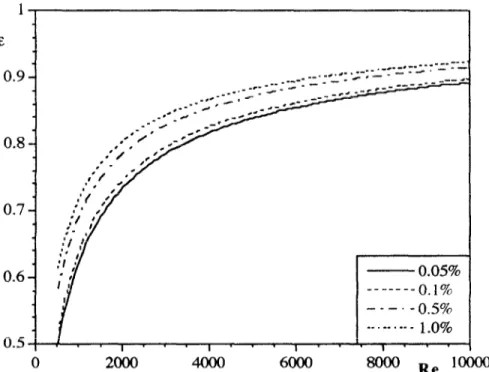
amount of fluid’ first exiting the tube required for the tracer to be detected, corre- sponding to the first 0.05, 0.1, 0.5 and 1.0% of the cumulative RTD curve. Increasing percentages correspond to situations where tracer detection becomes less sensitive, thus a higher amount of tracer is needed for detecting tmin. Fig. 3 shows how the different fluid percentages considered (corresponding to different limits in tracer detection) affect the calculated efficiency for the same RTD curve (charac- terised in the dispersion model by Pe).
Different methods may be used to calculate the mean residence time: directly from the processing conditions (tube volume and flow-rate) or from the statistical analysis of the RTD curve. Sancho & Rao (1992) reported differences up to 29% when using these two methods for calculating tube efficiency. These differences are expected to some degree in non-ideal RTD models (Levenspiel, 1972) and often result from errors due to tailing of RTD curves (Pinheiro Torres & Oliveira, 1998).
Development and evaluation of a model based on the relation between flow properties and process parameters
Assuming that RTD may be described by the dispersion model, characterised by the Peclet number (Pe), process parameters were related through Re to the flow condi- tions in the system in Part I of this work (Pinheiro Torres et al., 1998):
0.5 0.4 0.3 0.2 0.1 0 -0.1 -0.2 ALE/E . Re-2100 P .,.:..,.:‘..:.:.:: : ,... :: . . . . :...:;.:..: . . . :..,: ..,. .>... .:...: . . . :., :, : . . .: . . . f : r’ : . . : _L I . pIOposed ’ laminar 21okRe4ocm
3
I::::....
.
.
f3-
.i.;.: : :.I.::;:e
,posedkao& 'NassanerLmcin’s & Kessler?
_L
Fig. 2. Box and Whisker plot, displaying the inter-quartile range, (Cleveland, 1993) for relative errors in predicting efficiencies measured in this work, using both the proposed and
i
2.9 x lop5 x Re”” Rec3.300 Pe=
0.016 x Re’ ” Re < 3300 (2) Efficiencies were calculated for different Pe values, by modelling RTD and consider- ing A,,,,, as the time when the first 0.05% had just come out of the tube. It was found that these values could be related to Re by the following empirical equation:
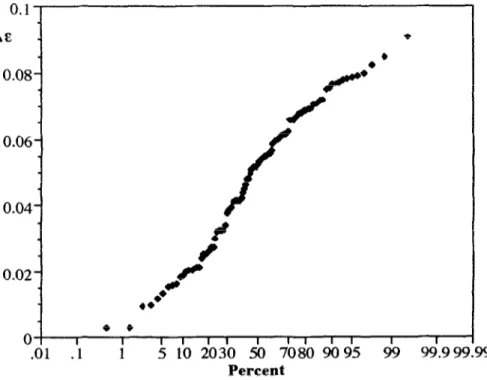
I: pred = 1 -(55.9 k 1 .9)Re’ pO’hX1 ’ (‘-““” C.3) This equation allows the prediction of tube efficiency directly from processing condi- tions and may be applied to the whole range of Re tested in our work, independently of the flow regime (1350 < Re ~9700). This model was also included in Fig. 1 and it can be seen that, besides describing reasonably well the effect of increasing Re, it conservatively predicts our experimental efficiency data, as might be expected (see Fig. 2): when modelling the RTD curves in Part I, the estimation method for the model parameter (Pe) was selected so that the model would bc conservative when applied to predict the extension of reaction. Figure 4 shows the probability plot of the residuals between our experimental data and our model, and it can be seen that thev follow a normal distribution. 2 centred in an absolute error of 0.049. 1 E 0.9 - - 0.05% --_____O.I% ---. - 0.5% __.__.._ _ 1.0% I’ ’ - 1’ - - I * * * I’ * * 0 2ooo 6000
8000
ReIO000
Fig. 3. Analysis of the effect of the sensitivity of tracer measurement on the estimated efficiency (the values refer to the percentage amount of tracer exiting the system necessary
172 A. Pinheiro Torres, EA. R. Oliveira
When comparing experimental data reported by other authors to efficiencies predicted by our model (see Fig. l), it was concluded that the model is also conservative and more accurate than the other models. An exception was observed for some data from Kaufman et al. (1968), that may be justified by the previously discussed sources of experimental errors.
Application of our model to selection of processing conditions
The model proposed above can be directly applied in the design, evaluation and optimisation of continuous thermal processes. The required tmin selected for ther- mally processing a given product at a temperature T, on the basis of safety requirements, initial microbial load and microbial death kinetics, determines the flow rate to use in a thermal processing system with a given tube length. Figure 5, that was created based on eqn (3), allows for a straightforward selection of flow- rate, if the characteristics of the product at the processing temperature (density, PT, and viscosity, p-r) and the dimensions of the hold tube (diameter, d, and length, L) are known.
From these data, the values of the X- and Y-axis in Fig. 5 can be calculated as:
0.1 AC - . 0.08- /’ 0.06- l l 0 I I II II I II II I I .Ol .l 1 5 10 2030 50 7080 90 95 99 99.99999 Percent
Fig. 4. Probability plot for the absolute deviations between experimental and predicted (proposed model) efficiency values.
Relating RTD to processing- conditions - II 173 t min 4 3 2 1 5oooo 6oooo Re t; 6 I
I
t min - 5- 4- 3- 2- I- -l 0; I. I, rn. I, I,, , , , , , , , , 10 2ooo 6oQo 8000 loo00
Re t
Fig. 5. An example of selection of adequate mean holding times for different process requirements (a) for the whole range of Rer studied, and (b) for low values of Ret.
174 A. Pinheiro Torres, F A. R. Oliveira
Y = tmin
(5)
The point of interception of the values of the coordinates in Fig. 5 with the lines of mean holding times will indicate the lowest mean holding time required to guaran- tee the product safety. This holding time, when compared to the one that would be selected by the conventional methods (e.g. mean holding time calculated as twice the t,i,) will reduce overprocessing thus improving the product quality.
As an example, if a given aseptic process is defined so that the X-value can be calculated as being Rer = 20000 (e.g. pasteurisation of beer at 72°C or sterilisation of tomato paste at 108”Q product safety is guaranteed at the predetermined processing temperature t,i” = 3.4 min. A conservative prediction assuming laminar flow would lead to a mean holding time of z = 68 min, which corresponds to Re = 2940 (roughly laminar flow). However, Fig. 3 indicates that for X= 20000 and Y= 3.4 min, a minimum mean residence time of z = 4 min would be sufficient to guarantee product safety. Furthermore, the corresponding Re = 5000 =X/z indicates that this new prediction is within the range of Re for which the model in eqn (3) is conservative. Running the aseptic process equipment for z = 4 min instead of r = 6.8 min will still guarantee a safe product, but with increased quality (e.g. increase of 13% for a quality factor with rate constant of 0.05 min-’ at the given processing temperature, or 43% for a rate constant of 0.02 min-‘), as it will suffer a lower mean processing time. Additionally, a higher production rate may be achieved.
CONCLUSION
Most published models for predicting efficiency are conservative both for laminar and turbulent flow regimes but show deviations up to 0.50 and 0.20, respectively. In the transition zone of 2100 <Re ~4000 the proposed models are in general non- conservative (relative deviations down to -0.17). The model developed in this work, based on the relation between flow properties (Pe) and process parameters (Re), was found to yield conservative although more accurate predictions (errors up to 0.15) in the whole range of Re tested (1350 to 9700). This model allows for the specification of processing conditions that would lead to reduced overprocessing, when compared to the methodologies usually applied.
ACKNOWLEDGEMENTS
The first author is grateful to JNICT (Junta National de Investigaccao Cientifica e Tecnologica Programa Ciencia e Programa Praxis XXI) for financial support.
Relating RTD to processitzg conditions - II 175 REFERENCES
Anonymous (1950). Standard method for determining the holding time of HTST pasteurizers by means of the salt conductivity test. Journal qf Milk atzd Food Technology, 13, 26 l-265 Bird. R. B., Stewart, W. E. & Lightfoot, E. N. (1960). Transport Phetzometzu. Wiley. New
York.
Cleveland, W. S. (1993). Visualisitzg Data. Hohovet Press, New Jersey.
D’Aoust, J.-Y., Emmons, D. B., McKellar, R. et al. (1987). Thermal inactivation of Salmon- ella species in fluid milk. Journal of Food Protection. 50(6), 494-501.
Dickerson, R. W., Scalzo, A. M., Read, R. B. CG Parker, R. W. (1968). Residence time of milk products in holding tubes of high-temperature short-time pasteurizers. Jorrr,nai ot’ Da@ Science, 51(4), 1731-1736.
Edgerton, E. R., Jones, V. A. & Warren, J. A. (1970). Holding-time measurement in an ultrahigh-temperature, direct-steam-injection system. Trunsac~iotzs of the AS’AE, 13, 695-698.
Jordan, W. K. & Holland, R. F. (1953). Studies on thermal methods for measuring the holding time in HTST pasteurizers. Joumul qf Milk and Food Technology, 16(I), 15-21. 25. Jordan, W. K., Holland, R. F. & White, J. C. (1949). The determination of the holding time
in HTST pasteurizing units. Journal
of
Milk and Food Technology, 12(2), 87-92.Kaufman, V. K., Ijichi, K. & Putnam, G. W. (196X). Flow characteristics in holding tubes of commercial egg pasteurizers. Journal of Milk and Food Technology, 31(Y), 269-273.
Levenspiel, 0. (1972). Chemical Reaction Engineering. 2nd edn., Wiley, New York.
Lin. S. H. (1979) Residence time distribution of flow in a continuous sterilisation process.
Process Biochemistry, 14(7), 23-27.
Nassauer, J. Cyr Kessler, H. G. (1979). Zur Berechung der Verweilzeitverteilung in cincl Rohrleitung mit Armaturen. Milchwissenschqfi. 34(4), 193-196.
Nikuradse, J. (1932). Gesetzmtissigkeiten der turbulenten Striimung in glattcn Riihrcn.
Fotxh. Geh. Itzg. Wes., B-1932(356) (referred to by Edgerton et al., 1970).
Pinheiro Torres, A. & Oliveira, F. A. R. (1993). Design of a continuous thermal processing unit for simultaneous study of residence time and temperature distributions of foods. No. 12.8 in 3rd Conference of Food Engineering (CoFe’Y3), Chicago, Illinois. 21-24 February 1993.
Pinheiro Torres. A. & Oliveira, F. A. R. (1998). Residence time distribution studies in the continuous thermal processing of liquid foods: a review. Journal of Food Etzgineeritzg (in press).
Pinheiro Torrcs, A., Oliveira, F. A. R. & Fortuna, S. P. (lYY8). Residence time distribution of liquids in a continuous tubular thermal processing system. Part I: Relating RTD to processing conditions. Journal of Food Engineering, 35, 147-163.
Rao, M. A. (1973). Sizing holding tubes of HTST pasteurizers for power law food products.
Jourtzul of’ Milk and Food Technology, 36(3), I8 1 - 188.
Rao, M. A., & Loncin. M. (1974). Residence time distribution and its role in continuous pasteurization (Part I). Lehetzsmirtel- Wissensclzufr and Techtzologie, 7 (l), l974u, S- 13. Rodrigo, M., Martinez, A.. Sanehes, Y., Treama. J. & Gimez, V. (1990). Determination ot
hot-fill-hold-cool process specifications for crushed tomatoes. Journal qf Foocf Scivme. S(4), 1029-1032, 1038.
Sancho, M. F. & Rao, M. A. (1992). Residence time distribution in a holding tube. Joartzal of Food Engineering, 15(l), 1- 19.
Scalzo, A. M. etal., (1969). Residence times of egg products in holding tubes of egg pastcur- izers. Food Technology, 5(23), X0-83.