Radiographic image quality after interruption of
the ixing stage to view the image with a viewbox
Qualidade da imagem radiográica quanto ao tempo de leitura
em negatoscópio com interrupção da etapa de ixação
Anna Débora Araújo Lourenço a
Andréa dos Anjos Pontual b
Márcia Maria Fonseca da Silveira c
Maria Luíza dos Anjos Pontual d
a Department of Clinic and Social Dentistry, School
of Dentistry, Federal University of Paraíba, João Pessoa, PB, Brazil
b Department of Oral Diagnosis, School of Dentistry,
Pernambuco University-UPE, Camaragibe, PE, Brazil
c Semiology Course, School of Dentistry, Per-
nambuco University-UPE
d Department of Clinic and Social Dentistry, School
of Dentistry, Federal University of Paraíba, João Pessoa, PB, Brazil
Correspondence:
Maria Luiza dos Anjos Pontual
Rua Guerra de Holanda, 79 - Casa Forte Recife, PE – Brasil
52061-010
E-mail:[email protected]
Received: June 6, 2009 Accepted: November 16, 2009 Abstract
Purpose: To evaluate the quality of radiographic images with regard to the time during which the fixing stage was interrupted to allow a preliminary reading of the image in the viewbox. Methods: Radiographs were taken with 130 Insight® periapical films, including a step-wedge
and lead plate. The films were distributed into 13 groups according to the time taken for reading in a viewbox: 0 (control), 40, 50, 60, 70, 80, 90, 100, 110, 120, 130, 140 and 150 s. During processing using the temperature-time method, the films in the experimental groups were removed 5 s after immersion in the fixer, placed against the light of a viewbox for the studied times and then re-immersed in the fixer to complete the fixation process. Base-plus-fog density and the densities of the first and last degree of the step-wedge were measured immediately and after six months to calculate the contrast.
Results: There were no significant differences with regard to the base-plus-fog density or the contrast values of the experimental groups when compared with the control group.
Conclusion: It was concluded that interrupting the radiograph fixation process to read the image in a viewbox does not interfere with the base-plus-fog density or with the radiographic contrast, even six months after they were taken.
Key words: Quality control; Dental Radiology; chemical process; densitometry
Resumo
Objetivo: Avaliar a qualidade da imagem radiográfica quanto ao tempo de leitura em negatoscópio com interrupção da etapa fixação.
Metodologia: Foram radiografados 130 filmes periapicais Insight® com um penetrômetro e
placa de chumbo. Os filmes foram distribuídos em 13 grupos de acordo com o tempo de leitura em negatoscópio: 0 (controle), 40, 50, 60, 70, 80, 90, 100, 110, 120, 130, 140 e 150 s. Durante o processamento pelo método temperatura-tempo, nos grupos experimentais, após 5 s de imersão no fixador, os filmes foram removidos, postos contra a luz de um negatoscópio durante os tempos estudados e imersos no fixador para completar o processo de fixação. Foram mensuradas, imediatamente e após seis meses, as densidades base e velamento e as densidades do primeiro e último degrau do penetrômetro para o cálculo do contraste. Resultados: Não houve diferença significativa em relação aos valores de densidade base e velamento e de contraste das radiografias dos grupos experimentais comparando-os com o grupo controle.
Conclusão: Concluiu-se que, durante o processamento das radiografias, os tempos de leitura em negatoscópio não interferiram na densidade base e velamento, nem no contraste radiográfico, mesmo após seis meses de seu arquivamento.
Introduction
The radiographic exam is widely used in dentistry and is a highly relevant complementary exam (1). Radiographic diagnosis complements the clinical examination and helps to resolve diagnostic doubts, allowing the professional to plan treatment more safely; radiographs can also be used in follow-ups and as documentation (2). Radiographic images are important for the diagnosis of pathologies and anomalies in addition to conirming the integrity of hard tissues in the mouth, and radiography is often the only means to detect any alteration that may be present (3). For this purpose, the radiographic technique needs to follow a strict sequence of stages that begin with the correct exposure and end with inal drying (4).
Radiographic processing is the general term used to describe the sequence of events required to convert the latent image contained in the sensitized emulsion of the radiographic ilm into a real and permanent radiographic image (5). Radiographic processing consists of chemical treatment of the ilm (6) that enables the permanence of the image on the ilm so that it can be adequately interpreted
(7).This processing must be performed under controlled
and standardized conditions, with redoubled attention to details (5).
Some areas in dentistry, such as oral surgery and endodontics, require radiographs as soon as possible, and for this reason, many stages of the correct radiographic processing are neglected, particularly regarding ilm ixation (7).It is not unusual to see professionals taking the radiographic ilm out of the ixer solution before the ixation process is completed, and taking the radiograph to the viewbox for interpretation. This procedure may cause an alteration of the diagnostic validity of the radiograph immediately or a certain time after it has been taken, compromising the legal value of the radiograph image. Furthermore, poor quality of a radiograph may require the dental professional to obtain a new radiograph, resulting in unnecessary exposure of the patient (8).
The literature on this topic is scarce. Araújo et al. (9) studied the inluence of variations of the ixation process on the quality of the image. The authors veriied that a 30-s interruption in the ixing process of radiographs after ixing had been in progress for 5, 10, 20, 30, 40, 50 and 60 s did not interfere with the base-plus-fog density or the contrast of the radiograph.
Therefore, the aim of this study was to evaluate the quality of the radiographic image with regard to the amount of time spent observing the radiograph after 5 s of initial ixation. The quality was assessed both immediately and after six months.
Methodology
A total of 130 Insight® periapical ilms were used, with
sensitivity E/F, size 2 (Eastman Kodak Company, Rochester, USA), within the period of validity. The ilms were exposed by using a 70X dental X-ray appliance with total iltration equivalent to 2.5 mm of aluminum (Dabi Atlante, São Paulo, Brazil) operating at 70 kVp and 8 mA. For these exposures, a standardizing device was used to allow a constant perpendicular incidence of the X-ray beams on the ilm and on the objects to be radiographed, in addition to maintaining a constant focus-ilm distance of 30 cm.
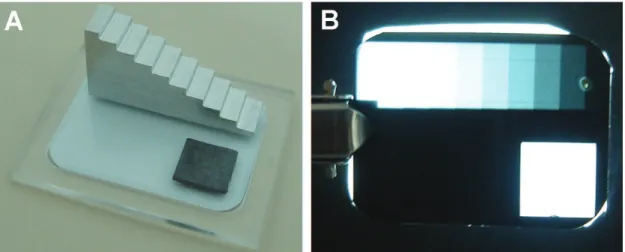
First, the exposure time was selected, in which an aluminum density scale with 10 degrees (Fig. 1) and each degree had 2-mm thick increments and were radiographed with exposure times of 0.2, 0.3, 0.4, 0.5, 0.6, 0.7, 0.8, 0.9 and 1.0 s. After these exposures, radiographic processing was performed manually using the temperature-time method. The ilms were processed individually and in a completely opaque portable dark chamber (Del Grandi, Ribeirão Preto, São Paulo, Brazil) using solutions ready for use (Kodak, Eastman, Rochester, USA), a chronometer and an immersion thermometer. At the time of processing, the solutions were at a temperature of 25ºC, and based on the table provided by the ilm manufacturer, ilm immersion times in the developer and in the ixer were 3 and 4 min, respectively.
The degree of image density corresponding to the ifth degree of the radiographed scale was measured by means of a densitometer (MRA, São Paulo, Brazil). The time selected was that at which the radiograph obtained the image density closest to 1, with the time 0.7 s being chosen.
After selecting the exposure time, radiographs of the density scale and a lead plate were taken with 130 ilms, under the same standardized conditions described above. After this, the radiographic ilms were randomly divided into equal groups according to time in which they would remain out of the ixer after initial ixation of 5 s, these times being 40, 50, 60, 70, 80, 90, 100, 110, 120, 130, 140 and 150 s out of the ixer. In the control group, the radiographs remained in the solution during ixation. Therefore, a total of 13 groups were assessed, including 12 experimental groups and 1 control group.
Radiographic processing of the 130 ilms occurred in a standardized manner as described above in the selection of the exposure time. The radiographic ilms of the control group were processed without interrupting the ixing process. In the other groups, after intermediate washing, the ilms were immersed in the ixing solution for 5 s, removed from the ixer and placed against the light of a 600 lux viewbox (Miolight, São Paulo, Brazil) with a mask. According to the group they belonged to, they remained out the ixer for 40, 50, 60, 70, 80, 90, 100, 110, 120, 130, 140 or 150 s (Fig. 2), respectively.
After the interruption in the ixing process, the ilms were again immersed in the ixer to complete the 4-min ixation process. It is important to emphasize that the solutions used were changed after each group was processed to avoid the interference of other factors related to the processing solutions and also to enable the groups to have similar assessment conditions.
Immediately after obtaining the radiographic images and after a period of six months, the optical densities of the 2-mm and 20-mm steps and the base-plus-fog density were measured by means of a digital densitometer (MRA, Ribeirão Preto, SP, Brazil). According to the optical densities obtained, the radiographic contrast of each ilm was calculated by using the following formula according to Price’s methodo- logy (10):
C = (D2 – D1 ½)
/
(D2 + D1)
where D2 corresponds to the density of the densest area
(2 mm step) and D1 is equivalent to the least dense area
(20 mm step) (10).
Once the contrast and the base-plus-fog density values of the radiographs were obtained for each group, they were tabulated in the program Microsoft Ofice Excel 2003 and submitted to statistical analysis at a level of signiicance of 0.05, using Minitab 14 and Stata 9.2 software. The data were summarized by the usual measures of location and dispersion. Variation of base-plus-fog density and radiographic contrast values among the groups (identiied according to time of reading the radiographs in the viewbox) were assessed by the
adjustment of a linear regression model. The intensity of the linear association between the viewbox time and density or contrast was assessed by Pearson’s correlation coeficient.
Results
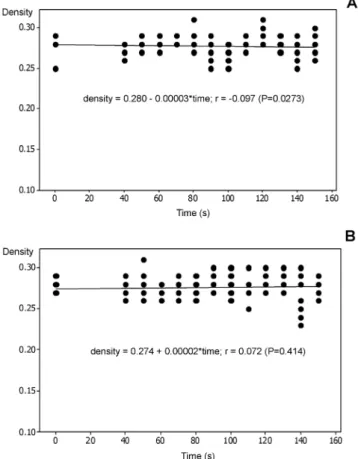
Figure 2 shows the mean distribution and standard deviation of the base-plus-fog density values according to the viewbox observation times studied. There was no signiicant variation in relation to the time the radiograph was exposed to light in the viewbox immediately after 5 s of ixation (P=0.273).
After the radiographs had been iled for six months, there was no signiicant variation among the base-plus-fog density
means of the groups of radiographs studied (P=0.414)
(Fig. 2B).
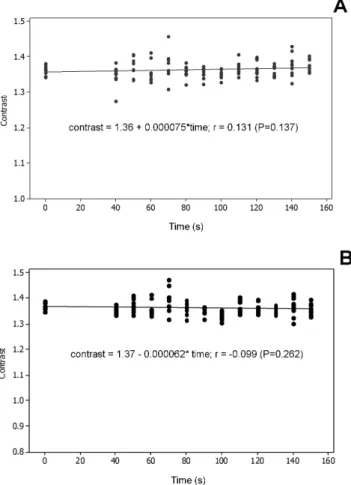
Figure 3A shows the radiographic contrast values measured immediately after processing the ilms. There was no evidence to reject the hypothesis that the contrast values were
stable during the interval of observation time (P=0.137).
Figure 3B shows the distribution of contrast values of the studied groups after the radiographs had been iled for six months. Although the slope of the adjusted straight line was negative, the association with the observation time was not signiicant (P=0.262).
Fig. 2. Mean and standard deviation of the base-plus-fog density
values: (A) immediately after the radiographic processing of the
Discussion
A radiograph image of good quality should display the maximum amount of detail, moderate contrast and density, and minimal distortion (11-13). All the steps involved in obtaining a radiographic image must be followed carefully. Although radiographic processing is considered an easy step, it is responsible for a great number of radiographic failures (3,13). Not only are errors resulting from this step the most frequent, but they are also the easiest to avoid (14). Previous studies have shown that radiographic failures may result in incorrect diagnoses, repetition of exams, additional costs, waste of time and an increase in the dose of ionizing radiation delivered to the patient (8,13,15). Therefore, it is important to have quality control to avoid these failures (16) and, consequently, unnecessary repetitions (12).
One should comply with all of the manufacturer’s technical recommendations regarding the ilm immersion time in the processing solutions (17). There still is controversy about the adequate time during which the radiographic ilm should be kept immersed in the ixing solution. This time must correspond to twice the amount of time required for the milky image to become transparent, which occurs in around 8 to 10 min (5,12). However, according to the radiographic
ilm manufacturer, immersion from 2 to 4 min in the ixing solution is recommended.
The type of analysis made by means of the ilm densities is denominated objective analysis (18). Base-plus-fog density is represented by the optical density inherent to the radiographic ilm offered by the manufacturer (18). In this study, the base-plus-fog density values ranged from 0.25 to 0.31, which were higher values than those found by other authors (11,19,20). This discrepancy can be explained by the different conditions under which the ilms were processed. However, they are within the range of values considered acceptable for the base-plus-fog densities of intra-oral radiographic ilms (21), and they are within the range recommended by ISO 3665 (maximum of 0.35) for ilms with sensitivity E/F (22). Radiographic contrast represents the differences between the several degrees of black, white and gray of the radiographic ilm; that is, it consists of the differences between radiographic densities of the different regions of a radiograph (5). In this study, the calculation of the radiographic contrast of each ilm followed Price’s study method (10).
Moreover, with respect to radiographic contrast, in the present study the values ranged from 1.28 to 1.47. Studies assessing ilms with E sensitivity (Flow and Ektaspeed Plus), processed according to the speciications of the ADA, found contrast values of 1.88 and 1.75, which are much higher values than those of 1.5 required by ADA (23). The mean contrast value was 1.36, below the value established by the ADA, but much closer to this value.
Araujo et al. (9) veriied that interrupting the ixing process after 5 s of immersion in the ixing solution and reading the radiograph in the viewbox for 30 s did not interfere objectively with the quality of the radiographic image. In the present study, using a similar methodology (9), we objectively evaluated the inluence of viewbox observation times 40 s or greater after initial ixing for 5 s. Furthermore, the inluence of these factors was investigated after the radiographs had been iled for six months. The observation time in the viewbox after initial ixing of 5 s had no inluence, even after the radiograph had been iled for six months because the base-plus-fog density and radiographic contrast of the radiographs of the experimental groups did not vary signiicantly compared with those of the control group. These results suggest that there are two factors are involved and they are as follows: irst, the permanence of the ixing solution on the radiographic ilm during the reading period in the viewbox and second, the importance of the ixing process being completed, even after initial ixation of 5 s. With regard to the irst factor, the permanence of the ixer on the radiograph during the reading period in the viewbox allows continuity of action of the sodium hyposulite in removing the silver grains. Therefore, it is possible to interpret radiograph processing before the ixing process has been completed without reducing the quality of the radiographic image, provided that the ilm is not washed before reading in the viewbox, observation is less than 2.5 minutes and after reading, the radiographic ilm is returned to the ixer to complete the ixing process.
Fig. 3. Mean and standard deviation of the contrast values:
(A) immediately after the radiographic processing of the films;
Conclusions
According to the experimental conditions in this study, it was concluded that the viewbox observation time, which interrupts the ixation stage of the radiographic processing, does not interfere with the base-plus-fog density or contrast of the radiographic image either immediately after it is obtained or after the radiographs have been iled for six months.
References
1. Whaites E. Princípios da radiologia odontológica. 3. ed. São Paulo: Artmed; 2003.
2. Kreich EM, Querioz MGS, Sloniak MC. Controle de qualidade de radiografias periapicais obtidas no curso de Odontologia da UEPG. Biol Health Sci 2002;8:33-45.
3. Gasparini D, Vaz EMS, Haiter Neto F, Boscolo FN. Análise de erros radiográficos cometidos por alunos da Faculdade de Odontologia de Piracicaba, no período de 1975 a 1988. Rev Odontol Univ São Paulo 1992;6:107-14.
4. Capelozza AL, Álvares LC. Estudo comparativo entre os filmes radiográficos dentais AGFA-GEVAERT, KODAK ULTRA-SPEED e KODAK EKTASPEED, processados na solução Sillib. Rev Odontol Univ São Paulo 1990;4:92-6.
5. Tavano O, Estevam E. A imagem radiográfica. In: Alvares LC, Tavano O. Curso de radiologia em odontologia. 4. ed. São Paulo: Ed Santos; 1998.
6. Freitas L. Fatores na produção da imagem radiográfica. In: Freitas A, Rosa JE, Souza IF. Radiologia Odontológica. 6. ed. São Paulo: Artes Médica; 2004.
7. Greco AC, Lima FA, Gorgoni SR, Silva JBA, Manzi FR. Efeito da diminuição do tempo de lavagem final ou sua ausência na qualidade da imagem radiográfica. Rev ABRO 2006;7:5-9. 8. Goren AD, Lundeen RC, Deahl ST, Hashimoto K, Kappa SF, Katz
JO, et al. Updated quality assurance self-assessment exercise in intraoral and panoramic radiography. American Academy of Oral and Maxillofacial Radiology, Radiology Practice Committee. Oral Surg Oral Med Oral Pathol Oral Radiol Endod 2000;89: 369-74.
9. Araujo AMM, Pontual AA, Silveira MMF, Brasileira IV, Pontual MLA. Análise objetiva da qualidade da imagem radiográfica quanto à interrupção do processo de fixação. Rev Assoc Paul Cir Dent 2009;63:394-8.
10. Price C. The effects of bean quality and optical density on image quality in dental radiography. Oral Surg Oral Med Oral Pathol Oral Radiol Endod 1986;62:580-8.
11. Dezotti MSG. Avaliação de filmes radiográficos periapicais em diferentes condições de processamento pelo método sensitométrico,
digital e morfométrico. [thesis]. Bauru (SP): Faculdade de Odontologia de Bauru, Universidade de São Paulo; 2003. 12. Langland OE, Langlais RP. Princípios de diagnóstico por imagem
em odontologia. São Paulo: Santos; 2002.
13. Pontual ML, Veloso HHP, Pontual AA, Silveira MMF. Errores en radiografias intrabucales realizadas en la Facultad de Odontología de Pernambuco-Brasil. Acta Odontol Venez 2005;43:19-24. 14. França KP, Pontual AA, Salazar-Silva JR, Pontual MLA, Formiga Filho
AL. Influência da região radiografada e da fase de tratamento endodôntico na qualidade de radiografias periapicais. Pesqui Bras Odontopediatria Clin Integr 2008;8:105-105.
15. Zenóbio MAF, Silva TA. Proteção radiológica em clínicas radiológicas. Rev ABRO 2003;4:35-9.
16. Brücker MR, Tavano O, Costa NP. Análise do comportamento das soluções RPXOmat da Kodak através do método sensitométrico. Rev Odonto Ciênc 1992;7:37-52.
17. Lascala CA, Mosca RC. Filmes e Processamento Radiográfico. In: Panella J. Radiologia Odontológica e Imaginologia. Rio de Janeiro: Guanabara Koogan; 2006.
18. Damian MF. Efeito de um banho de álcool do tempo de secagem de radiografias e suas conseqüências no arquivamento. [dissertation]. Piracicaba (SP): Faculdade de Odontologia de Piracicaba, Universidade Estadual de Campinas; 2001.
19. Ludlow JB, Platin E; Mol, A. Characteristic of Kodak Insight, an F-speed intraoral film. Oral Surg Oral Med Oral Pathol Oral Radiol Endod 2001;91:120-9.
20. Syriopoulus K, Velders XL, Sanderink GCH, van Ginkel FC, van der Stelt FC. Sensitometric and clinical evaluation of a news F-speed dental X-ray film. Dentomaxillofac Radiol 2001;30:40-4. 21. White SC, Pharoah MJ. Oral radiology: principles and interpretation.
5. ed. Saint Louis: Ed Elsevier; 2004.
22. International Organization for Standardization. International Standard ISO 3665. Photography – Intraoral dental radiographic film -Specification. 2.ed. Geneve: ISO; 1996.