HESSD
5, 2687–2725, 2008Hydrological responses associated to soil
characteristics
C. Manus et al.
Title Page
Abstract Introduction
Conclusions References
Tables Figures
◭ ◮
◭ ◮
Back Close
Full Screen / Esc
Printer-friendly Version
Interactive Discussion
Hydrol. Earth Syst. Sci. Discuss., 5, 2687–2725, 2008 www.hydrol-earth-syst-sci-discuss.net/5/2687/2008/ © Author(s) 2008. This work is distributed under the Creative Commons Attribution 3.0 License.
Hydrology and Earth System Sciences Discussions
Papers published inHydrology and Earth System Sciences Discussionsare under
open-access review for the journalHydrology and Earth System Sciences
A modelling approach to assess the
hydrological response of small
Mediterranean catchments to the
variability of soil characteristics in a
context of extreme events
C. Manus1, S. Anquetin1, I. Braud2, J.-P. Vandervaere1, J.-D. Creutin1, P. Viallet3, and E. Gaume4
1
LTHE, Universit ´e de Grenoble, UMR5564(CNRS, UJF, INPG, IRD), Grenoble, Cedex, France
2
CEMAGREF, UR Hydrologie-Hydraulique, Lyon, France
3
HYDROWIDE, Saint-Martin d’H `eres, France
4
Division Eau et Environnement, Lab. Central des Ponts et Chauss ´ees, Bouguenais, France
Received: 14 August 2008 – Accepted: 18 August 2008 – Published: 9 September 2008
Correspondence to: S. Anquetin ([email protected])
HESSD
5, 2687–2725, 2008Hydrological responses associated to soil
characteristics
C. Manus et al.
Title Page
Abstract Introduction
Conclusions References
Tables Figures
◭ ◮
◭ ◮
Back Close
Full Screen / Esc
Printer-friendly Version
Interactive Discussion
Abstract
This paper presents a modeling study aiming at quantifying the possible impact of soil characteristics on the hydrological response of small ungauged catchments in a con-text of extreme events. The study focuses on the September 2002 event in the Gard region (South-Eastern France), which led to catastrophic flash-floods. The proposed
5
modeling approach is able to take into account rainfall variability and soil profiles vari-ability. Its spatial discretization is determined using Digital Elevation Model (DEM) and a soil map. The model computes infiltration, ponding and vertical soil water distribu-tion, as well as river discharge. The model is set up without any calibration and the soil parameter specification is based on an existing soil database. To perform the
sim-10
ulations, radar rainfall estimations are used at a 1 km2and 5 min resolution. To specify
the soil hydraulic properties, two types of pedotransfer function (PTF) are compared. It is shown that the PTF including information about soil structure reflects better the spatial variability that can be encountered in the field. The study is focused on four
small ungauged catchments of less than 10 km2, which experienced casualties.
Sim-15
ulated specific peak discharges are found to be in agreement with estimations from a post-event in situ investigation. Examining the dynamics of simulated infiltration and
saturation degrees, two different behaviors are shown which correspond to different
runoff production mechanisms that could be encountered within catchments of less
than 10 km2. They produce simulated runoffcoefficients that evolve in time and
high-20
light the variability of the infiltration capacity of the various soil types. Therefore, we propose a cartography distinguishing between areas prone to saturation excess and areas prone only to infiltration excess mechanisms. The questions raised by this mod-eling study will be useful to improve field observations, aiming at better understanding
runoffgeneration for these extreme events and examine the possibility for early
warn-25
HESSD
5, 2687–2725, 2008Hydrological responses associated to soil
characteristics
C. Manus et al.
Title Page
Abstract Introduction
Conclusions References
Tables Figures
◭ ◮
◭ ◮
Back Close
Full Screen / Esc
Printer-friendly Version
Interactive Discussion
1 Introduction
The main objective of this paper is to gain new insight into the process controlling runoff
generation at regional scale. The study is based on small ungauged catchments, that are recognized to be the most vulnerable to storms driven flash flood (Ruin et al., 2008). Flash floods are rare events and usually occur in ungauged river basins. Several
5
methods for predicting flash floods in ungauged river basins are now accepted. The flash flood guidance (Georgakakos, 2006) and the discharge threshold exceedance approach (Reed et al., 2007; Younis et al., 2008) are built to give an early flash flood warning suitable to organize the civil protection. These methods rely either on con-ceptual or physically based hydrological models and need to be complemented with
10
sensitivity studies to improve the understanding of the major hydrological factors asso-ciated to the flood event.
There is no unique and simple theory about the runoff production on watersheds
during flash flood events. The main reason is that various processes can be involved which are usually grouped in two types of overland flow: saturation excess (Dunne
15
process) or infiltration excess (Horton runoff). Due to the high heterogeneity and space
variability of the watershed characteristics (land use, soil type and depth, sub-soil, local slope, upstream contributing area) and to antecedent moisture conditioning, these processes are likely to be active at the same time in various combinations (Smith and Goodrich, 2005).
20
There is no doubt that flash floods represent the most destructive natural hazard in the Mediterranean region causing around a billion Euros of damage in France over the last two decades (Gaume et al., 2004). These events are poorly understood due to the lack of experimental sites and long-term hydro-meteorological data with adequate space-time resolution (Foody et al., 2004; Delrieu et al., 2005). The present study aims
25
at making use of all the available information collected within the long-term observa-tory OHMCV (Observatoire Hydrom ´et ´eorologique M ´editerran ´een C ´evennes-Vivarais,
HESSD
5, 2687–2725, 2008Hydrological responses associated to soil
characteristics
C. Manus et al.
Title Page
Abstract Introduction
Conclusions References
Tables Figures
◭ ◮
◭ ◮
Back Close
Full Screen / Esc
Printer-friendly Version
Interactive Discussion
the C ´evennes-Vivarais region (Fig. 1). We propose to use a distributed modeling
ap-proach to quantify the possible role of soil variability on runoff generation and
catch-ment response during the flash flood Gard event in September 2002 in France (Delrieu et al., 2005). A critical outcome is a map highlighting the most probable active pro-cesses (infiltration excess or saturation excess) and their spatial variability. The results
5
presented here will also contribute to improve the experimental design of the HyMEx (Hydrological cycle in Mediterranean Experiment, http://www.cnrm.meteo.fr/hymex/) project, which is under preparation. Indeed, such sensitivity studies of model response can allow identifying the lack of knowledge and the areas requiring further field inves-tigations.
10
Various numerical models, distributed or not, have been tested in the C ´evennes
region. These studies aimed the derivation of efficient prediction tools for flash flood
forecasting more than towards process understanding. They were generally set up on gauged catchments. That condition allows the calibration of model parameters on part of the data and the validation of the corresponding models with independent data
15
and/or on sub-catchments (Moussa et al., 2007). Examples can be found in Sempere-Torres et al. (1992) and Nalbantis et al. (1995) on the Gard River, Saulnier et al. (1997) and Saulnier and Datin (2004) with Topmodel (Beven and Kirky, 1979) on the Ard `eche
River and Ayral et al. (2005) with Altha¨ır model (based on Horton infiltration capacity
excess) on the Gardon. The comparison between all the models shows that, once
20
calibrated, Horton and Dune schemes reproduce equally well all the flood events. As regards to prediction in ungauged catchments, few studies have been
con-ducted at regional scale. Ayral et al. (2007), with the Altha¨ır model, and Lelay and
Saulnier (2007), with the event-based Topmodel approach, tested various levels of so-phistication in the inputs and model parameters regionalization.
25
Ayral et al. (2007) obtained a systematic overestimation of peak discharge and a satisfactory simulation of the time of the peak, when the model was used with spa-tially homogeneous parameters. Le Lay and Saulnier (2007) showed that the model
Nev-HESSD
5, 2687–2725, 2008Hydrological responses associated to soil
characteristics
C. Manus et al.
Title Page
Abstract Introduction
Conclusions References
Tables Figures
◭ ◮
◭ ◮
Back Close
Full Screen / Esc
Printer-friendly Version
Interactive Discussion
ertheless, for some of the catchments, the mis-performances remained unexplained. The authors raised some hypotheses about the impact of the spatial structure of soil hydraulic characteristics.
Although very useful for flash flood forecasting, these modeling studies do not allow
to really understand the mechanisms involved in runoff generation. Once calibrated,
5
the proposed models have been shown to perform equally well making these hypothe-ses equally plausible.
Field studies have been undertaken to locally analyze the mechanisms of runoff
gen-eration, but they only cover a small part (545 km2) of the whole OHM-CV observatory
(3200 km2) and are located on steep areas (Ayral, 2005; Marchandise, 2007). Based
10
on hillslope infiltration experiments with either controlled rainfall inputs or real events, the experimental results showed that the soil infiltration capacity is generally very high
(more than 100 mm h−1) and that a large proportion of the flow is generated by
subsur-face lateral paths. However, the obtained velocities were too small to explain the quick response of the catchment. Ayral et al. (2005) suggested that the transit time of the
15
water within the soil might be very short and the exfiltrated water quickly mobilized in temporary surface channels.
To study the sensitivity of the model responses to soil characteristics, the follow-ing modelfollow-ing options are chosen given the scarcity of the available information at this scale. The proposed distributed modeling approach is carried out without calibration
20
phase. The approach is thus applicable at the scale of the whole C ´evennes-Vivarais region and gives a regional view of the problem. Radar rainfall data are used. The soil properties are extracted from the available Languedoc-Roussillon soil database. The
model accounts for different soil hydraulic characteristics and profiles, soil saturation
and infiltration excess, as well as a simple routing scheme. In the following, Sect. 2 first
25
HESSD
5, 2687–2725, 2008Hydrological responses associated to soil
characteristics
C. Manus et al.
Title Page
Abstract Introduction
Conclusions References
Tables Figures
◭ ◮
◭ ◮
Back Close
Full Screen / Esc
Printer-friendly Version
Interactive Discussion
2 Region of interest and case studied
The C ´evennes-Vivarais region (Fig. 1a) is the Southeast part of the Massif Central
(85 000 km2; i.e. one sixth of the France area). The relief of the southeasterly facing
slope starts from the Mediterranean shore and the Rh ˆone Valley. The altitude ranges from sea level up to 1700 m (Mount Loz `ere) over roughly 70 km. The main C ´evennes
5
rivers, Ard `eche, C `eze, Gard, right bank tributaries of the Rh ˆone River, and the Vidourle have a typical almost intermittent hydrological regime: very low water levels in the summer, floods occurring mainly during autumn. The above-mentioned catchments
are medium size catchments (almost 2300 km2for the largest) with travel times of less
than 12 h.
10
The modeling approach is set up at the scale of the whole C ´evennes-Vivarais region, but the paper focuses on four small ungauged catchments shown in Fig. 1b: Domazan
(6 km2), Rousson (12 km2), Saint Quentin la Poterie (12 km2) and Quissac (2 km2).
They are spread within the region and located both in mountainous and plain areas. This study is motivated by the analysis of Ruin et al. (2008) on the hydrometeorological
15
circumstances that led to accidental casualties in these small ungauged catchments, that are much vulnerable to intense storms. Ruin et al. (2008) showed that these catchments do not systematically react to the first heavy rainfall.
To rate the impact of soil variability on the hydrological response of small catchments, soils characteristics are extracted from the Languedoc-Roussillon soil data base (later
20
referred as BDSol-LR), provided by the INRA (The French National Institute of Agro-nomical Research) from the IGCS program (http://gissol.orleans.inra.fr/progragramme/ igcs/igcs.php). This database gives soil information (i.e. texture, depth of horizons etc.) on pedological landscape units called Cartographic Soil Unit (CSU). Those units are established at the 1/250 000 resolution and are georeferenced. They are composed
25
HESSD
5, 2687–2725, 2008Hydrological responses associated to soil
characteristics
C. Manus et al.
Title Page
Abstract Introduction
Conclusions References
Tables Figures
◭ ◮
◭ ◮
Back Close
Full Screen / Esc
Printer-friendly Version
Interactive Discussion
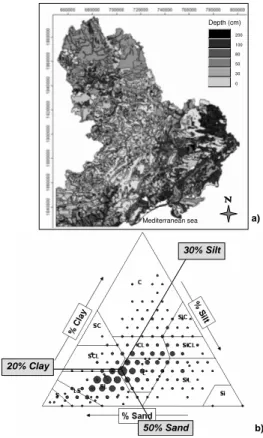
quantitative and qualitative information. The latter can be used to check the consis-tency of quantitative data. As an example, the soil depth in the whole region is given in Fig. 2a. The average depth in the studied region does not exceed 55 cm and more than 50% of the soils are shallow (depth below 50 cm). Figure 2b shows the texture of the soils encountered within the data base. They span over a large part of the textural
5
triangle with a mean texture of 30% silt, 20% clay and 50% sand. Figure 2b also shows the large diversity of the soils encountered in the region, which should result in a large variability of soil hydraulic properties.
The meteorological and hydrological data of the September 2002 event used in this study were collected and analyzed in the framework of the C ´evennes-Vivarais
Mediter-10
ranean Hydrometeorological Observatory (OHM-CV). Rain intensity was derived from the radar observation at Boll `ene (see Fig. 1a for its location). Data are available at
1×1 km2resolution every 5 min.
The meteorological event started early in the morning of 8 September 2002 with the formation of first convective cells over the Mediterranean Sea. Then, convection
15
progressed northward to form inland a mesoscale convective system (MCS) over the Gard river watershed. The quasi-stationary MCS stayed over the same region until approximately the next morning, and then moved eastward together with the surface front. As emphasized by Delrieu et al. (2005), three distinct rainfall phases were ob-served during the episode. In phase 1, from 08:00 UTC to 22:00 UTC, 8 September
20
2002, the highest rainfall developed and became stationary over the plain region just
north of the city of Nˆımes. Maximum rainfall amounts were about 300 mm during this
phase. In phase 2, between 22:00 UTC and 04:00 UTC, 9 September 2002, the rain system slowly moved northwards and northwestwards. The MCS produced rainfall amounts greater than 100 mm over this 6-h period. Lastly, in phase 3, after 04:00 UTC,
25
rainfall amounts exceeding 100 mm during an 8-h period occurred during the eastward evacuation of the storm.
HESSD
5, 2687–2725, 2008Hydrological responses associated to soil
characteristics
C. Manus et al.
Title Page
Abstract Introduction
Conclusions References
Tables Figures
◭ ◮
◭ ◮
Back Close
Full Screen / Esc
Printer-friendly Version
Interactive Discussion
River discharge information is more critical to obtain. The available water level
sta-tions cover watersheds of more than several hundreds km2 whereas the basins of
interest are around 10 km2. As proposed by Gaume et al. (2004) for a previous similar
event, an extensive post-flood investigation was carried out during the months following the event. The objective was to collect information concerning the flood and to
ana-5
lyze the hydrological behavior of the watersheds between 2 to 300 km2. Basically, the
procedure aims at estimating maximum discharges by means of water level marks and also interviewing witnesses to document the chronology of the flood. During the post-event investigation, 93 river cross sections were surveyed and 143 witnesses were interviewed. These estimations were used to produce a maximum specific peak
dis-10
charge map (Delrieu et al., 2005). The spatial distribution (not shown here, Fig. 11 from Delrieu et al., 2005) shows that most of the tributaries of the Gard River have
a peak specific discharge greater than 5 m3s−1km−2. In the first uphill of the
moun-tains, in the region of Al `es (Fig. 1), peak of specific discharges are even estimated over
20 m3s−1km−2. These specific discharges are among the highest ever reported for
15
this range of watershed sizes (Gaume and Bouvier, 2004). To specify the intensity of this event, it is important to notice that the 10 years return period discharge for such
catchments is about 2 m3s−1km−2in this region (Delrieu et al., 2005).
The 4 small ungauged catchments under study were not explicitly surveyed but Del-rieu et al. (2005) and in more details Gaume and Bouvier (2004) present the flood peak
20
estimated for several small nearby catchments, that will be used for validation of the simulated specific discharges.
3 Model setup
3.1 Model presentation
The hydrological model, used in this study, is developed within the LIQUID hydrological
25
inde-HESSD
5, 2687–2725, 2008Hydrological responses associated to soil
characteristics
C. Manus et al.
Title Page
Abstract Introduction
Conclusions References
Tables Figures
◭ ◮
◭ ◮
Back Close
Full Screen / Esc
Printer-friendly Version
Interactive Discussion
pendent process modules that can exchange variables and fluxes with other modules. They can be assembled to build “ ´a la carte” models, according to the modeling ob-jectives and the available data. Each module is run with its own characteristic time and space scales and the geometry of modeling units does not need being regular. A time sequencer, which is an event-based simulator, allows running the simulation and
5
synchronizing the various modules.
To represent soil vertical heterogeneity and both infiltration excess and saturation excess mechanisms, a 1-D vertical soil water transfer module is used. It is based on the mixed form of the Richards equation (Eq. 1).
∂θ ∂t=
∂
∂z[K(h)( ∂h
∂z−1)] (1)
10
In this equation,his the water pressure head (m),θis the soil water content (m3m−3),
tis the time (s),z the depth (m) andK the hydraulic conductivity (m s−1).
Equation (1) is solved through the simplified Ross’ algorithm (Ross, 2003), as val-idated by Varado et al. (2006). It requires the hydraulic characteristics of the soils
through the hydraulic conductivity curve K(θ) (Eq. 2) and the retention curve θ(h)
15
(Eq. 3) based on the Brooks and Corey’s model (1964). The hydraulic conductivity is expressed as:
K(θ)
Ks =
θ θs
η
(2)
where Ks and θs are the hydraulic conductivity and water content at saturation (m s−1
and m3m−3);ηdefines the dimensionless shape parameter of the hydraulic
conductiv-20
ity curve.
The retention curve is expressed as follows:
whenh<hbc: θθs=
h
bc h
λ
whenhbc≤h: θθs=1
HESSD
5, 2687–2725, 2008Hydrological responses associated to soil
characteristics
C. Manus et al.
Title Page
Abstract Introduction
Conclusions References
Tables Figures
◭ ◮
◭ ◮
Back Close
Full Screen / Esc
Printer-friendly Version
Interactive Discussion
wherehbc is the pressure head at air entry (m) andλ is the shape parameter of the
water retention curve.
Equation (4) is used in the following to express the relationship between the two shape parameters (Childs and Collis-George, 1950; Haverkamp et al., 1999).
η=2/λ+2 (4)
5
The corresponding 1-D soil water transfer module is run for each hydro-landscape (de-fined as the elementary computing volume as described in Sect. 3.2). It allows the computation of the infiltration and soil water distribution within the soil profiles. There-fore, it is possible to simulate perched water tables as the full saturation of soils profile. No lateral transfer is taken into account in the model at present stage. Due to the small
10
scale of the studied catchments, the ponding produced on each hydro-landscape is instantaneously transmitted to the closest river reach. Then, the discharge at the outlet
is computed using a constant transfer velocity of 1 m s−1in the river network.
3.2 Hydraulic properties of soils
To run the 1-D soil transfer module, the retention and hydraulic conductivity curves are
15
specified thanks to pedotransfer functions (PTF) which relate the parameters of the
Brooks and Corey modelsKs,θs, hbc,λand η(Eqs. 2 and 3) to measured soil data
(i.e. soil texture, organic matter content and/or other routinely measured data by soil surveys (W ¨osten et al., 1999). Measurements of soil infiltration are only available very
locally and are therefore difficult to extend to the whole region. In the present work, we
20
evaluate the relevance of two PTFs for the whole region of interest. The BDSol-LR is therefore used to document the soil properties.
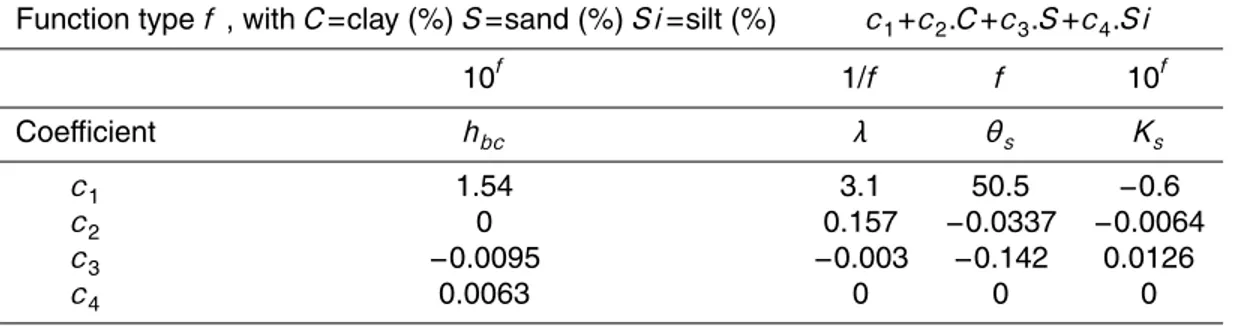
The first class of PTF, based on the Cosby et al. (1984) approach (later refer as C84), uses only textural information. Its formulation is presented in Table 1.
Experimental studies (Ayral, 2005; Marchandise, 2007) highlighted the determinant
25
HESSD
5, 2687–2725, 2008Hydrological responses associated to soil
characteristics
C. Manus et al.
Title Page
Abstract Introduction
Conclusions References
Tables Figures
◭ ◮
◭ ◮
Back Close
Full Screen / Esc
Printer-friendly Version
Interactive Discussion
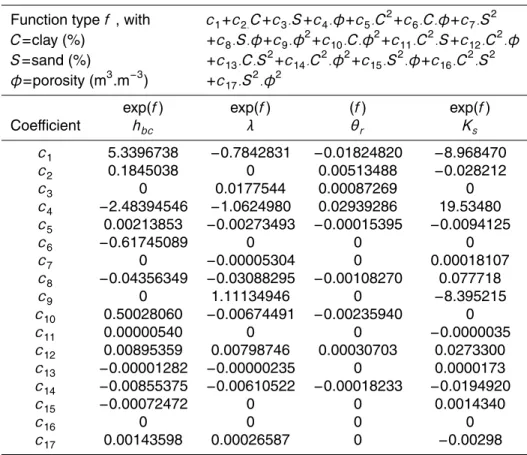
is used as a second PTF class. Table 2 gives the RB85 formulation. In this case, the soil structure is taken into account through porosity. However, while the soil tex-ture is explicitly given in the BDSol-LR database, the porosity needs being derived. Brakensiek et al. (1981) used a statistical approach to derive an average value of the
effective porosity and the associated standard deviation for each textural class
accord-5
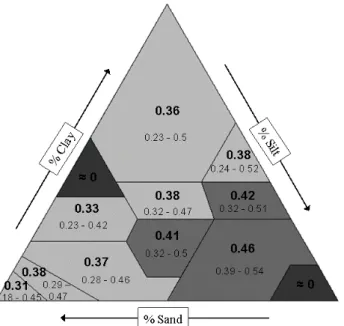
ing to FAO (1990). The porosity is therefore obtained from the Brakensiek et al. (1981) results, which provide range value as shown in Fig. 4, and from qualitative information available in the BDSol-LR, such as “massive structure” or “gritty structure”, which is used to chose between the minimum, maximum or average value within this range.
In addition, the observed rock fragment rate (not shown here but present in the
10
BDSol-LR database) has a 20% average value in the region with some areas where it
exceeds 50%. Based on these observations, the values of Ks andθs were reduced to
account for the presence of rocks that can strongly affect the infiltration rate (Brakensiek
and Rawls, 1994; Morvan et al., 2004). Simply, the values of Ks andθs estimated by
the PTFs, are then reduced by the rock fraction (considered non porous). For instance,
15
in areas where the rock fragment rate is 50%, the estimated values are divided by two. The consistency of the hydraulic properties estimated using the two PTFs is evalu-ated by comparison with the available information about soil hydraulic properties (see Sect. 4).
3.3 Modeling setup
20
The model is implemented for the whole C ´evennes-Vivarais region and run on the four small catchments without any parameter calibration. Within the LIQUID framework, the model setup requires choosing the simulated processes, their representation and consistent catchments discretization. The followed methodology is the one outlined by Dehotin and Braud (2008) who propose a catchment discretization consistent with the
25
HESSD
5, 2687–2725, 2008Hydrological responses associated to soil
characteristics
C. Manus et al.
Title Page
Abstract Introduction
Conclusions References
Tables Figures
◭ ◮
◭ ◮
Back Close
Full Screen / Esc
Printer-friendly Version
Interactive Discussion
– For the first level, the catchments are sub-divided into sub-catchments or
Repre-sentative Elementary Watersheds (REWs). They are extracted from the stream network previously derived from a DEM analysis (Digital Elevation Model). The latter was conducted using the SAGA software (http://sourceforge.net/projects/
saga-gis/), using 0.1 km2 as the surface threshold and the first Strahler order.
5
This first level of discretization is not sufficient to describe the soil heterogeneity
within the sub-catchments. A second level of discretization is therefore required.
– The variability inside the sub-catchments can be accounted for through
homoge-neous zones, called hydro-landscapes, which are derived from GIS layers analy-sis. In this study, this second level is based on the Cartographic Soil Units (CSU)
10
presented in Sect. 2. Each CSU contains several Typological Soil Units (TSU)
that are not georeferenced. In the present study, we affect the dominant TSU to
each CSU for the sake of simplicity. The soil depth is fixed to the average depth for each TSU. To solve the Richards equation, the vertical soil profile is divided
into cells of 1 cm thickness. A different set of hydraulic parameters is assigned to
15
each soil horizon composing the soil profiles.
Because the September 2002 event is the first main rainy event after the summer dry season, the model is initialized as follows. We first consider a uniform soil wa-ter pressure profile. The value of this pressure corresponds to a 75% saturation of the first horizon. A simulation without rainfall and a constant potential evaporation of
20
2 mm day−1is then run for two months. The obtained soil moisture profiles are used as
initial condition for the simulation of the September 2002 event.
As far as the boundary conditions are concerned, a zero flux (impermeable bedrock) condition is fixed at the bottom boundary. Preliminary tests showed that the use of a gravitational flux as boundary conditions could modify considerably the soils response.
25
HESSD
5, 2687–2725, 2008Hydrological responses associated to soil
characteristics
C. Manus et al.
Title Page
Abstract Introduction
Conclusions References
Tables Figures
◭ ◮
◭ ◮
Back Close
Full Screen / Esc
Printer-friendly Version
Interactive Discussion
using input rainfall series and a zero potential evapotranspiration (evaporation is
ne-glected during the event). Rainfall data at the 1 km2 resolution are interpolated per
hydro-landscapes using weighted averages on the surfaces. The module time step is automatically calculated as a function of the dynamics (Ross, 2003) and the manage-ment of all the hydro-landscapes units is ensured by the time sequencer of the LIQUID
5
platform (Viallet et al., 2006).
As mentioned above, ponding water is directly transmitted to the nearest river reach and transmitted within the river network at a constant velocity. It provides the simulated streamflow at the outlet of the four studied catchments and for their sub-catchments. The model also provides, for each hydro-landscape, the infiltration flux and the vertical
10
fluxes between the cells. The saturation degree profiles are also available and are used in the analysis provided in the next section.
4 Results and discussion
4.1 Soils infiltration properties
To illustrate the impact of the two different PTFs on modeled soil hydraulic properties,
15
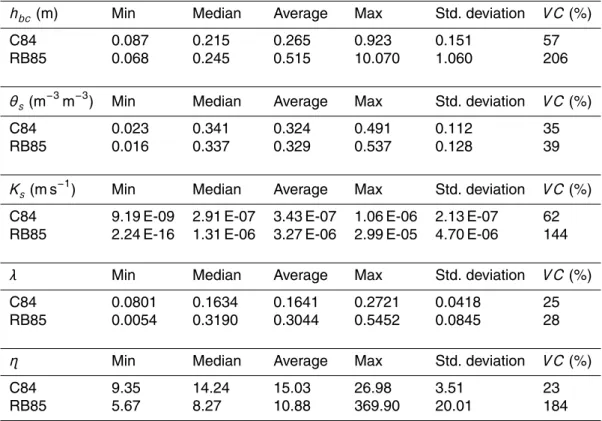
simple statistical scores on the whole database of the region of interest are summarized in Table 3. The compared values clearly show the impact of the PTF on the estimation of the Brooks and Corey parameters. The variability range is much larger for the RB85
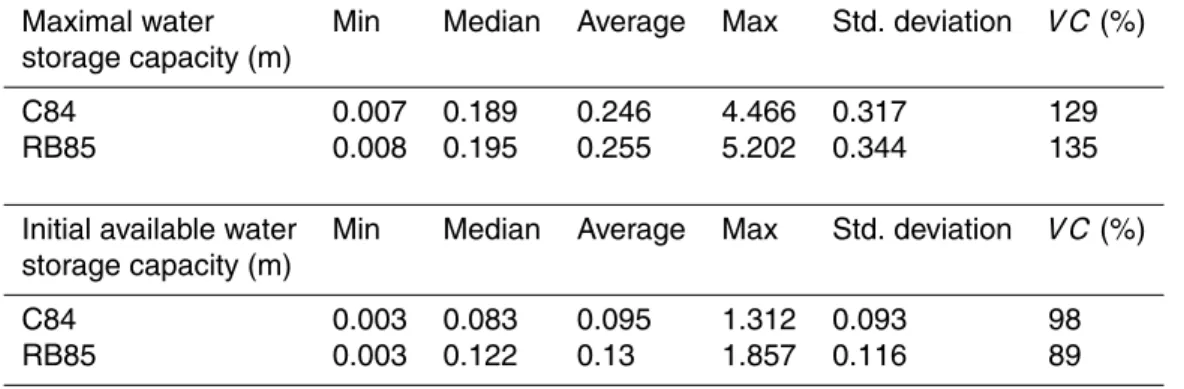
formulation, especially for theλ,Ks andhbcparameters. In Table 4, the two PTFs lead
to very close maximal water storage capacity, defined as the product of the depth of the
20
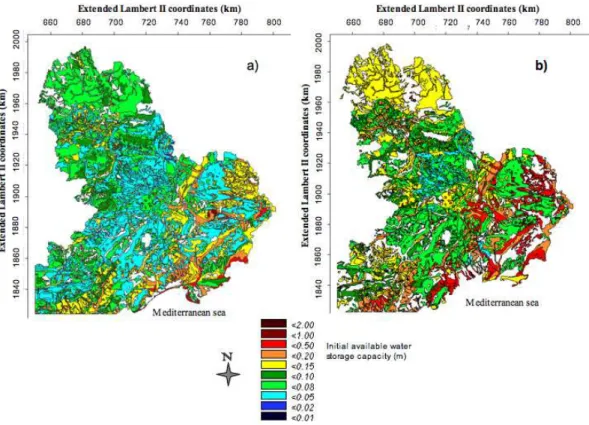
soil and the water content at saturationθs. Figure 6 shows however that the obtained
initial available soil water capacity presents large differences between the C84 and the
RB85 formulations. These are of 35 mm in average and can reach 535 mm for very deep soils (Table 4). The average initial available soil water capacities are consistent with the estimation cited in Delrieu et al. (2005).
25
HESSD
5, 2687–2725, 2008Hydrological responses associated to soil
characteristics
C. Manus et al.
Title Page
Abstract Introduction
Conclusions References
Tables Figures
◭ ◮
◭ ◮
Back Close
Full Screen / Esc
Printer-friendly Version
Interactive Discussion
d’Anduze catchment (545 km2) are available. On this area, Ayral et al. (2005) and
Marchandise (2007) reported values larger than 100 mm h−1. For the same area, the
RB85 estimates saturated hydraulic conductivities ranging from 1 to 90 mm h−1, which
are lower than these observations. However, in situ data take into account local macro-porosity whereas it is not included in the derivation of PTFs. This result highlights the
5
need for further work in order to include macroporosity in the definition of PTFs. For the present study, the use of PTF is the only way to get hydraulic properties for the whole region, in a homogeneous way. In the following, we use the RB85 PTF as it provides a more realistic range of variation than C84. Nevertheless, it would be necessary to complement the existing field study in order to document the variety of
10
soils encountered at the regional scale. This could allow establishing a PTF for the region.
4.2 Flood dynamics for the 4 catchments
Figure 7 displays the observed rain field and the simulated specific discharge at the 4 outlets (Rousson, St Quentin la Poterie, Quissac and Domazan). Due to the size of
15
the catchments and the importance of the event, the hydrographs approximately follow
the rain dynamics. In Fig. 8, the simulated peaks reaching 15 to 25 m3s−1km−2 for
the 4 catchments are compared against the values retrieved from the post-flood field investigation (Gaume and Bouvier, 2004), used as validation data. We consider this validation having in mind that the model was not calibrated. The compared values are
20
of the same order of magnitude and the hierarchy between catchments is correctly simulated by the model, which was not obvious from the mere examination of the rain amounts collected by the watersheds.
In order to illustrate the influence of soil characteristics on the water available amount
for runoff, Fig. 9 displays the time evolution of
25
i) the average infiltration rate for each catchment,
HESSD
5, 2687–2725, 2008Hydrological responses associated to soil
characteristics
C. Manus et al.
Title Page
Abstract Introduction
Conclusions References
Tables Figures
◭ ◮
◭ ◮
Back Close
Full Screen / Esc
Printer-friendly Version
Interactive Discussion
iii) the corresponding cumulative runoffcoefficient.
This latter is computed as the simulated cumulative water amount available for runoff
(ponding) divided by the cumulated rainfall up to this time. Runoffgeneration is
ob-viously strongly linked to the rain intensity but also to the soil storage capacity and the infiltration capacity. In Fig. 9, the soils of the Rousson and St Quentin la Poterie
5
catchments are fully saturated at 06:00 UTC, 9 September. On the other hand, the soils of the Domazan and Quissac catchments do not reach their saturation state as the infiltration rate remains positive during the whole event.
These results highlight the combined contribution of the rain intensity and the soil
properties in the runoff generation at the catchment scale. The next section aims at
10
identifying how the soil properties act on the infiltration rate and if any main hydrological process can be identified.
4.3 Infiltration dynamics associated to soil properties
In Fig. 10, the average simulated runoff coefficients are evaluated for the different
sub-catchments and plotted against the cumulated rainfall during the whole simulation
15
(08:00 UTC, 8 December to 00:00 UTC, 10 December).
Despite the usual strong correlation between runoffcoefficient and rainfall intensity,
some discrepancies are observed that are assumed to be linked to the soil signature.
For example, the largest runoffcoefficient for the Rousson catchment occurs where the
cumulated rainfall is the lowest. For the Quissac and more specifically, the St-Quentin
20
la Poterie catchments, the total rainfall amount is almost spatially homogeneous but the
calculated runoffcoefficients can be seen highly variable amongst sub-catchments.
To illustrate the role of soil properties on the runoffgenesis, the average infiltration
rates are plotted for each sub-catchment in Fig. 11 of the Domazan catchment. This
figure, combined with the analysis of ponding (not shown), highlights two different
ten-25
HESSD
5, 2687–2725, 2008Hydrological responses associated to soil
characteristics
C. Manus et al.
Title Page
Abstract Introduction
Conclusions References
Tables Figures
◭ ◮
◭ ◮
Back Close
Full Screen / Esc
Printer-friendly Version
Interactive Discussion
particularly emphasized during the quasi no-rain phase around 11:00–13:00 UTC (see Fig. 9d). The infiltration process is rapidly stopped within the W/S sub-catchments as no ponding is simulated. On the contrary, the infiltration still goes on within the E/N sub-catchments as ponding remains at the surface. At 14:00 UTC, the rain rate has increased. The higher infiltration capacity of the W/S sub-catchments allows infiltration
5
until 22:00 UTC, 8 September. At this time, the sub-catchments are fully saturated. These sub-catchments probably react as saturated source areas and present lower
average runoffcoefficients than the E/N ones.
For the other catchments (not presented here), similar tendencies are observed as far as the infiltration dynamics is concerned.
10
In Fig. 12, the vertical profiles of the soil saturation state are presented at different
instants of the event and for two hydro-landscapes representative of the two tenden-cies. HL1 (Fig. 12a–d) refers to the W/S sub-catchments of Domazan (larger infiltration capacity) while HL2 (Fig. 12e–h) stands for the E/N sub-catchments that have lower in-filtration rates. These two hydro-landscapes receive approximately the same average
15
rainfall. Therefore, Fig. 12 shows different behaviors that can be related to soil
proper-ties.
The time evolution of the infiltration in HL1 (Fig. 12a–d) presents a strong correlation with the rain dynamics. At the beginning of the event (Fig. 12a) the first layers of the soil saturate and when rain stops (Fig.12b), the water infiltrates deeper while the upper
20
layers start drying up. During this phase, there is no ponding at the HL1 surface. When rain starts again (Fig. 12c), the surface saturates and ponding starts increasing. The infiltration front moves on quickly towards the deeper layers; that leads to the complete
soil column saturation at 21:47 UTC, 8 December. Then, runoffgeneration follows the
rainfall dynamics. So, this hydro-landscape experiences both infiltration excess and
25
saturation excess mechanisms.
HESSD
5, 2687–2725, 2008Hydrological responses associated to soil
characteristics
C. Manus et al.
Title Page
Abstract Introduction
Conclusions References
Tables Figures
◭ ◮
◭ ◮
Back Close
Full Screen / Esc
Printer-friendly Version
Interactive Discussion
10:05 UTC; the second remains very moist, but does not saturate during the event. Due to the low infiltration capacity of the soil, Hortonian infiltration excess is the only active hydrological process on this hydro-landscape. On other soils, we have found soils prone to saturation excess due to a lower infiltration capacity of the deeper layer than the upper one, leading to a perched water table.
5
The same analysis procedure is performed for the three other catchments. Figure 13 synthesizes the results as a map distinguishing the areas where the soils fully saturate during this event and the areas where it does not. Note that during such an extreme event, rainfall intensities are so high that infiltration excess occurs over all the soils, but it seems to be preponderant on the white areas of Fig. 13. This map can serve as basis
10
for an experimental set up, aiming at verifying these hypotheses. For instance, areas suspected to be prone to saturation excess could be equipped with small piezometers, whereas the other areas could be instrumented with surface sensors, measuring soil moisture.
5 Conclusions
15
This study is a first step towards the set up of a modeling approach for ungauged catch-ments in a region prone to flash-floods events. A simple model is established using the facilities provided by the LIQUID modeling platform. The soil parameters required for the simulation are derived from the available database BDSol-LR. The analysis fo-cuses on the simulated hydrological response of four small-ungauged catchments to
20
the variability of soil properties, for the September 2002 catastrophic event. The results highlight the importance of soil hydraulic properties on the hydrological response. They
also show, even on small catchments of less than 10 km2, the possible co-existence of
different runoffmechanisms (infiltration excess and saturation excess). The simulated
maximum specific peak discharges are consistent with the post-event investigation for
25
ex-HESSD
5, 2687–2725, 2008Hydrological responses associated to soil
characteristics
C. Manus et al.
Title Page
Abstract Introduction
Conclusions References
Tables Figures
◭ ◮
◭ ◮
Back Close
Full Screen / Esc
Printer-friendly Version
Interactive Discussion
tension of the present analysis to larger catchments.
This first study also highlights a lack of knowledge in various domains, which pro-vides guidance for the establishment of field study priorities in the future HyMeX ex-periment (http://www.cnrm.meteo.fr/hymex/). One can mention:
– The necessity to validate and/or calibrate pedotransfer function for characteristic
5
soils of the region and to document soil properties, including structure;
– The results are related to the definition of the bottom boundary condition and
would require investigations about infiltration capacity of bedrock layers, which are generally considered as impermeable;
– The extension of the modeling study presented here will allow mapping areas
10
principally prone to infiltration excess and to saturation excess. It would be inter-esting to validate, even with qualitative information, these hypotheses;
– The validation of a regional modeling approach would also require to enhance
stream flow estimation on small upstream catchments, using embedded scales. Image video (Muste et al., 2005) should be encouraged in such a context.
15
Previous sensitivity studies have shown the strong impact of the initial soil moisture (which specifies the initial storage capacity of the soil). Continuous simulations, includ-ing evapotranspiration simulation will be included in the modelinclud-ing approach to assess this impact. This would therefore require to consider lateral redistribution of water along the slopes, while adding a lateral flow component to the present model.
20
Acknowledgements. This work was carried out in the framework of two projects funded by the FP6 Program of the European Commission: FLOODsite project under the no. GOCE-CT-2004-505420 and HYDRATE project under the no. GOCE 037024.
The publication of this article is financed by CNRS-INSU.
HESSD
5, 2687–2725, 2008Hydrological responses associated to soil
characteristics
C. Manus et al.
Title Page
Abstract Introduction
Conclusions References
Tables Figures
◭ ◮
◭ ◮
Back Close
Full Screen / Esc
Printer-friendly Version
Interactive Discussion
References
Ayral, P. A.: Contribution `a la spatialisation du mod `ele op ´erationnel de pr ´evision des crues ´eclair ALHTAIR: approche spatiale et exp ´erimentale: applicaton au bassin versant du Gardon d’Anduze, Ph.D. Thesis, Universit ´e de Provence, Aix-Marseille, France, 311 pp., 2005 (in French).
5
Ayral, P. A., Sauvagnargues-Lesage, S., and Bressand, F.: Contribution `a la spatialisation du mod `ele op ´erationnel de pr ´evision des crues ´eclair Altha¨ır, Etudes de G ´eographie Physique, 32, 75–97, 2005.
Ayral, P. A., Sauvagnargues-Lesage, S., Gay, S., and Bressand, F.: Forecasting flash-floods with an operational model: aplication in the South-East of France (Gard), Advances in Natural
10
and Technological Hazards Research, Flood risk management in Europe, Springer Nether-lands, 335-352, doi:10.1007/978-1-4020-4200-3, 2007.
Beven, K. and Kirkby, M. J.: A physically-based variable contributing area model of basin hy-drology, Hydrol. Sci. B., 24, 43–69, 1979.
Boudevillain, B., Delrieu, G., Chapon, B., Kirstetter, P.-E., Nicol, J., and Andrieu, H.: The
15
Boll `ene-2002 experiment: innovative algorithms and evaluation of processing strategies for radar QPE in the C ´evennes-Vivarais region, Proceedings of the 4th European Conference on Radar in Meteorology and Hydrology, Barcelona, Spain, 18-22 September 2006, 157–160, 2006.
Brakensiek, D. L., Engleman, R. L., and Rawls, W. L.: Variation within texture classes of soil
20
water parameters, T. ASAE, 24(2), 335–339, 1981.
Brakensiek, D. L. and Rawls, W. J.: Soil containing rock fragments – effects on infiltration, Catena, 23(1–2), 99–110, 1984.
Brooks, R. H. and Corey, A. T.: Hydraulic properties of porous media, Hydrology Papers, Col-orado State University, USA, 24 pp., 1964.
25
Childs, E. C. and Collins-George, C.: The permeability of porous media, Proc. R. Soc. Lon. Ser.-A, 201, 393–405, 1950.
Ciarapica, L. and Todini, E.: TOPKAPI: a model for the representation of the rainfall-runoff process at different scales, Hydrol. Proc., 16(2), 207–229, 2002.
Cosby, B. J., Hornberger, G. M., Clapp, R. B., and Ginn, T. R.: A statistical exploration of the
30
HESSD
5, 2687–2725, 2008Hydrological responses associated to soil
characteristics
C. Manus et al.
Title Page
Abstract Introduction
Conclusions References
Tables Figures
◭ ◮
◭ ◮
Back Close
Full Screen / Esc
Printer-friendly Version
Interactive Discussion Dehotin, J. and Braud, I.: Which spatial discretization for distributed hydrological models?
Proposition of a methodology and illustration for medium to large-scale catchments, Hydrol. Earth Syst. Sci., 12, 769–796, 2008,
http://www.hydrol-earth-syst-sci.net/12/769/2008/.
Delrieu, G., Ducrocq, V., Gaume, E., Nicol, J., Payrastre, O., Yates, E., Kirstetter, P. E., Andrieu,
5
H., Ayral, P.-A., Bouvier, C., Creutin, J.-D., Livet, M., Anquetin, S., Lang, M., Neppel, L., Obled, C., Parent-du-Ch ˆatelet, J., Saulnier, G.-M., Walpersdorf, A., and Wobrock, W.: The catastrophic flash-flood event of 8–9 September 2002 in the Gard region, France: a first case study for the C ´evennes-Vivarais Mediterranean Hydro-meteorological Observatory, J. Hydrometeorol., 6, 34–52, 2005.
10
FAO: Guidelines for soil profile description, 3rd edition, Food and Agriculture Organization of the United Nations, International Soil Reference Information Centre, Land and Water Devel-opment Division, Rome, Italy, 1990.
Foody, G. M., Ghoniem, E. M., and Arnell, N. W.: Predicting locations sensitive to flash flood in an arid environement, J. Hydrol., 292(1–4), 48–58, 2004.
15
Gaume, E. and Bouvier, C.: Analyse hydro-pluviom ´etrique des crues du Gard et du Vidourle des 8 et 9 septembre 2002, La Houille Blanche, 6, 99–106, 2004.
Gaume, E., Livet, M., Desbordes, M., and Villeneuve, J. P.: Hydrological analysis of the river Aude flash-flood on 12 and 13 November 1999, J. Hydrol., 286, 135–154, 2004.
Georgakakos, K. P.: Analytical results for operational flash flood guidance, J. Hydrol., 317(1–2),
20
81–103, 2006.
Gijsman, A. J., Jagtap, S. S., and Jones, J. W.: Wading through a swamp of complete confusion: how to choose a method for estimating soil water retention parameters for crop models, Eur. J. Agron., 18, 75–105, 2002.
Haverkamp R., Bouraoui, F., Zammit, C., and Angulo- Jaramillo, R.: Soil properties and
mois-25
ture movement in the unsaturated zone, in: Handbook of Groundwater Engineering, edited by: Delleur, J. W., CRC Press LLC, 5–1–5–49, 1999.
Huet, P., Martin, X., Prime, J.-L., Foin, P., Laurain, C., and Cannard, P.: Retour d’exp ´erience des crues de septembre 2002 dans les departments du Gard, de l’H ´erault, du Vaucluse, des Bouches-du-Rh ˆone, de l’Ard `eche et de la Dr ˆome, Technical report, Minist `ere de l’Ecologie
30
et du D ´eveloppement Durable, France, 133 pp., 2003.
catas-HESSD
5, 2687–2725, 2008Hydrological responses associated to soil
characteristics
C. Manus et al.
Title Page
Abstract Introduction
Conclusions References
Tables Figures
◭ ◮
◭ ◮
Back Close
Full Screen / Esc
Printer-friendly Version
Interactive Discussion trophic event, Geophys. Res. Lett., 34(13), L13401, doi:10.1029/2007GL029746, 2007.
Lin, H., Bouma, J., Pachepsky, Y. A., Western, A. W., Thompson, J., van Genuchten, M. T., Vogel, H.-J., and Lilly, A.: Hydropedology: synergetic integration of pedology and hydrology, Water Resour. Res., 42, W05301, doi:10.1029/2005WR004085, 2006.
Marchandise, A.: Mod ´elisation hydrologique distribu ´ee sur le Gardon d’Anduze; ´etude
com-5
parative de diff´erentes mod `eles pluie-d ´ebit, extrapolation de la normale `a l’extr ˆeme et tests d’hypoth `eses sur les processus hydrologiques, Ph.D. Thesis, Universit ´e de Montpellier II, Montpellier, France, 234 pp., 2007 (in French).
Morvan, X., Bruand, A., Cousin, I., Roque, J., Baran, N., and Mouvet, C.: Pr ´ediction des pro-pri ´et ´es de r ´etention en eau des sols d’un bassin versant `a l’aide de fonctions de p ´edotransfert
10
: influence de la densit ´e apparente et de la teneur en ´el ´ements grossiers, ´Etude et Gestion des Sols, 11, 117–135, 2004.
Moussa, R., Chahinian, N., and Bocquillon, C.: Distributed hydrological modelling of a Mediter-ranean mountainous catchment – model construction and multi-site validation, J. Hydrol., 337(1–2), 35–51, 2007.
15
Muste, M., Schone, J., and Creutin, J. D.: Measurement of free-surface flow velocity using controlled surface waves, Flow Meas. Instrum., 16(1), 47–55, 2005.
Nalbantis, I., Obled, C., and Rodriguez, J. Y.: Unit Hydrograph and effective precipitation iden-tification, J. Hydrol., 168(1–4), 127–157, 1995.
Rawls, W. J. and Brakensiek, D. L.: Prediction of soil water properties for hydrologic
mod-20
elling: watershed management in the eighties, Proceedings of the American Society of Civil Engineers symposium, Denver, CO, USA, 30 April–1 May 1985, 293–299, 1985.
Reed, S., Schaake, J., and Zhang, Z.: A distributed hydrologic model and threshold frequency-based method for flash flood forecasting at ungauged locations, J. Hydrol., 337(3–4), 402– 420, 2007.
25
Ross, P. J.: Modeling soil water and solute transport – fast, simplified numerical solutions, Agron. J., 95, 1352–1361, 2003.
Ruin, I., Creutin, J.-D., Anquetin, S., and Lutoff, C.: Human exposure to flash-floods – rela-tion between flood parameter and human vulnerability during a storm of September 2002 in Southern France, J. Hydrol., doi:10.1019/j.jhydrol.2008.07.044, in press, 2008.
30
Saulnier, G. M., Beven, K., and Obled, C.: Including spatially variable effective soil depths in Topmodel, J. Hydrol., 159, 305–333, 1997.
bal-HESSD
5, 2687–2725, 2008Hydrological responses associated to soil
characteristics
C. Manus et al.
Title Page
Abstract Introduction
Conclusions References
Tables Figures
◭ ◮
◭ ◮
Back Close
Full Screen / Esc
Printer-friendly Version
Interactive Discussion ance, Hydrol. Process., 18, 1195–1218, 2004.
Sempere-Torres, D., Obled, C., and Rodriguez, J. Y.: Using the DPFT approach to improve flash flood forecasting model, Nat. Hazards, 5, 17–41, 1992.
Smith, R. E. and Goodrich, D. C.: Rainfall Excess Overland Flow, in: Encyclopedia of Hydro-logical Sciences, John Wiley and Sons Ldt, 1707-1718, 2005.
5
Sobieraj, J. A., Elsenbeer, H., and Vertessy, R. A.: Pedotransfer functions for estimating satu-rated hydraulic conductivity: implications for modeling strom flow generation, J. Hydrol., 251, 202–220, 2001..
Varado, N., Ross, P. J., Braud, I., and Haverkamp, R.: Assessment of an efficient numerical solution of the Richards’ equation for bare soil, J. Hydrol., 323(1–4), 244–257, 2006.
10
Viallet, P., Debionne, S., Braud, I., Dehotin, J., Haverkamp, R., Sa ˆadi, Z., Anquetin, S., Branger, F., and Varado, N.: Towards multi-scale integrated hydrological models using the LIQUID framework, 7th International Conference on Hydroinformatics, Nice, France, 4–8 September 2006, 542–549, 2006.
W ¨osten, J. H. M., Lilly, A., Nemes, A., and Le Bas, C.: Development and use of a database of
15
hydraulic properties of European soils, Geoderma, 90, 169–185, 1999.
Younis, J., Anquetin, S., and Thielen, J.: The benefit of high-resolution operational weather forecasts for flash flood warning, Hydrol. Earth Syst. Sci., 12, 1039–1051, 2008,
http://www.hydrol-earth-syst-sci.net/12/1039/2008/.
HESSD
5, 2687–2725, 2008Hydrological responses associated to soil
characteristics
C. Manus et al.
Title Page
Abstract Introduction
Conclusions References
Tables Figures
◭ ◮
◭ ◮
Back Close
Full Screen / Esc
Printer-friendly Version
Interactive Discussion Table 1.Pedotransfer function as proposed by Cosby et al. (1984).
Function typef , withC=clay (%)S=sand (%)Si=silt (%) c1+c2.C+c3.S+c4.Si
10f 1/f f 10f
Coefficient hbc λ θs Ks
c1 1.54 3.1 50.5 −0.6
c2 0 0.157 −0.0337 −0.0064
c3 −0.0095 −0.003 −0.142 0.0126
HESSD
5, 2687–2725, 2008Hydrological responses associated to soil
characteristics
C. Manus et al.
Title Page
Abstract Introduction
Conclusions References
Tables Figures
◭ ◮
◭ ◮
Back Close
Full Screen / Esc
Printer-friendly Version
Interactive Discussion Table 2. Pedotransfer function as proposed by Rawls and Brakensiek (1985). The domain of
validity is defined as 5%<sand<70% and 5%<clay<60%.
Function typef , with c1+c2.C+c3.S+c4.φ+c5.C2+c6.C.φ+c7.S2 C=clay (%) +c8.S.φ+c9.φ
2
+c10.C.φ 2
+c11.C 2
.S+c12.C
2
.φ S=sand (%) +c13.C.S2+c14.C2.φ2+c15.S2.φ+c16.C2.S2 φ=porosity (m3.m−3) +c17.S2.φ2
exp(f) exp(f) (f) exp(f)
Coefficient hbc λ θr Ks
c1 5.3396738 −0.7842831 −0.01824820 −8.968470
c2 0.1845038 0 0.00513488 −0.028212
c3 0 0.0177544 0.00087269 0
c4 −2.48394546 −1.0624980 0.02939286 19.53480
c5 0.00213853 −0.00273493 −0.00015395 −0.0094125
c6 −0.61745089 0 0 0
c7 0 −0.00005304 0 0.00018107
c8 −0.04356349 −0.03088295 −0.00108270 0.077718
c9 0 1.11134946 0 −8.395215
c10 0.50028060 −0.00674491 −0.00235940 0
c11 0.00000540 0 0 −0.0000035
c12 0.00895359 0.00798746 0.00030703 0.0273300
c13 −0.00001282 −0.00000235 0 0.0000173
c14 −0.00855375 −0.00610522 −0.00018233 −0.0194920
c15 −0.00072472 0 0 0.0014340
c16 0 0 0 0
HESSD
5, 2687–2725, 2008Hydrological responses associated to soil
characteristics
C. Manus et al.
Title Page
Abstract Introduction
Conclusions References
Tables Figures
◭ ◮
◭ ◮
Back Close
Full Screen / Esc
Printer-friendly Version
Interactive Discussion Table 3. Comparison ofKs,θs,hbc,λandηBrooks and Corey (1964) parameters estimated
by the Cosby et al. (1984) (refer as C84) and Rawls and Brakensiek (1985) (refer as RB85) pedotransfer functions. V Cis the coefficient of variation calculated as the standard deviation divided by the average.
hbc(m) Min Median Average Max Std. deviation V C(%)
C84 0.087 0.215 0.265 0.923 0.151 57
RB85 0.068 0.245 0.515 10.070 1.060 206
θs(m−3
m−3
) Min Median Average Max Std. deviation V C(%)
C84 0.023 0.341 0.324 0.491 0.112 35
RB85 0.016 0.337 0.329 0.537 0.128 39
Ks(m s−1
) Min Median Average Max Std. deviation V C(%)
C84 9.19 E-09 2.91 E-07 3.43 E-07 1.06 E-06 2.13 E-07 62 RB85 2.24 E-16 1.31 E-06 3.27 E-06 2.99 E-05 4.70 E-06 144
λ Min Median Average Max Std. deviation V C(%)
C84 0.0801 0.1634 0.1641 0.2721 0.0418 25
RB85 0.0054 0.3190 0.3044 0.5452 0.0845 28
η Min Median Average Max Std. deviation V C(%)
C84 9.35 14.24 15.03 26.98 3.51 23
HESSD
5, 2687–2725, 2008Hydrological responses associated to soil
characteristics
C. Manus et al.
Title Page
Abstract Introduction
Conclusions References
Tables Figures
◭ ◮
◭ ◮
Back Close
Full Screen / Esc
Printer-friendly Version
Interactive Discussion Table 4. Comparison of the maximal and initially available water storage capacities (θs depth
and (θs−θi) depth in m) estimated by the Cosby et al. (1984) (refer as C84) and Rawls and
Brakensiek (1985) (refer as RB85) pedotransfer functions. V C is the Coefficient of Variation calculated as the Standard Deviation divided by the Average.
Maximal water Min Median Average Max Std. deviation V C(%) storage capacity (m)
C84 0.007 0.189 0.246 4.466 0.317 129
RB85 0.008 0.195 0.255 5.202 0.344 135
Initial available water Min Median Average Max Std. deviation V C(%) storage capacity (m)
C84 0.003 0.083 0.095 1.312 0.093 98
HESSD
5, 2687–2725, 2008Hydrological responses associated to soil
characteristics
C. Manus et al.
Title Page
Abstract Introduction
Conclusions References
Tables Figures
◭ ◮
◭ ◮
Back Close
Full Screen / Esc
Printer-friendly Version
Interactive Discussion
(a)
(b)
HESSD
5, 2687–2725, 2008Hydrological responses associated to soil
characteristics
C. Manus et al.
Title Page
Abstract Introduction
Conclusions References
Tables Figures
◭ ◮
◭ ◮
Back Close
Full Screen / Esc
Printer-friendly Version
Interactive Discussion
a)
b) 0 30 50 80 100 200
Depth (cm)
Mediterranean sea
30% Silt
20% Clay
50% Sand
HESSD
5, 2687–2725, 2008Hydrological responses associated to soil
characteristics
C. Manus et al.
Title Page
Abstract Introduction
Conclusions References
Tables Figures
◭ ◮
◭ ◮
Back Close
Full Screen / Esc
Printer-friendly Version
Interactive Discussion Fig. 3.48 h cumulated rain (8 September 2002, O6:00 UTC to 10 September 2002, 06:00 UTC)
HESSD
5, 2687–2725, 2008Hydrological responses associated to soil
characteristics
C. Manus et al.
Title Page
Abstract Introduction
Conclusions References
Tables Figures
◭ ◮
◭ ◮
Back Close
Full Screen / Esc
Printer-friendly Version
Interactive Discussion Fig. 4. Statistics of the porosity for different textures (after Brakensiek and Rawls, 1981). The
HESSD
5, 2687–2725, 2008Hydrological responses associated to soil
characteristics
C. Manus et al.
Title Page
Abstract Introduction
Conclusions References
Tables Figures
◭ ◮
◭ ◮
Back Close
Full Screen / Esc
Printer-friendly Version
HESSD
5, 2687–2725, 2008Hydrological responses associated to soil
characteristics
C. Manus et al.
Title Page
Abstract Introduction
Conclusions References
Tables Figures
◭ ◮
◭ ◮
Back Close
Full Screen / Esc
Printer-friendly Version
Interactive Discussion Fig. 6. Available initial water storage (θs−θi)×depth in mm) based on(a)Cosby et al. (1984)
HESSD
5, 2687–2725, 2008Hydrological responses associated to soil
characteristics
C. Manus et al.
Title Page Abstract Introduction Conclusions References Tables Figures ◭ ◮ ◭ ◮ Back Close
Full Screen / Esc
Printer-friendly Version
Interactive Discussion
8sept-8h 12 16 20 9sept-0h 6 10 14 18 8sept-9h 13 17 21 9sept-1h 5 9 13 17
8sept-8h 12 16 20 9sept-0h 6 10 14 18 8sept-8h 12 16 20 9sept-0h 6 10 14
a) b)
c) d)
time (h) time (h)
time (h) time (h)
S p e c if ic d is c h a rg e (m 3 /s /k m ²) R a in in te n s it y (m m /h ) R a in in te n s it y (m m /h ) S p e c if ic d is c h a rg e (m 3 /s /k m ²)
HESSD
5, 2687–2725, 2008Hydrological responses associated to soil
characteristics
C. Manus et al.
Title Page
Abstract Introduction
Conclusions References
Tables Figures
◭ ◮
◭ ◮
Back Close
Full Screen / Esc
Printer-friendly Version
Interactive Discussion Fig. 8. Maximum specific discharge as a function of catchment size. (Empty squares)
HESSD
5, 2687–2725, 2008Hydrological responses associated to soil
characteristics
C. Manus et al.
Title Page Abstract Introduction Conclusions References Tables Figures ◭ ◮ ◭ ◮ Back Close
Full Screen / Esc
Printer-friendly Version
Interactive Discussion
8sept-8h 12 16 20 9sept-0h 4 8 8sept-8h 12 16 20 9sept-0h 4 8 12
8sept-8h 12 16 20 9sept-0h 4 8 8sept-8h 12 16 20 9sept-0h 4 8 12 16
a) b) c) d) R a in in te n s it y -i n fi lt ra ti o n (m m /h )120 100 80 60 40 20 0 R u n o ff c o e ff ic ie n t 1 0.8 0.6 0.4 0.2 0 1 0.8 0.6 0.4 0.2 0 90 80 70 60 50 40 30 20 10 0
Time (h) Time (h)
R a in in te n s it y -i n fi lt ra ti o n (m m /h ) 140 120 100 80 60 40 20 0 R u n o ff c o e ff ic ie n t 1 0.8 0.6 0.4 0.2 0 1 0.8 0.6 0.4 0.2 0
Time (h) Time (h)
100 90 80 70 60 50 40 30 20 10 0
HESSD
5, 2687–2725, 2008Hydrological responses associated to soil
characteristics
C. Manus et al.
Title Page
Abstract Introduction
Conclusions References
Tables Figures
◭ ◮
◭ ◮
Back Close
Full Screen / Esc
Printer-friendly Version
Interactive Discussion Fig. 10. Mean runoffcoefficient associated to the cumulated rainfall for each sub-catchments
HESSD
5, 2687–2725, 2008Hydrological responses associated to soil
characteristics
C. Manus et al.
Title Page Abstract Introduction Conclusions References Tables Figures ◭ ◮ ◭ ◮ Back Close
Full Screen / Esc
Printer-friendly Version Interactive Discussion 0 0 0 0 0 0 0 0 0 0 0 0 0 0
8sept-8h 12 14 16 18 20 22 9sept-0h 4 6
8
(33)
6 (27) 7 (28) 6 (30) 7 (27) 7 (33)
6 (34)
In fi lt ra ti o n f lo w (m m /h ) Time (h) 60 50 40 30 20 10 0
8sept-8h 10 12 14 16 18 20 22 9sept-0h 4 6
In fi lt ra ti o n f lo w (m m /h ) Time (h) 60 50 40 30 20 10 0 1 0.9 0.8 0.7 0.6 0.5 0.4 0.3 0.2 0.1 Runoff coefficient
HESSD
5, 2687–2725, 2008Hydrological responses associated to soil
characteristics
C. Manus et al.
Title Page Abstract Introduction Conclusions References Tables Figures ◭ ◮ ◭ ◮ Back Close
Full Screen / Esc
Printer-friendly Version
Interactive Discussion
09/09/2002 8thof september 2002
a b c d
f h
e g
time
0850 (UTC) 0940 1500 2147 0850
time time time time time time time Figure 12 θ/θs 0.4 0.6 0.8 1 0 0.2 0.4 0.6 0.8 1 1.2
0.4 0.6 0.8 1
0.4 0.6 0.8 1 0.4 0.6 0.8 1
θ/θs θ/θs θ/θs
θ/θs
0.4 0.6 0.8 1 0.4 0.6 0.8 1 0.4 0.6 0.8 1 0.4 0.6 0.8 1
θ/θs θ/θs θ/θs
D e p th (m ) D e p th (m ) 0 0.2 0.4 0.6 0.8 1 1.2
HESSD
5, 2687–2725, 2008Hydrological responses associated to soil
characteristics
C. Manus et al.
Title Page
Abstract Introduction
Conclusions References
Tables Figures
◭ ◮
◭ ◮
Back Close
Full Screen / Esc
Printer-friendly Version