www.atmos-chem-phys.net/13/10049/2013/ doi:10.5194/acp-13-10049-2013
© Author(s) 2013. CC Attribution 3.0 License.
Atmospheric
Chemistry
and Physics
Laboratory and modeling studies on the effects of water and soot
emissions and ambient conditions on the properties of contrail ice
particles in the jet regime
H.-W. Wong1, A. J. Beyersdorf2, C. M. Heath3, L. D. Ziemba2, E. L. Winstead2, K. L. Thornhill2, K. M. Tacina3, R. C. Ross3, S. E. Albo1, D. L. Bulzan3, B. E. Anderson2, and R. C. Miake-Lye1
1Center for Aero-Thermodynamics, Aerodyne Research, Inc., Billerica, Massachusetts, USA
2Chemistry and Dynamics Branch, Science Directorate, NASA Langley Research Center, Hampton, Virginia, USA 3Combustion Branch, NASA Glenn Research Center, Cleveland, Ohio, USA
Correspondence to:H.-W. Wong ([email protected])
Received: 29 August 2011 – Published in Atmos. Chem. Phys. Discuss.: 28 September 2011 Revised: 14 February 2012 – Accepted: 8 August 2013 – Published: 11 October 2013
Abstract. Contrails and contrail-induced cirrus clouds are identified as the most uncertain components in determining aviation impacts on global climate change. Parameters affect-ing contrail ice particle formation immediately after the en-gine exit plane (<5 s in plume age) may be critical to ice particle properties used in large-scale models predicting con-trail radiative forcing. Despite this, detailed understanding of these parametric effects is still limited. In this paper, we present results from recent laboratory and modeling stud-ies conducted to investigate the effects of water and soot emissions and ambient conditions on near-field formation of contrail ice particles and ice particle properties. The Parti-cle Aerosol Laboratory (PAL) at the NASA Glenn Research Center and the Aerodyne microphysical parcel model for contrail ice particle formation were employed. Our studies show that exhaust water concentration has a significant im-pact on contrail ice particle formation and properties. When soot particles were introduced, ice particle formation was ob-served only when exhaust water concentration was above a critical level. When no soot or sulfuric acid was intro-duced, no ice particle formation was observed, suggesting that ice particle formation from homogeneous nucleation fol-lowed by homogeneous freezing of liquid water was unfavor-able. Soot particles were found to compete for water vapor condensation, and higher soot concentrations emitted into the chamber resulted in smaller ice particles being formed. Chamber conditions corresponding to higher cruising alti-tudes were found to favor ice particle formation. The
micro-physical model captures trends of particle extinction mea-surements well, but discrepancies between the model and the optical particle counter measurements exist as the model pre-dicts narrower ice particle size distributions and ice particle sizes nearly a factor of two larger than measured. These dis-crepancies are likely due to particle loss and scatter during the experimental sampling process and the lack of treatment of turbulent mixing in the model. Our combined experimen-tal and modeling work demonstrates that formation of con-trail ice particles can be reproduced in the NASA PAL fa-cility, and the parametric understanding of the ice particle properties from the model and experiments can potentially be used in large-scale models to provide better estimates of the impact of aviation contrails on climate change.
1 Introduction
climate change with a low level of scientific understanding (Penner et al., 1999; Lee et al., 2009).
The onset of contrail ice particle formation is believed to be within one wingspan behind the engines. Several pro-cesses are involved in the formation of contrail ice par-ticles, including hydrophobic soot surface activation, wa-ter vapor condensation on soot surfaces, freezing of the liquid water soot coatings, and further water vapor con-densation onto frozen ice surfaces (Kärcher et al., 1996, 1998; Kärcher, 1998). The possibility of contrail formation is traditionally described by the Schmidt–Appleman crite-rion (Schmidt, 1941; Appleman, 1953; Schumann, 1996, 2005), which states that a contrail will form if the exhaust plume reaches or surpasses saturation with respect to liq-uid water. The Schmidt–Appleman criterion has been con-firmed by observations to be reliable in predicting contrail formation (Kärcher et al., 1996; Jensen et al., 1998; Pen-ner et al., 1999; Heymsfield et al., 2010), suggesting that the controlling factor for contrail formation is thermodynamics. On the other hand, several inflight measurement and mod-eling studies show that some parameters not considered in the Schmidt–Appleman criterion may affect the properties of contrail ice particles. For example, the European SULFUR inflight measurements (Busen and Schumann, 1995; Schu-mann et al., 1996, 2002) showed that fuel sulfur can activate soot particles to affect number of ice particles formed. In-creased fuel sulfur was also found to cause sooner onset of contrail formation and a 25–50 % increase in number par-ticulates. Recent modeling studies (Kärcher and Yu, 2009; Wong and Miake-Lye, 2010) suggested that soot emissions could affect optical depth of initial contrails and ice parti-cle size and number density. These parameters, though not critical for the threshold temperature of contrail formation, may play an important role in determining ice particle prop-erties used in large-scale models to predict contrail radiative forcing and their climate impacts, especially for scenarios re-flecting future fleet emissions burning alternative fuels. De-tailed understanding of these parametric effects on contrail ice particle properties in the jet regime (i.e., with a plume age<5 s) is still limited. Since in situ measurements of ice particles in aircraft plumes in the jet regime are challeng-ing due to instrument limitations, well-controlled laboratory experiments in concert with modeling studies provide a cost-effective way to understand initial formation mechanisms of contrail ice particles.
This paper discusses results from our coupled laboratory and modeling investigation of the effects of water and soot emissions and ambient conditions on the near-field forma-tion of contrail ice particles. The Particle Aerosol Labora-tory (PAL) at the NASA Glenn Research Center (Tacina and Heath, 2010) was employed to simulate a broad range of conditions that bracket those found in the exhaust from air-craft engines at cruise altitudes. The Aerodyne microphys-ical parcel model for contrail ice particle formation (Wong and Miake-Lye, 2010) was used to guide experimental
de-sign and analyze experimental results. Experimental setup and procedures, modeling methodologies, and the results ob-tained from our studies are presented.
2 Experimental setup and procedures 2.1 NASA’s Particle Aerosol Laboratory
The PAL at the NASA Glenn Research Center (Fig. 1) con-tains a chamber facility designed to study aviation emis-sions at simulated altitudes up to 40 000 ft. During operation, the simulated exhaust is injected upwards into the chamber through a heated transition pipe of 2.43 cm in diameter and 160 cm in length. The transition pipe terminates at a 1.0 cm diameter nozzle centered in the bottom and inside the cham-ber. Upstream of the nozzle exit, an in-line orifice drops the pressure of the exhaust products to near the chamber back-ground pressure. Controlled amounts of soot particles, hu-midified air, sulfuric acid, and other trace species may be ar-tificially introduced into the heated transition pipe to mimic aircraft exhaust. The heated pipe can also be connected to a laboratory-scale combustor burning liquid fuels to provide actual combustion exhaust to the chamber.
The cylindrical test section of the chamber measures 183 cm in height and has an inner diameter of 59.7 cm. A cold nitrogen gas source supplies the working background fluid for the chamber, co-flowing with the nozzle exhaust. Relative humidity of the gas supply may be set up to 100 % for operation temperature below −54.2◦C. Under warmer chamber temperatures, reduced maximum relative humidity levels can be achieved due to facility limitations. A 152 cm tall by 10.2 cm wide instrumentation plate is located on one side of the chamber and contains a series of 1/4 in ports through which exhaust and ice particle samples may be ex-tracted. Three double-paned windows, also 152 cm tall by 10.2 cm wide, are spaced 90◦
apart around the remaining cir-cumference to provide access for optical measurements. The background nitrogen and combustion products exit the cham-ber through an exhaust duct located on top; the exhaust, in turn, is connected to a high-flow vacuum source to maintain the chamber at pressures simulating upper tropospheric con-ditions. More details on chamber operation, including back-ground temperature and pressure profiles, can be found in the paper by Tacina and Heath (2010).
2.2 Sample introduction and instrumentation
To simulate aircraft exhaust gas at cruise, water vapor and soot particles were artificially introduced into the PAL cham-ber via a heated transition pipe upstream of the exhaust noz-zle. The water vapor was introduced by a nafion-tube hu-midifier (Perma Pure, Toms River, NJ). Airflow entering the humidifier is split between 250 nafion tubes. On the outside of the tubes, heated water (70◦
(a) (b)
(c)
Fig. 1.PAL altitude simulation chamber:(a)isometric view,(b)front view, and(c)schematic representation of the PAL pipes and sampling
air stream. The water content of the humidified air can be controlled by varying the airflow rate through the humidifier. A Jing Industries mini-Combustion Aerosol Standard 5200 (miniCAST) burner was used to generate combustion soot particles. The miniCAST burns a mixture of propane and air at variable fuel to air ratios to produce a well-characterized, steady-size output of soot particles. During this experiment, the propane-to-air ratio was set at values to give 30–60 nm di-ameter soot particles, typical of aircraft exhaust (Timko et al., 2010). In addition to water vapor and soot particles, a known amount of CO2gas was injected into the transition pipe as a marker for the characterization of exhaust plume dilution in the chamber. To prevent any microphysics from taking place in the transition pipe, the whole transition pipe was heated to 400◦C. The soot particle mass emitted was measured by a multi-angle absorption photometer (MAAP, Petzold et al., 2005) and the particle size distributions by an engine exhaust particle sizer (EEPS, TSI Inc., St. Paul, MN) before inject-ing into the chamber. The EEPS measured the particle size from 5.6 to 560 nm at 1 Hz. Particles entering the EEPS are charged with a predictable charge based on particle size. The particles then enter the sizing region which is formed by two concentric cylinders with an electric field between them. Par-ticles are repelled from the inner cylinder to the outer cylin-der, which is composed of a series of insulated electrodes. The size of the particles can be derived from the position on the outer cylinder that the charged particles hit (Wang et al., 2006).
To measure ice particle size and number density in the simulated exhaust in the chamber, three horizontal sampling lines with a length of about 30 cm were installed inside the chamber. The entrances of the sampling lines were located at 61, 102 and 147 cm downstream of the exhaust nozzle and aligned with the chamber centerline. Approximately 20 cm of these lines were inside the chamber and therefore at the chamber temperature. The remaining 10 cm were outside the chamber but insulated to reduce sample heating. To charac-terize exhaust plume dilution, a nondispersive infrared CO2 analyzer (LI-7000, LI-COR BioSciences, Lincoln, NE) was employed to measure CO2marker concentration at each sam-pling location and at the exhaust nozzle. One optical parti-cle counter (OPC, Met One Instruments Model 9722, Grants Pass, OR) was connected to each sampling line. In an OPC, airflow is passed through a laser diode beam and the laser light is scattered by the particles in the stream. The scattered light is detected by a photodiode, allowing the particles to be counted, and based on the intensity of the scattered light, the sizes of the particles are determined. The OPCs in our experiments were operated with eight channels that measure ice particle size distributions between 0.3 and 3.0 µm. How-ever, due to low signals (likely because the OPCs were oper-ated at low chamber pressures), the data was combined into two channels (0.3–1.0 and 1.0–3.0 µm, respectively). Sample flow rate through each sampling line was set at 8.8–9.2 stan-dard mL min−1, which included 0.8–1.2 mL min−1 for the
OPC and an 8 mL min−1bypass flow. This flow rate was set to give similar size and concentration response among the OPCs. The high bypass flow rates resulted in very small res-idence time in the sampling lines, reducing heating in the portion of the sampling lines outside of the chamber and minimizing particle evaporation. Our microphysical calcula-tions also confirmed that ice particle evaporation in the sam-pling lines is insignificant. Occasionally, ice formation was seen at the inlet tip inside the chamber. This was particu-larly apparent when operating for a long time at high water concentrations in the exhaust. When this was observed, sam-pling was stopped and helium was back-flowed through the sample lines until the ice was removed. As a precaution, de-icing was also performed periodically throughout the sam-pling (approximately every 20 min).
In addition to the OPCs, a spectrometer system was also employed to measure the optical extinction of ice particles at 61 cm downstream of the nozzle. A 300 W xenon light source was coupled through a liquid light guide and col-limated to a 25 mm diameter beam projected through the chamber windows. A BG4 color glass filter was mounted in the optical path of the collimated light to attenuate the green light and raise the short and long wavelength spec-trometer measurements, facilitating a more uniform inten-sity measurement over the spectral range of the spectrom-eter. The intensity of the light beam was measured using a visible to near infrared (350–1000 nm) spectrometer (Ocean Optics Model USB4000, Dunedin, FL) located in a separate room via 200 µm low OH silica optical fibers with a numeri-cal aperture of 0.22. The spectral range of the measurements were restricted to 380–850 nm due to the limitations caused by the xenon light source, collimation optics and window material. Background corrected light intensity measurements before and during each testing were used to calculated light transmittance (T) of the particles in the exhaust plumes. Ex-tinction coefficients of exhaust plumes (β) over a distance (x) that the light beam traveled was then calculated using the Beer’s law as
β= −
lnT x
. (1)
The extinction coefficient is equal to the product of ice parti-cle number density (N), particle extinction cross section (a, which is proportional to ice particle diameter squared for spherical particles), and extinction efficiency (Qext, which varies within a factor of 2 for particles between 0.5–2 µm in diameter) as
β=N aQext. (2)
AssumingQextis constant and ice particles are spherical in our experiments, we can obtain ice particle size and number density information from the extinction coefficient as
β∝N d2, (3)
2.3 Ranges of the parameters examined
For the sets of experiments presented in this paper, initial wa-ter concentration in the exhaust introduced into the chamber was varied between 0 and 5 % in molar fraction. The num-ber density of the polydisperse soot particles introduced by the miniCAST burner ranged between 103and 107particles per cm3. The ranges of water and soot emissions studied in this work were selected to cover typical aircraft emissions at cruise (about 2.5 % molar fraction of water vapor emissions and about 107cm−3of soot particles). The exhaust temper-ature at the nozzle tip was kept constant at 350 K. Four dif-ferent chamber conditions representing standard day temper-ature and pressure at cruise altitudes between 25 000 ft and 40 000 ft were examined. The chamber background tempera-ture and pressure for each of these altitudes are listed in Ta-ble 1. Relative humidity of the chamber co-flow stream was set at 0 %. This is because we do not believe it plays a critical role in the initial onset of contrail ice particle formation and 0 % relative humidity in the chamber co-flow stream avoids the possible introduction of undesired ice nuclei that may be contained in the chamber humidification air.
Using the widely used exhaust plume mixing law for a buoyant jet in a co-flowing background fluid (Beer and Chigier, 1972), one can calculate plume temperature and wa-ter vapor partial pressure from the tracer measurements as
T−Tb Tex−Tb
= Cw −Cw,b Cw,ext−Cw,b
= Ct −Ct,b Ct,ext−Ct,b
, (4)
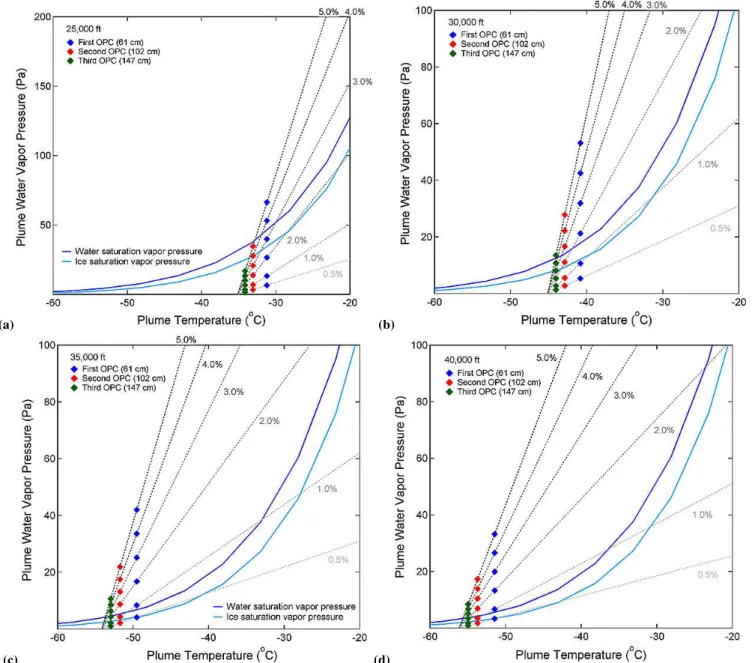
whereT,Cw, andCtare temperature, concentration of water vapor and concentration of tracer species at the sampling lo-cations.Tex,Cw,ext, andCt,extare the same properties at the exhaust nozzle tip, andTb,Cw,b, andCt,b are background (chamber) properties. As described earlier, CO2 was used as a tracer species in our measurements. This was done to avoid potential uncertainties to directly measure water vapor concentrations (due to complex water–particle interactions) and plume temperatures (due to turbulent mixing and cham-ber thermal management). In our experiments,Cw,bandCt,b were set to zero. The exhaust temperature at the nozzle tip (Tex)was set at 350 K and the chamber background tempera-tures (Tb)were set to the values listed in Table 1. This scaling law was found to be robust in laboratory buoyant jets in co-flowing fluids, and our previous experimental work showed that it is valid in the PAL chamber (Tacina and Heath, 2010). Following Eq. (4), one can plot mixing lines of water va-por partial pressure in the plume against plume temperature, alongside liquid water and ice saturation curves, as demon-strated in Fig. 2. Each level of exhaust water corresponds to one of such mixing lines, and according to the Schmidt– Appleman criterion, only those mixing lines crossing above the liquid water saturation curve would result in contrail ice particle formation. For example, an exhaust water molar frac-tion of 0.5 % would not cause contrail formafrac-tion under the
35 000 ft standard day conditions, as shown in Fig. 2c. Using the formulation given by Schumann (1996), one can calcu-late a threshold exhaust water molar fraction (the minimum exhaust water molar fraction for contrail formation) for each temperature/pressure combination. Likewise, one can also calculate a threshold temperature (the highest ambient tem-perature for contrail formation) for each exhaust water level under each temperature/pressure combination. These calcu-lated threshold values are also listed in Table 1.
3 Modeling methodologies
In this work, our microphysical parcel model of ice parti-cle formation in the jet regime at cruise (Wong and Miake-Lye, 2010) was employed to assist experimental data analy-sis. Our model tracks time evolution of a gaseous or a particle species in a jet engine exhaust plume in terms of contribu-tions of chemistry, plume dilution and mixing, and micro-physical processes as (Kärcher, 1998)
dXi dt = dXi dt chemistry
+dXi
dt mixing
+ dXi
dt microphysics . (5)
The contribution of chemistry comes from the chemical mo-lar production rates of gaseous species. In this work, forma-tion of H2SO4from SO3 and water (Brown et al., 1996) is the only significant chemical reaction under the conditions of interest.
The contribution of plume dilution and mixing is described as dXi dt mixing
= Xi−Xamb,i· df (t )
dt · 1
f (t ), (6) wheref (t )is the exhaust mass fraction, which explains how the exhaust is diluted by the co-flowing air as a function of residence time. In our model, a semi-empirical correlation describing the mixing of an axisymmetric jet in a co-flowing ambient fluid (Nickels and Perry, 1996) was used to evalu-ate the plume’s centerline properties. The calculevalu-ated exhaust plume’s centerline temperature, velocity, and dilution ratio as a function of downstream distance were found to be consis-tent with experimental data collected in the chamber (Tacina and Heath, 2010).
The contribution of microphysical processes is further di-vided into contributions of (1) homogeneous nucleation of new liquid particles, (2) coagulation between liquid particles, (3) activation of hydrophobic soot surfaces, (4) condensa-tional growth of water vapor on soot particles, and (5) het-erogeneous freezing of liquid coated soot particles:
dXi dt microphysics
= dXi
dt nucleation
+ dXi
dt coagulation (7)
+dXi
dt activation
+dXi
dt
condensation
+ dXi
(a) (b)
(c) (d)
Fig. 2.Water and ice saturation vapor pressure curves, plume mixing lines for exhaust water levels between 0.5–5 % in molar fraction, and
plume temperature and water vapor pressure at the three sampling locations derived from the tracer measurements under(a)25 000,(b) 30 000,(c)35 000, and(d)40 000 ft standard day conditions in the PAL chamber.
In our model, homogeneous nucleation of new liquid parti-cles is described by the kinetic quasi-unary nucleation theory developed by Yu (2005, 2006, 2007). Coagulation of differ-ent liquid particles is described using Brownian coagulation kernels (Fuchs, 1989). Activation of hydrophobic soot sur-face and condensational growth of water vapor on soot are treated the same way as in Kärcher (1998) and our previ-ous studies (Wong et al., 2008; Wong and Miake-Lye, 2010; Wong et al., 2011). Finally, the heterogeneous freezing rate of liquid water coatings on soot is described by the expres-sion reported by Fornea et al. (2009).
4 Results and discussions
4.1 Effect of exhaust water vapor content
Our first set of experiments investigated the effect of exhaust water vapor content on the formation of contrail ice parti-cles. In this set of experiments, the soot particles introduced by the miniCAST burner were kept constant at 2×105cm−3 with 30 nm in diameter. The chamber background tempera-ture and pressure were also kept constant at 35 000 ft stan-dard day conditions as listed in Table 1 (i.e., −54.2◦C in
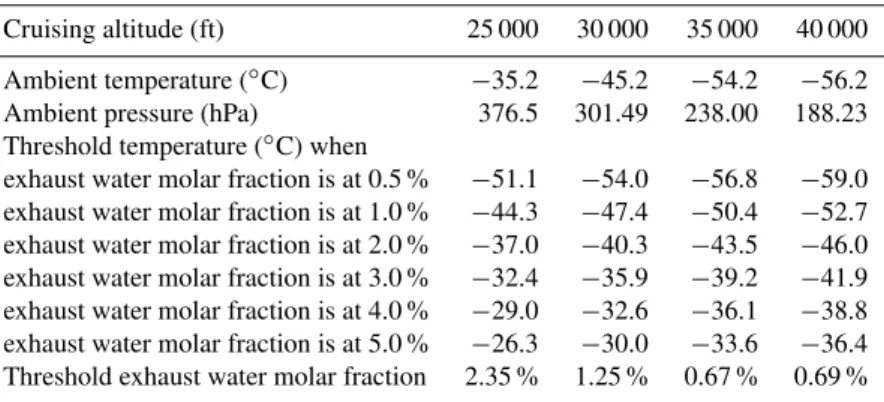
Table 1.Standard day conditions examined in our PAL work and threshold temperature and exhaust water molar fraction for contrail formation associated with each condition. The threshold conditions were calculated using the Schmidt–Appleman criterion formulated in Schumann (1996).
Cruising altitude (ft) 25 000 30 000 35 000 40 000
Ambient temperature (◦C) −35.2 −45.2 −54.2 −56.2 Ambient pressure (hPa) 376.5 301.49 238.00 188.23 Threshold temperature (◦C) when
exhaust water molar fraction is at 0.5 % −51.1 −54.0 −56.8 −59.0 exhaust water molar fraction is at 1.0 % −44.3 −47.4 −50.4 −52.7 exhaust water molar fraction is at 2.0 % −37.0 −40.3 −43.5 −46.0 exhaust water molar fraction is at 3.0 % −32.4 −35.9 −39.2 −41.9 exhaust water molar fraction is at 4.0 % −29.0 −32.6 −36.1 −38.8 exhaust water molar fraction is at 5.0 % −26.3 −30.0 −33.6 −36.4 Threshold exhaust water molar fraction 2.35 % 1.25 % 0.67 % 0.69 %
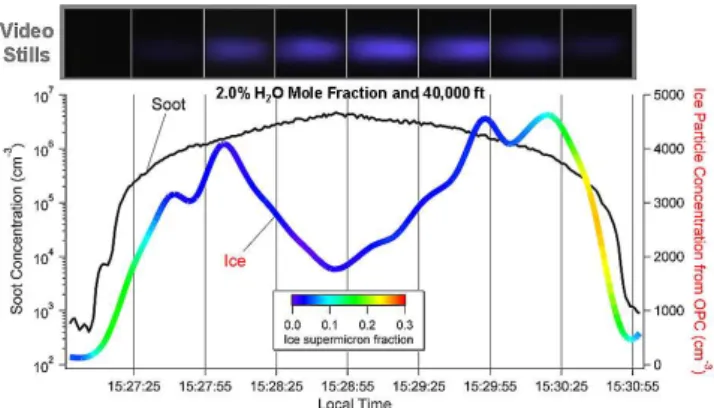
in the exhaust was varied between 0–5 % in molar fraction. To reduce fluctuations in ice particle concentration measure-ments, each level of water vapor content was held constant for approximately 1 min before switching to the next level, as illustrated in Fig. 3. Our experimental results show that exhaust water vapor concentration has a dominant effect on ice particle formation. As shown in Fig. 3, particle extinction coefficients measured at 61 cm downstream of the nozzle in-creased with increasing exhaust water vapor content. OPC measurements, however, did not observe ice particles formed until a certain level of exhaust water content was reached (this level was about 3 % in molar fraction in Fig. 3). Above this level, increased ice particle concentration was measured by the OPC with increasing exhaust water vapor concentra-tion, consistent with the extinction data. Since the Schmidt– Appleman criterion suggests that the threshold exhaust water level is 0.67 % in molar fraction (Table 1), lower than the level observed by the OPC, our measurement results imply that ice particles formed under exhaust water levels lower than 3 % in molar fraction were too small to be detected by the OPC.
To further understand what can be learned from our mea-surement data, we performed detailed microphysical parcel simulations using the model described in Sect. 3. To simplify our simulations, only the dilution profiles describing average mixing behavior in the exhaust centerline were used. As a re-sult, turbulent mixing in the chamber was not considered in calculating dilution history that was used in our microphysi-cal simulations. Note that we did not introduce compounds that can activate hydrophobic soot surfaces in the experi-ments (such as sulfuric acid) but observed ice particle forma-tion in the chamber. Filter samples of the soot particles gen-erated from the miniCast were collected and analyzed with a Sunset Laboratory organic-to-elemental carbon (OC / EC) analyzer (Birch and Cary, 1996), and an OC / EC ratio of 2–5 was found. Because a volatile organic denuder was not used before the filter, this ratio can only be viewed as an up-per limit for the amount of organic carbon. Previous studies
Fig. 3.Effect of water vapor level in the exhaust on ice particle
formation: real-time measurement of OPC ice particle concentra-tion (turquoise) and particle optical extincconcentra-tion coefficient (green) at 61 cm downstream of the exhaust nozzle when the exhaust water vapor level (blue) was varied between 0–4 % in molar fraction in the exhaust. Note that each water level was held constant for ap-proximately 1 min in order for the ice concentrations to stabilize.
have found OC / EC ratios of 1 when the larger version of the miniCAST was used to produce 30 nm soot particles from propane. The OC / EC analysis suggests that the soot surfaces were coated with organic carbon atoms, some of which may be oxygenated, hydrophilic carbon atoms. Consequently, we assumed in the model that 20 % of the soot surface area is pre-activated. We did not observe significant sensitivity to this quantity in our model calculations as long as larger than 5 % of the initial soot surface area was assumed to be acti-vated. Future laboratory studies are planned to quantify and control the hydrophilic fraction of the soot surface.
This is close to the prediction of 0.67 % from the Schmidt– Appleman criterion described earlier. The onset of ice parti-cle formation measured by the OPC, however, is less steep and at a higher exhaust water level. Figure 4a also compares the predicted and measured fraction of the ice particles that are larger than 1 µm (termed as super-micron fraction) as a function of exhaust water level. Similar to what is shown for ice particle concentration, a sharper onset of ice particle super-micron fraction at a lower exhaust water vapor con-centration is predicted by the model compared to the exper-iments. The model also predicts greater ice particle super-micron fraction, which reaches 100 % at exhaust water levels of more than 0.6 % in molar fraction compared to at most about 20 % measured experimentally. The discrepancy be-tween the model and the OPC measurements is due to the overprediction of ice particle size in the model (about a fac-tor of two). This overprediction is likely from two sources. First, the model only considered a smooth dilution history in the chamber centerline and did not consider any turbu-lent mixing effects that could alter the history of water vapor concentration in the radial direction of the chamber. Since turbulent mixing introduces more deviation in the dilution history of water vapor, some liquid water coated soot under threshold conditions might not freeze to form ice particles. Indeed, our model predicted very narrow particle size distri-butions for the PAL experiments, but the OPC measured ice particle super-micron fraction suggests that wider ice par-ticle size distributions existed in the chamber. Second, the model did not consider the potential ice particle scatter and loss in the sampling process. Although particle evaporation was minimized by introducing a high flow rate in the sam-pling lines, particle scatter and loss may not be completely avoided. Since OPCs have a cutoff of particle size at 300 nm, any particle scatter during the sampling process will result in reduced particle size, causing more ice particles undetectable by the OPC and reducing the ice particle concentration mea-sured experimentally. The possible particle scatter and loss in the sampling process may also contribute to the reduction of the ice particle super-micron fraction measured by the OPCs. Although our model showed quantitative disagreement with the OPC measurements, our model is able to capture the trends of the extinction data well, as depicted in Fig. 4b. Both measured extinction coefficients and model predicted ice particle concentration (N) multiplied by particle diam-eter squared (d2) increased with exhaust water vapor levels with the same relative magnitude, consistent with the particle extinction theory described in Eq. (3). Since particle loss and scatter was not a factor in the extinction measurements, this good agreement between the model and the measurements further suggests that particle scatter and loss in the sampling lines was a primary reason responsible for the disagreement between the model and the OPC measurements.
A similar set of experiments varying exhaust water vapor contents were also performed without introducing any soot particles. In that set of experiments, we did not observe any
Fig. 4.Comparison of experimental and modeling results as a
func-tion of exhaust water molar fracfunc-tion at 61 cm downstream of the exhaust nozzle:(a)model predicted and OPC measured ice particle concentration and ice particle super-micron fraction;(b)measured particle optical extinction and predicted ice particle concentration (N) multiplied by particle diameter squared (d2).
evidence of ice particle formation even at an exhaust water vapor level of 5 % in molar fraction. This suggests that ice particle formation from homogeneous nucleation followed by homogeneous freezing of liquid water is unfavorable un-der the conditions studied in this work. Note that a back-ground particle concentration between 10 and 400 cm−3was measured using a condensation particle counter at the top of the chamber, regardless the amount of water injection into the chamber. These background particles may serve as ice nuclei, but the amount of ice particles measured from the OPCs was negligible and no visual contrail was observed in the video snapshots. Also note that this observation may change if sul-furic acid is present in the exhaust, as suggested by the recent modeling study by Kärcher and Yu (2009).
4.2 Effect of soot emissions
but with variable soot particle concentrations ranging from 102–107cm−3. Figure 5 illustrates one of these sets of ex-periments, where exhaust water level was set at 2 % in mo-lar fraction and the chamber was set at 40 000 ft standard day conditions (−56.2◦
C and 188.23 hPa). Note that the soot par-ticles introduced in this experiment set were kept as close to the same size as possible, and soot particle concentra-tion was increased from about 103 to 107cm−3 and back to 103cm−3 to study experimental reproducibility. A video camera focused on the intersection of the xenon light beam and the exhaust plume was employed for visual confirma-tion of particle formaconfirma-tion. As shown in the figure, maximum ice number concentration measured by the OPC at 61 cm downstream of the nozzle was observed at a soot concen-tration of about 106cm−3. When soot particle concentration was introduced above this level, the measured ice particle concentration decreased. However, particles were still vis-ible in the video snap shots when OPC measured this re-duced ice concentration. This is likely due to the size limita-tion of the OPC, by which any liquid or ice particles smaller than 300 nm in diameter cannot be detected. The decrease in ice particle super-micron fraction with increasing number of soot particles injected into the chamber (color coded in the ice concentration curve in Fig. 5) further supports this state-ment. Our OPC results suggest that smaller ice particles were formed when higher concentration of soot particles was in-troduced, implying that competition for water vapor conden-sation among soot particles existed. This is also consistent with findings from our previous modeling study (Wong and Miake-Lye, 2010).
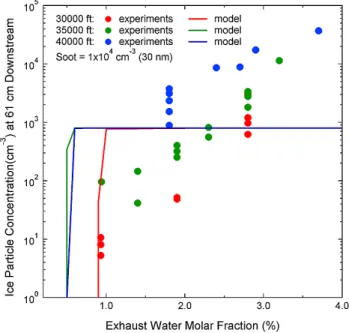
We again performed model simulations to assist experi-mental data analysis and interpretation. Figure 6a shows a comparison between the predicted and measured ice par-ticle concentration under two different exhaust water lev-els at 30,000 ft standard day conditions (−45.2◦
C and 301.49 hPa). As shown in the figure, model predicted ice par-ticle concentrations at initial soot concentrations lower than about 1×105cm−3agree very well with experimental data
when exhaust water level is at 2–3 % in molar fraction. How-ever, at soot concentrations higher than 1×105cm−3, the
model overpredicts ice particle concentrations by as large as about two orders of magnitude. This is because the model overpredicted ice particle size (by about a factor of two, sim-ilar to what is mentioned in the previous section), and con-sequently the number of ice particles that are larger than the OPC cutoff at 300 nm was overpredicted. The size dis-crepancy between the model and experiments may be due to particle scatter and loss during the sampling process not ac-counted for in the model, as discussed previously. At 0.5 % molar fraction of exhaust water level, the model predicted no ice particle formation, the same trend observed experimen-tally for 0–1 % exhaust water molar fraction. This is because at 30 000 ft standard day conditions, at least 1.25 % molar fraction of exhaust water level is needed to induce contrail formation, as listed in Table 1. This set of results suggest that
Fig. 5.The OPC measured ice particle concentration and ice
super-micron fraction along with video snap shots during a soot concen-tration scan.
our PAL measurements can reproduce what is predicted from the Schmidt–Appleman criterion very well and can be used as a well-controlled and cost-effective way to study contrail ice formation.
Figure 6b compares model predicted and measured ice particle super-micron fraction at 61 cm downstream of the nozzle. The figure shows that the model is able to capture the fall-off of the super-micron fraction when exhaust water level is at 2–3 % in molar fraction. The predicted ice parti-cle super-micron fraction from the model, however, is about a factor of two larger than what was measured experimen-tally. Again, this is likely due to the effect of particle scatter and loss in the sampling lines and the lack of turbulent mix-ing treatment in the model. Since no significant amount of ice particles was measured or predicted at an exhaust water level of 0–1 % in molar fraction (Fig. 6a), a large uncertainty in the experimental super-micron fraction exists at this ex-haust water level and its comparison to model predicted zero super-micron fraction is not meaningful.
The model predicted ice particle concentration (N ) multi-plied by ice particle diameter squared (d2) was again com-pared to the measured particle extinction data for this set of experiments, as illustrated in Fig. 6c. Both extinction co-efficients and model predicted N d2 values increased with increasing soot concentration introduced into the chamber. The linearity of the increase before a soot concentration of 1×105cm−3 suggests that soot particles served as ice
(a)
(b)
(c)
Fig. 6.Comparison of(a)model predicted and measured ice particle concentration from the OPCs (note that at 0.5 % molar fraction of exhaust water level, the model predicted no ice particle formation), (b)model predicted and measured ice particle super-micron frac-tion, and(c)measured ice particle extinction coefficients and model predicted ice particle concentration (N) multiplied by particle di-ameter squared (d2). The measurements were performed at 61 cm downstream of the nozzle under 30 000 ft standard day conditions.
Fig. 7.Comparison of experimental and modeling results on OPC
measured ice particle concentration at 61 cm downstream of the nozzle under three different chamber conditions.
4.3 Effect of chamber conditions
5 Conclusions
In this paper, we present results from our recent laboratory and modeling investigation of the effects of water and soot emissions and ambient conditions on the near-field forma-tion of contrail ice particles. The Particle Aerosol Laboratory (PAL) at the NASA Glenn Research Center and the Aero-dyne microphysical parcel model for contrail ice particle for-mation were employed. Our studies show that exhaust water level has a significant effect on contrail ice particle forma-tion. An onset exhaust water level of ice particle formation existed when soot was present. When no soot or sulfuric acid was introduced, ice particle formation from homogeneous nucleation followed by homogeneous freezing of liquid wa-ter was found to be unfavorable. Soot particles were found to compete for water vapor condensation, and higher soot concentration emitted into the chamber resulted in smaller ice particles. Chamber conditions corresponding to higher altitude cruising conditions were found to favor ice parti-cle formation as expected. The microphysical model captures the trends of extinction data well, but discrepancies between the model and the OPC measurements exist. These discrep-ancies are likely due to particle loss and scatter during the experimental sampling process and the lack of treatment of turbulent mixing in the model. Our work demonstrates that the NASA Glenn PAL facility is able to reproduce contrail ice particle formation under inflight measurement conditions. Parametric understanding obtained from our combined mod-eling and experimental approach can provide better estimates of ice particle properties, such as number density and size, used in large-scale models predicting contrail radiative forc-ing and contrail climate impact. Potential extension of our work includes studying the effects of soot surface coverage, soot surface hydrophilicity, and sulfuric acid concentration on contrail ice particle formation using a combination of the PAL and the microphysical model.
Acknowledgements. The authors are grateful for financial support from the Federal Aviation Agency (FAA) Aviation Climate Change Research Initiative (ACCRI) via the Department of Transportation Volpe Center (Contract No. DTRT57-10-C-10014) and the NASA Subsonic Fixed-Wing, Clean Energy and Emissions Project.
Edited by: A. Nenes
References
Appleman, H.: The formation of exhaust condensation trails by jet aircraft, B. Am. Meteor. Soc., 34, 14–20, 1953.
Beer, J. M. and Chigier, N. A.: Combustion Aerodynamics, Halsted Press Division, John Wiley and Sons, Inc., New York, NY, 1972. Birch, M. E. and Cary, R. A.: Elemental carbon-based method for monitoring occupational exposures to particulate diesel exhaust, Aerosol Sci. Technol., 25, 221–241, 1996.
Busen, R. and Schumann, U.: Visible contrail formation from fu-els with different sulfur contents, Geophys. Res. Lett., 22, 1357– 1360, 1995.
Brasseur, G. P. and Gupta, M.: Impact of aviation on climate, B. Am. Meteor. Soc., 91, 461–463, 2010.
Brown, R. C., Anderson, M. R., Miake-Lye, R. C., Kolb, C. E., Sorokin, A. A., and Buriko, Y. Y.: Aircraft exhaust sulfur emis-sions, Geophys. Res. Lett., 23, 3603–3606, 1996.
Fornea, A. P., Brooks, S. D., Dooley, J. B., and Saha, A.: Heteroge-neous freezing of ice on atmospheric aerosols, J. Geophys. Res., 114, D13201, doi:10.1029/2009JD011958, 2009.
Fuchs, N. A.: The mechanics of aerosols, 2nd Edn., Dover Publica-tions, Inc., New York, NY, 1989.
Heymsfield, A., Baumgardner, D., DeMott, P., Forster, P., Gierens, K., and Kärcher, B.: Contrail microphysics, B. Am. Meteor. Soc., 91, 465–472, 2010.
Jensen, E., Toon, O., Kinne, S., Sachse, G., Anderson, B., Chan, K., Twohy, C., Gandrud, B., Heymsfield, A., and Miake-Lye R.: En-vironmental conditions required for contrail formation and per-sistence, J. Geophys. Res., 103, 3929–3936, 1998.
Kärcher, B.: Physicochemistry of aircraft-generated liquid aerosols, soot, and ice particles 1. Model description, J. Geophys. Res., 103, 17111–17128, 1998.
Kärcher, B. and Yu, F.: Role of aircraft soot emissions in contrail formation, Geophys. Res. Lett., 36, L01804, doi:10.1029/2008GL036649, 2009.
Kärcher, B., Peter, T., Biermann, U. M., and Schumann, U.: The initial composition of jet condensation trails, J. Atmos. Sci., 53, 3066–3083, 1996.
Kärcher, B., Rusen, R., Petzold, A., Schroder, F. P., and Schumann, U.: Physicochemistry of aircraft-generated liquid aerosols, soot, and ice particles 2. Comparison with observations and sensitivity studies, J. Geophys. Res., 103, 17129–17147, 1998.
Lee, D. S., Fahey, D. W., Forster, P. M., Newton, P. J., Wit, R. C. N., Lim, L. L., Owen, B., and Sausen, R.: Aviation and global climate change in the 21st century, Atmos. Environ., 43, 3520– 3537, 2009.
Nickels, T. B. and Perry, A. E.: An experimental and theoretical study of the turbulent coflowing jet, J. Fluid Mech., 309, 157– 182, 1996.
Penner, J. E., Lister, D. H., Griggs, D. J., Dokken, D. J., and McFar-land, M. (Eds.): Aviation and the global atmosphere, Cambridge University Press, Cambridge, UK, 1999.
Petzold, A., Schloesser, H., Sheridan, P. J., Arnott, W. P., Ogren, J. A., and Virkkula, A.: Evaluation of multiangle absorption photometry for measuring aerosol light absorption, Aerosol Sci. Technol., 39, 40–51, 2005.
Schmidt, E.: Die entstehung von eisnebel aus den auspuffgasen von flugmotoren, Schriften der Deutschen Akademie der Luftfahrt-forschung, 44, 1–15, 1941.
Schumann, U.: On conditions for contrail formation from aircraft exhausts, Meteorol. Zeitschrift, 5, 4–23, 1996.
Schumann, U.: Formation, properties and climate effects of con-trails, C. R. Phys., 6, 549–565, 2005.
Schumann, U., Arnold, F., Busen, R., Curtius, J., Kärcher, B., Kiendler, A., Petzold, A., Schlager, H., Schröder, F., and Wohl-from, K.-H.: Influence of fuel sulfur on the composition of air-craft exhaust plumes: The experiments SULFUR 1–7, J. Geo-phys. Res., 107, 4247, doi:10.1029/2001JD000813, 2002. Tacina, K. M. and Heath, C. M.: Evolution of combustion-generated
particles at tropospheric conditions, in: Proceedings of ASME Turbo Expo 2010: Power for Land, Sea and Air (GT2010), Glas-gow, UK, 14–18 June, 2010, Vol. 2: Combustion, Fuels and Emissions, Parts A and B, ISBN 978-0-7918-4397-0, Paper No. GT2010-23689, 1289–1299, 2010.
Timko, M. T., Onasch, T. B., Northway, M. J., Jayne, J. T., Cana-garatna, M., Herndon, S. C., Wood, E. C., Miake-Lye R. C., and Knighton, W. B.: Gas turbine engine emissions part 2. Chemi-cal properties of particulate matter, ASME J. Eng. Gas Turbines Power, 132, 061505, doi:10.1115/1.4000132, 2010.
Wang, J. Storey, J., Domingo, N., Huff, S., Thomas, J., and West, B.: Studies of diesel engine particle emissions during transient operations using an engine exhaust particle sizer, Aerosol Sci. Technol., 40, 1002–1015, 2006.
Wong, H.-W. and Miake-Lye, R. C.: Parametric studies of contrail ice particle formation in jet regime using microphysical parcel modeling, Atmos. Chem. Phys., 10, 3261–3272, 2010,
http://www.atmos-chem-phys.net/10/3261/2010/.
Wong, H.-W., Yelvington, P. E., Timko, M. T., Onasch, T. B., Miake-Lye, R. C., Zhang, J., and Waitz, I. A.: Microphysi-cal modeling of ground-level aircraft-emitted aerosol formation: Roles of sulfur-containing species, J. Propul. Power, 24, 590– 602, 2008.
Wong, H.-W., Yu, Z., Timko, M. T., Herndon, S. C., Blanco, E. d. l. R., and Miake-Lye, R. C.: Design parameters for an aircraft engine exit plane particle sampling system, ASME J. Eng. Gas Turbines Power, 133, 021501, doi:10.1115/1.4001979, 2011. Yu, F.: Quasi-unary homogeneous nucleation of H2SO4-H2O, J.
Chem. Phys., 122, 074501, doi:10.1063/1.1850472, 2005. Yu, F.: Binary H2SO4-H2O homogeneous nucleation based on
ki-netic quasi-unary nucleation model: Look-up tables, J. Geophys. Res., 111, D04201, doi:10.1029/2005JD006358, 2006.