The Influence of the CHIEF Pathway on
Colorectal Cancer-Specific Mortality
Martha L. Slattery*, Abbie Lundgreen
Department of Internal Medicine, University of Utah Health Sciences Center, 383 Colorow Building, Salt Lake City, Utah, United States of America
Abstract
Many components of the CHIEF (Convergence of Hormones, Inflammation, and Energy Related Factors) pathway could influence survival given their involvement in cell growth, apoptosis, angiogenesis, and tumor invasion stimulation. We used ARTP (Adaptive Rank Truncation Product) to test if genes in the pathway were associated with colorectal cancer-specific mortality. Colon cancer (n51555) and rectal cancer (n5754) cases were followed over five years. Age, center, stage at diagnosis, and tumor molecular phenotype were considered when calculating ARTP p values. A polygenic risk score was used to summarize the magnitude of risk associated with this pathway. The JAK/STAT/SOC was significant for colon cancer survival (PARTP50.035). Fifteen genes (DUSP2, INFGR1, IL6, IRF2, JAK2,
MAP3K10, MMP1, NFkB1A, NOS2A, PIK3CA, SEPX1, SMAD3, TLR2, TYK2, and VDR) were associated with colon cancer mortality (PARTP,0.05);JAK2 (PARTP
50.0086),PIK3CA(PARTP50.0098), andSMAD3(PARTP50.0059) had the
strongest associations. Over 40 SNPs were significantly associated with survival within the 15 significant genes (PARTP,0.05).SMAD3had the strongest
association with survival (HRGG2.46 95% CI 1.44,4.21 PTtrnd50.0002). Seven
genes (IL2RA, IL8RA, IL8RB, IRF2, RAF1, RUNX3, andSEPX1) were significantly associated with rectal cancer (PARTP,0.05). The HR for colorectal cancer-specific
mortality among colon cancer cases in the upper at-risk alleles group was 11.81 (95% CI 7.07, 19. 74) and was 10.99 (95% CI 5.30, 22.78) for rectal cancer. These results suggest that several genes in the CHIEF pathway are important for colorectal cancer survival; the risk associated with the pathway merits validation in other studies.
OPEN ACCESS
Citation:Slattery ML, Lundgreen A (2014) The Influence of the CHIEF Pathway on Colorectal Cancer-Specific Mortality. PLoS ONE 9(12): e116169. doi:10.1371/journal.pone.0116169
Editor:Francisco X. Real, Centro Nacional de Investigaciones Oncolo´gicas (CNIO), Spain
Received:September 18, 2014
Accepted:November 30, 2014
Published:December 26, 2014
Copyright:ß2014 Slattery, Lundgreen. This is an open-access article distributed under the terms of theCreative Commons Attribution License, which permits unrestricted use, distribution, and repro-duction in any medium, provided the original author and source are credited.
Data Availability: The authors confirm that, for approved reasons, some access restrictions apply to the data underlying the findings. Ethical restrictions apply to the patient-level dataset underlying the analyses presented, because of nature of consent forms signed, personnel information contained in the database, and the IRB approval. These restrictions prevent the data from being made fully available in a public repository. Interested researchers are kindly asked to contact the corresponding author for additional information.
Funding:Funding was provided by the National Institute of Health (CA48998), which had no role in study design, data collection and analysis, decision to publish, or preparation of the manuscript.
Introduction
The CHIEF (Convergence of Hormones, Inflammation, and Energy Related Factors) pathway integrates elements central to the etiology of colorectal cancer (CRC) [1]. The pathway was developed based on our knowledge of the
epidemiology of CRC and genes that may influence cancer risk through major components of the pathway, including hormones, inflammation, and energy-related factors [1]. Many genes in the pathway could influence tumor progression and prognosis given their involvement cell growth, apoptosis, promotion of inflammation and angiogenesis, immune response, and stimulation of tumor invasion and metastasis [2]. The main trunk of the pathway contains a serine/ threonine protein kinase 11 (STK11 or LKB1), mammalian target of rapamycin (MTOR), and the tumor suppressor PTEN (phosphatase tensin homolog deleted on chromosome 10). STK11 responds to changes in cellular energy balance (ATP levels) [3,4] and governs whole body insulin sensitivity [5,6]. NFkB is an important nuclear transcription factor that regulates cytokines and is critical for the regulation of tumorigenesis, cell proliferation, apoptosis, response to oxidative stress, and inflammation while vascular endothelial growth factor (VEGF) plays an important role in regulation of cell growth signaling and is a major mediator of tumor angiogenesis [7] [8].
Cytokines such as interleukins, TGFb-signaling pathway, interferons, and tumor necrosis factor (TNF), are key elements of the inflammatory process in the CHIEF pathway. The TGF-b-signaling pathway is involved in all aspects of tumorigenesis, including stimulation of tumor invasion and metastasis [2]. Signal transduction and activation of transcription (STAT) and mitogen-activated kinases (MAPK) genes are involved in both inflammation and metabolic signaling associated with hormones and energy-related factors. MAPKs serve as an
integration point for multiple biological signals and are involved in a variety of cellular processes such as proliferation. Angiogenesis and inflammation are hallmark features of tumorigenesis [9] as well as key elements in the CHIEF pathway, thus it is reasonable to hypothesis that pathway influences survival.
Methods
Two study populations are included in these analyses. The first study, a population-based case-control study of colon cancer, included cases (n51,555 with complete genotype data) identified between October 1, 1991 and September 30, 1994 living in the Twin Cities Metropolitan Area or a seven-county area of Utah or enrolled in the Kaiser Permanente Medical Care Program of Northern California (KPMCP) [11]. The second study, with identical data collection methods, included cases with cancer of the rectosigmoid junction or rectum (n5754 cases with complete genotype data) who were identified between May 1997 and May 2001 in Utah and at the KPMCP [12]. Eligible cases were between 30 and 79 years of age at the time of diagnosis, living in the study geographic area, English speaking, mentally competent to complete the interview, and with no previous history of CRC, and no previous diagnosis of familial adenomatous polyposis, ulcerative colitis, or Crohn’s disease. Cases who did not meet these criteria were ineligible as were individuals who were not black, white, Hispanic, or Asian (for the rectal cancer study). All study participants provided written informed consent on Institutional Review Board approved consent forms prior to completing the study questionnaire; the consent form and study protocol was approved by the Institutional Review Board on Human Subjects at the University of Utah, Kaiser Permanente Medical Research Program, and the University of Minnesota.
Tumor Registry Data
Tumor registry data were obtained to determine disease stage at diagnosis and months of survival after diagnosis. Disease stage was categorized using the sixth edition of the American Joint Committee on Cancer (AJCC) staging criteria. One pathologist in Utah did all disease staging. Local tumor registries provided information on patient follow-up including vital status, cause of death, and contributing cause of death. Follow-up was obtained for all study participants and was terminated for the Colon Cancer Study in 2000 and for the Rectal Cancer Study in 2007. At that time all study participants had over five years of follow-up.
Tumor Marker Data
Tumors were defined by specific molecular alterations: any TP53 mutation; any
KRAS mutation; MSI+; and CpG Island Methylator Phenotype (CIMP). CIMP status was based on the classic panel and defined as positive if at least two of five markers were methylated [13]. Microsatellite instability (MSI) was based on
TagSNP Selection and Genotyping
TagSNPs were selected using the following parameters: r250.8 defined LD blocks using a Caucasian LD map, minor allele frequency (MAF).0.1, range521500 bps from the initiation codon to +1500 bps from the termination codon, and 1 SNP/LD bin. All markers were genotyped using a custom multiplexed bead array assay format based on GoldenGate chemistry (Illumina, San Diego, California). A genotyping call rate of 99.85% was attained. Blinded internal replicates
represented 4.4% of the sample set. The duplicate concordance rate was 100.00%.
S1 Table list all genes included in the sub-pathway whileS2 Tablelist number of SNPs assessed for each gene and the PARTP value for each gene on the platform.
We analyzed data from 155 genes which included 10 genes that were previously assessed in our lab (VDR,ESR1,ESR2,AR,IGF1,IGF1R,IGFBR3,IRS1,IRS2, and
PPARG) along with 145 genes from the Illumina platform. The initial platform included 1536 SNPs, of these, 1381 were successfully analyzed by Illumina. We included in our analysis only those SNPs were.95% of the population had results, leaving 1246 SNPs for analysis No imputation was done.
Statistical Methods
The goal of the analysis was to evaluate the overall associations between genes and pathways as they relate to colon and rectal cancer survival. To do this, we used ARTP, a statistical program that utilizes a highly efficient permutation algorithm to determine significance at the gene, sub-pathway, and pathway level for survival after diagnosis with colon or rectal cancer [16]. Vital status and survival months were permuted 10,000 times within R version 3.0.2 (R Foundation for Statistical Computing, Vienna, Austria). Since our focus was on colorectal cancer-specific mortality, people who died from other causes or who were lost to follow-up were censored at the date of death or last contact. Months of survival were calculated from date of diagnosis until end of follow-up or date of last contact. Cox Proportional Hazards models were adjusted for age, race/ethnicity, sex, AJCC stage, and tumor molecular phenotype. Tumors were defined by specific
approach is top down: looking at the overall pathway (where number of genes are adjusted), genes (where number of SNPs are adjusted), and SNPs that contribute to significant permutated PARTP values. Genes were assigned to only one
sub-pathway prior to the hierarchical analyses. However, we realize many genes could function in other sub-pathways to which they were not assigned for analysis.
To summarize the risk associated with the CHIEF pathway, we calculated polygenic summary scores. To conservatively estimate risk, we included in the risk models SNPs from genes where the gene ARTP p values were 0.10 or less and the SNP p values within those genes were 0.10 or less. Our analysis includes SNPs with p,0.10 only from those genes where the PARTPwas,0.10. Thus, we include SNPs
that were not statistically significant and we omit SNPs that were statistically significant in genes where the PARTP was.0.10. Since genes are associated with
multiple sub-pathways, we did not restrict to genes where the sub-pathway was significant. If SNPs within the same gene had r2values of 0.80 or greater only one SNP was included in the model. Risk was modeled using at-risk alleles, using all genotypes with the low-risk genotype or referent group as zero. For the co-dominant or additive model a score of zero, one, or two was assigned relative to the number of at-risk alleles, while scores of zero or two were assigned for the dominant and recessive models in order to capture the risk associated with the various genotypes. Polygenic scores were then used to summarize risk across the genes and SNPs to better capture the risk associated with the pathway.
Results
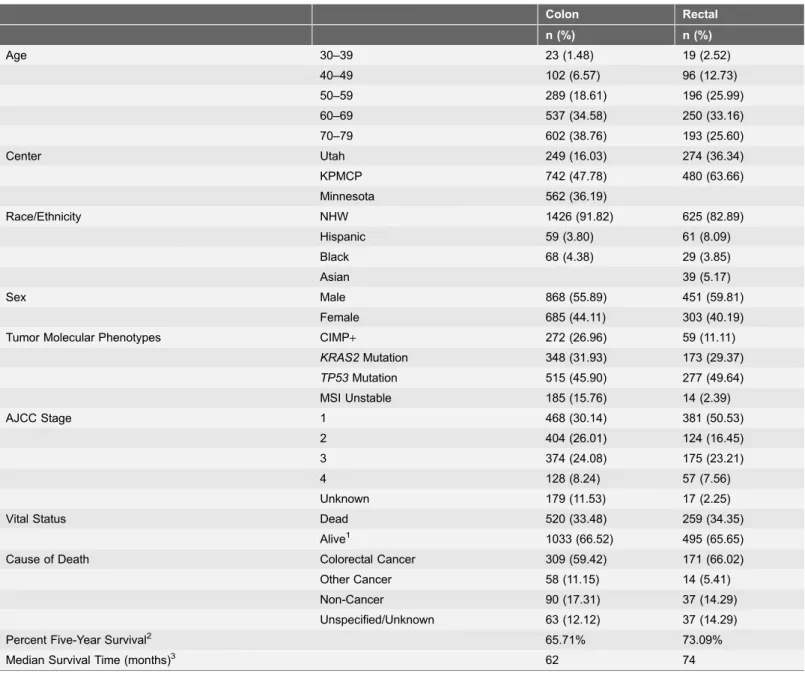
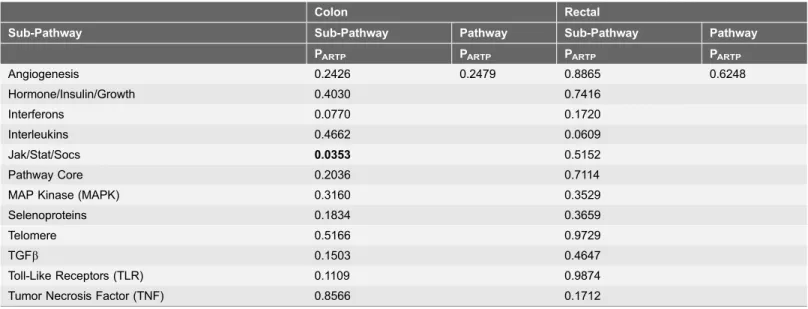
The majority of study participants were over 60 years of age, were non-Hispanic white, and male (Table 1). Most cases were diagnosed with an AJCC Stage 1 or 2 tumor. At the end of follow-up roughly 35% of study participants had died. The overall pathway was not statistically significantly associated with survival for either colon or rectal cancer (Table 2). However, the JAK/STAT/SOC was significant for colon cancer survival (PARTP50.035) and the interleukin pathway was of
borderline significance for rectal cancer (PARTP50.06).
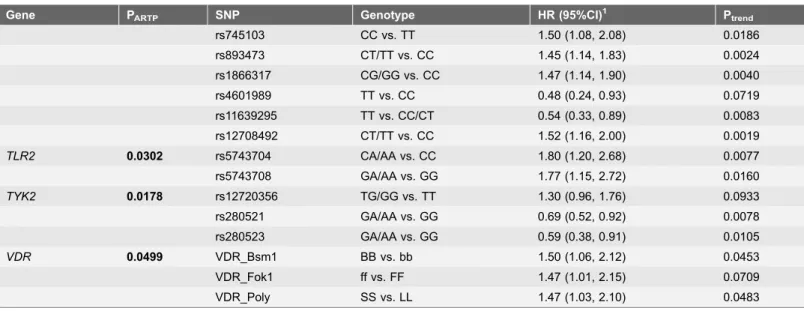
However several genes within the sub-pathways were significant for colon (Table 3) and rectal (Table 4) cancer mortality. Fifteen genes (DUSP2, INFGR1, IL6, IRF2, JAK2, MAP3K10, MMP1, NFkB1A, NOS2A, PIK3CA, SEPX1, SMAD3, TLR2, TYK2, andVDR) were significantly associated with colon cancer mortality at the,0.05 level; an additional 15 genes had gene PARTPvalues between 0.05 and
0.10 (seeS3 Table). The genes that were most significantly associated with survival were JAK2 (PARTP50.0086),PIK3CA (PARTP50.0098), and SMAD3
(PARTP50.0059). Over 40 SNPs were significantly associated with survival within
the 15 significant genes (PARTP,0.05). Of these SNPs,SMAD3 had the strongest
association with survival (HRGG2.46 95% CI 1.44,4.21 PLRT50.0002). Ten SNPs
in five genes had P values less than 0.005, including IL6rs1800796 (HRGG 0.55
95% CI 0.36, 0.84), IRF2 rs12504466 (HRTT1.51 95% CI 1.14,1.99), rs793814
0.50,0.89), JAK2 rs7043371 (HRAT/TT 0.63 95% CI 0.47,0.84) and rs10815160
(HRTT1.62 95% CI 1.07,2.47),SEPX1rs732510 (HRAA/AG1.47 95% CI 1.13,1.90),
andSMAD3 rs893473 (HRCC1.45 95% CI 1.14,1.83) rs1866317 (HRCC1.47 95%
CI 1.14,1.90), and rs12708492 (HRCC 1.52 95% CI 1.16,2.00).
Fewer genes were associated with survival after diagnosis with rectal cancer than for colon cancer (Table 4). Seven genes (IL2RA, IL8RA, IL8RB, IRF2, RAF1,
RUNX3, andSEPX1) had PARTPvalues,0.05, while nine genes (BMP1,BMPR1A,
Table 1.Description of study population.
Colon Rectal
n (%) n (%)
Age 30–39 23 (1.48) 19 (2.52)
40–49 102 (6.57) 96 (12.73)
50–59 289 (18.61) 196 (25.99)
60–69 537 (34.58) 250 (33.16)
70–79 602 (38.76) 193 (25.60)
Center Utah 249 (16.03) 274 (36.34)
KPMCP 742 (47.78) 480 (63.66)
Minnesota 562 (36.19)
Race/Ethnicity NHW 1426 (91.82) 625 (82.89)
Hispanic 59 (3.80) 61 (8.09)
Black 68 (4.38) 29 (3.85)
Asian 39 (5.17)
Sex Male 868 (55.89) 451 (59.81)
Female 685 (44.11) 303 (40.19)
Tumor Molecular Phenotypes CIMP+ 272 (26.96) 59 (11.11)
KRAS2Mutation 348 (31.93) 173 (29.37)
TP53Mutation 515 (45.90) 277 (49.64)
MSI Unstable 185 (15.76) 14 (2.39)
AJCC Stage 1 468 (30.14) 381 (50.53)
2 404 (26.01) 124 (16.45)
3 374 (24.08) 175 (23.21)
4 128 (8.24) 57 (7.56)
Unknown 179 (11.53) 17 (2.25)
Vital Status Dead 520 (33.48) 259 (34.35)
Alive1 1033 (66.52) 495 (65.65)
Cause of Death Colorectal Cancer 309 (59.42) 171 (66.02)
Other Cancer 58 (11.15) 14 (5.41)
Non-Cancer 90 (17.31) 37 (14.29)
Unspecified/Unknown 63 (12.12) 37 (14.29)
Percent Five-Year Survival2 65.71% 73.09%
Median Survival Time (months)3 62 74
1Includes cases lost to follow-up within five years of diagnosis. 2
Excludes cases lost to follow-up within five years of diagnosis.
3
Time from diagnosis to death or last follow-up.
ESR2, IL1A,IL3,PRKAG2,SOCS1,STK11, and TSC2) had PARTP values between
0.05 and 0.10 (S4 Table).SEPX1 rs732510 was associated with both colon and rectal mortality with similar magnitudes of association. Several SNPs in the genes with PARTP,0.05 also had linear trend P values of ,0.005, including IR2RA
rs7072398 (HRGG 0.62 95% CI 0.45,0.86), IRF2rs807684 (HRAA/AG 0.31 95% CI
0.14, 0.67 PLRT 0.0005) and rs3756094 (HRGG/GA 0.37 95% CI 0.20,0.67 PLRT
0.0003),RAF1rs11923427 (HRCC0.58 95% CI 0.40,0.65), andRUNX3rs2135756
(HRAA/AG 0.54 95% CI 0.35,0.82).
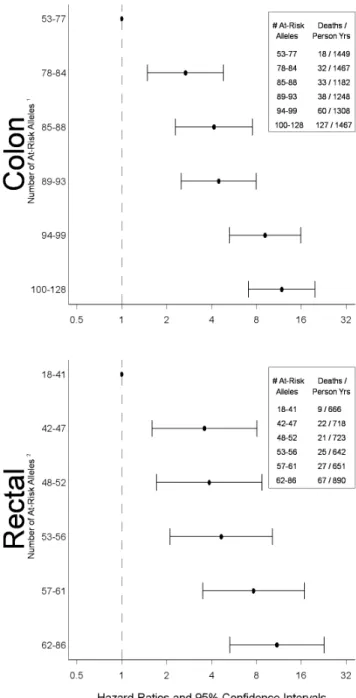
The polygenic risk score (Fig. 1) showed increased risk with increasing number of at risk alleles. The overall HR for colorectal cancer mortality among colon cancer cases in the highest risk group (upper sixth of the at-risk allele distribution) was 11.81 (95% CI 7.07, 19. 74) and was 10.99 (95% CI 5.30,22.78) among rectal cancer cases.
Discussion
Several genes were associated with survival after diagnosis with colorectal cancer, although the overall pathway was not statistically significant and only the JAK/ STAT/SOCs sub-pathway had a PARTP,0.05. Fifteen genes were associated with
colon cancer survival (PARTP,0.05) and seven genes were associated with rectal
cancer survival. It should be noted this represents 9.6% of genes analyzed for colon cancer and approximately 5% of genes analyzed for rectal cancer and could be chance findings; thus these findings need replications. We observed that the hazard of dying after being diagnosed with either colon or rectal cancer increased
Table 2.Overall pathway PARTP1.
Colon Rectal
Sub-Pathway Sub-Pathway Pathway Sub-Pathway Pathway
PARTP PARTP PARTP PARTP
Angiogenesis 0.2426 0.2479 0.8865 0.6248
Hormone/Insulin/Growth 0.4030 0.7416
Interferons 0.0770 0.1720
Interleukins 0.4662 0.0609
Jak/Stat/Socs 0.0353 0.5152
Pathway Core 0.2036 0.7114
MAP Kinase (MAPK) 0.3160 0.3529
Selenoproteins 0.1834 0.3659
Telomere 0.5166 0.9729
TGFb 0.1503 0.4647
Toll-Like Receptors (TLR) 0.1109 0.9874
Tumor Necrosis Factor (TNF) 0.8566 0.1712
1Adjusted for age, study center, race/ethnicity, sex, AJCC stage, and tumor markers: CIMP,KRAS,TP53; MSI for colon only. ARTP p values based on
10,000 permutations.
Table 3.Genes and related SNPs associated with colorectal cancer-specific mortality among patients diagnosed with colon cancer (gene PARTP#0.05; SNP
Ptrend#0.10).
Gene PARTP SNP Genotype HR (95%CI)1 Ptrend
DUSP2 0.0225 rs1724120 AA vs. GG/GA 0.72 (0.54, 0.96) 0.0199 IFNGR1 0.0121 rs3799488 TC/CC vs. TT 1.30 (0.98, 1.72) 0.0772
rs9376267 CT/TT vs. CC 1.37 (1.09, 1.73) 0.0079
rs1327474 GG vs. AA/AG 0.69 (0.50, 0.94) 0.0158
IL6 0.0417 rs1800796 GC/CC vs. GG 0.55 (0.36, 0.84) 0.0032
IRF2 0.0207 rs6856910 CC vs. TT 1.42 (0.99, 2.04) 0.0835
rs793777 GG vs. CC 0.67 (0.46, 0.98) 0.0426
rs2797507 CA/AA vs. CC 0.77 (0.61, 0.98) 0.0380
rs12504466 TC/CC vs. TT 1.51 (1.14, 1.99) 0.0027
rs793814 AA vs. TT/TA 0.57 (0.39, 0.83) 0.0018
rs7655800 AG/GG vs. AA 1.33 (1.04, 1.70) 0.0234
rs9684244 CC vs. GG 0.56 (0.37, 0.84) 0.0124
rs13139310 AA vs. GG 0.35 (0.16, 0.74) 0.0220
rs11723606 TT vs. CC 0.45 (0.24, 0.86) 0.0341
rs13116389 GT/TT vs. GG 1.38 (1.09, 1.75) 0.0073
rs793801 AA vs. GG/GA 1.39 (1.01, 1.91) 0.0506
rs3775582 GA/AA vs. GG 0.67 (0.50, 0.89) 0.0038
rs1044873 CT/TT vs. CC 1.32 (1.04, 1.68) 0.0231
JAK2 0.0086 rs1887429 GT/TT vs. GG 1.34 (1.07, 1.69) 0.0113
rs7043371 TT vs. AA/AT 0.63 (0.47, 0.84) 0.0010
rs10974947 AA vs. GG 1.34 (0.86, 2.10) 0.0319
rs3780379 GA/AA vs. GG 1.32 (1.04, 1.67) 0.0221
rs10815160 GG vs. TT 1.62 (1.07, 2.47) 0.0017
MAP3K10 0.0306 rs1129156 TT vs. CC 1.49 (0.89, 2.52) 0.0073
MMP1 0.0289 rs470215 CC vs. TT 1.45 (0.99, 2.12) 0.0278
NFKBIA 0.0252 rs696 AA vs. GG 1.41 (1.00, 1.99) 0.0696
rs2233409 TT vs. CC 0.62 (0.37, 1.03) 0.0562
rs3138053 GG vs. AA 0.56 (0.35, 0.90) 0.0177
NOS2A 0.0421 rs7406657 CC vs. GG 0.59 (0.32, 1.09) 0.0061
rs9906835 GG vs. AA 0.62 (0.43, 0.89) 0.0105
rs2297516 CC vs. AA 0.59 (0.40, 0.86) 0.0095
PIK3CA 0.0098 rs2699905 GA/AA vs. GG 0.73 (0.58, 0.93) 0.0101
rs7640662 CG/GG vs. CC 0.71 (0.54, 0.94) 0.0154
rs2677760 CC vs. TT/TC 1.43 (1.11, 1.83) 0.0067
rs1607237 CC vs. TT/TC 1.45 (1.10, 1.92) 0.0104
SEPX1 0.0217 rs732510 GG vs. AA/AG 1.47 (1.13, 1.90) 0.0049 SMAD3 0.0059 rs1498506 CC vs. AA 0.69 (0.48, 0.99) 0.0837
rs9972423 AA vs. TT 0.82 (0.56, 1.19) 0.0950
rs2118611 GG vs. AA 1.89 (1.19, 2.99) 0.0188
rs11071933 GG vs. CC 1.60 (1.15, 2.24) 0.0111
rs7163381 AA vs. GG 1.67 (1.09, 2.58) 0.0113
rs4776892 TT vs. AA 1.64 (0.93, 2.91) 0.0292
with increasing number of at-risk alleles. The lack of statistical significance observed for the overall pathway could reflect sub-pathway groupings that did not optimize the data. Further evaluation at the gene and SNP level suggested that many components of the pathway contributed to survival, although a large segment of the pathway did not.
The JAK/STAT-signaling pathway was the only sub-pathway that was
statistically significant using ARTP. This pathway plays a critical role in immune response and regulation of inflammation given its essential affiliation with cytokine signaling. STAT3 specifically has been shown to promote uncontrolled cell growth and survival through dysregulation of gene expression involved in apoptosis, cell-cycle regulation, and angiogenesis. [18] JAK1, JAK2, andSTAT3
have been associated with colorectal cancer progression [19]. In our analysis,
STAT3andSTAT5were of marginal significance with colon cancer survival, while
JAK2 andTYK2 were statistically significant. Within these genes, several SNPs were significantly associated with survival.
Several genes in the backbone of the CHIEF pathway were associated with survival, including PIK3CA for colon cancer andPRKAG2,STK11, and TSC2for rectal cancer. Phosphoinositide 3-kinase (PI3K gene official name PIK3CA) is an early event in cells responding to growth factors, cytokines, and insulin [20]. PI3K induces the activation of Akt1 (alias PDK). The PI3K/Akt pathway is recognized as an important regulator of cell proliferation and survival and is thought to be involved in mediating the effects of MTOR [21]. It has been shown that
inflammation-related factors can activate MTOR can promote tumor angiogenesis by phosphorylating TSC1 (also known as hamartin) and thereby inactivating the TSC1-TSC2 complex [22,23]. TSC2, also known as tuberin, specifically has been
Table 3.Cont.
Gene PARTP SNP Genotype HR (95%CI)1 Ptrend
rs745103 CC vs. TT 1.50 (1.08, 2.08) 0.0186
rs893473 CT/TT vs. CC 1.45 (1.14, 1.83) 0.0024
rs1866317 CG/GG vs. CC 1.47 (1.14, 1.90) 0.0040
rs4601989 TT vs. CC 0.48 (0.24, 0.93) 0.0719
rs11639295 TT vs. CC/CT 0.54 (0.33, 0.89) 0.0083
rs12708492 CT/TT vs. CC 1.52 (1.16, 2.00) 0.0019
TLR2 0.0302 rs5743704 CA/AA vs. CC 1.80 (1.20, 2.68) 0.0077
rs5743708 GA/AA vs. GG 1.77 (1.15, 2.72) 0.0160
TYK2 0.0178 rs12720356 TG/GG vs. TT 1.30 (0.96, 1.76) 0.0933
rs280521 GA/AA vs. GG 0.69 (0.52, 0.92) 0.0078
rs280523 GA/AA vs. GG 0.59 (0.38, 0.91) 0.0105
VDR 0.0499 VDR_Bsm1 BB vs. bb 1.50 (1.06, 2.12) 0.0453
VDR_Fok1 ff vs. FF 1.47 (1.01, 2.15) 0.0709
VDR_Poly SS vs. LL 1.47 (1.03, 2.10) 0.0483
1
Hazard Ratio (HR) and 95% Confidence Intervals (CI) adjusted for age, study center, race/ethnicity, sex, AJCC stage, and tumor molecular phenotype: MSI, CIMP,KRAS, andTP53. PARTPbased on 10,000 permutations.
shown to be involved in insulin signaling, tumor suppressor functions, and regulation of cell growth. A study by Lee and colleagues showed that STK11,
PRKAA1, and TSC1polymorphisms were associated with disease-free survival after diagnosis with colorectal cancer; they did not see an association with TSC2
Table 4.Genes and related SNPs associated with colorectal cancer-specific mortality among patients diagnosed with rectal cancer (gene PARTP#0.05; SNP
Ptrend#0.10).
Gene PARTP SNP Genotype HR (95%CI)1 Ptrend
IL2RA 0.0216 rs2386841 AA vs. CC 3.10 (1.50, 6.41) 0.0298
rs7072398 GA/AA vs. GG 0.62 (0.45, 0.85) 0.0035
rs11256456 CC vs. TT 1.90 (0.97, 3.70) 0.0049
rs11256457 CG/GG vs. CC 0.70 (0.51, 0.96) 0.0282
rs6602398 GT/TT vs. GG 0.76 (0.56, 1.04) 0.0861
rs11256497 AA vs. GG 0.59 (0.34, 1.01) 0.0588
rs791587 AA vs. GG 0.57 (0.36, 0.90) 0.0129
rs10905669 TT vs. CC 1.73 (0.93, 3.21) 0.0054
rs2476491 AA vs. TT 0.56 (0.29, 1.09) 0.0210
rs2256774 AG/GG vs. AA 0.68 (0.50, 0.93) 0.0153
rs706779 GG vs. AA 0.64 (0.41, 1.01) 0.0388
rs706778 GA/AA vs. GG 1.58 (1.10, 2.26) 0.0103
rs3118470 TC/CC vs. TT 1.45 (1.06, 2.00) 0.0201
IL8RA 0.0189 rs1008563 CT/TT vs. CC 0.71 (0.52, 0.98) 0.0368
rs1008562 GG vs. CC 1.60 (1.04, 2.46) 0.0278
rs16858808 CT/TT vs. CC 0.51 (0.23, 1.11) 0.0637
rs16858811 TG/GG vs. TT 0.52 (0.25, 1.08) 0.0571
IL8RB 0.0306 rs4674258 CT/TT vs. CC 0.72 (0.52, 0.99) 0.0436
rs1126579 TT vs. CC 1.60 (1.05, 2.46) 0.0235
IRF2 0.0091 rs809909 TA/AA vs. TT 0.76 (0.56, 1.05) 0.0986
rs10009261 TT vs. CC 1.52 (0.93, 2.49) 0.0730
rs1425551 CC vs. AA/AC 1.51 (1.03, 2.20) 0.0396
rs807684 GG vs. AA/AG 0.31 (0.14, 0.67) 0.0005
rs3756094 AA vs. GG/GA 0.37 (0.20, 0.67) 0.0003
RAF1 0.0158 rs3729931 TT vs. CC 0.65 (0.39, 1.09) 0.0690
rs9809501 TG/GG vs. TT 0.62 (0.40, 0.95) 0.0229
rs11923427 CG/GG vs. CC 0.58 (0.40, 0.85) 0.0039
rs11711419 AT/TT vs. AA 0.71 (0.50, 1.00) 0.0452
rs4684871 GG vs. AA 0.56 (0.33, 0.96) 0.0260
rs904453 AA vs. CC 1.73 (1.12, 2.68) 0.0132
RUNX3 0.0244 rs7517302 CC vs. TT 1.77 (1.15, 2.71) 0.0098
rs2135756 GG vs. AA/AG 0.54 (0.35, 0.82) 0.0022
SEPX1 0.0311 rs13331553 TC/CC vs. TT 1.45 (1.06, 1.98) 0.0202
rs732510 GG vs. AA/AG 1.47 (1.04, 2.07) 0.0335
1Hazard Ratio (HR) and 95% Confidence Intervals (CI) adjusted for age, study center, race/ethnicity, sex, AJCC stage, and tumor molecular phenotype:
CIMP,KRAS, andTP53. PARTPbased on 10,000 permutations.
Fig. 1. Polygenic summary score associated with CHIEF pathway for colorectal cancer survival.1SNPs
[24]. Other studies have shown that STK11 is associated with tumor metastasis and more aggressive tumors [25,26].
Increased tumor vascularization and inflammation have been associated with advanced tumor stage and poor prognosis [27]. Thus, we hypothesized that genes associated with angiogenesis would influence survival. We observed that NOS2A,
MMP1, and VDRwere associated with survival after colon cancer diagnosis and no major angiogenesis genes on our platform were associated with rectal cancer. Inducible nitric oxide synthase (NOS2) is induced by inflammatory cytokines and hypoxia and produces large amounts of nitric oxide. Nitric oxide can affect cancer through many ways, it can increase apoptosis and inhibit carcinogenesis or promote carcinogenesis through increasing angiogenesis [28]. MMPs are involved in normal physiological processes required for development and morphogenesis; a loss of control of MMPs can result in pathological processes including
inflammation, angiogenesis, and cellular proliferation that are central to diseases such as cancer. MMPs, and MMP1 specifically, have been studied using indicators of metastatic potential by evaluating tumor stage at time of diagnosis, tumor grade and histology and been shown to be associated with greater metastatic potential [29]. VDR expression has been associated with better survival for colon and breast cancer [30–32]. Previously, we reported that FLT1 SNPs were
significantly associated with the hazard of dying of colorectal cancer after diagnosis with colon cancer and KDRSNPs were associated significantly with colorectal deaths after diagnosis with rectal cancer [33].
The TGF-b-signaling pathway has been shown to be one of the strongest pathways associated with colon cancer risk in our data. Others have shown that improved disease-free survival after diagnosis with CRC was associated with increased TGF-b expression [34]. Forsti and colleagues looked at nine
polymorphisms in the TGF-b-signaling pathway and CRC among 308 cases of colorectal cancer [35] and observed that TGFbRA IVS7G+24A minor allele was associated with better survival. Several others studies have focused on SMAD2,
SMAD4, andSMAD7 and found associations with prognosis after CRC diagnosis [36,37]. We only observed marginally significant associations with BMP2
(PARTP50.083), BMPR1A(PARTP50.053),BMPR1B (PARTP50.069) for colon
cancer survival. RUNX3 was significantly associated with rectal cancer survival, while BMP1 (PARTP50.099) and BMPR1A (PARTP50.085) were marginally
significant.
TwoMAPKs genes were associated with survival in our data; these genes mediate intracellular signaling and are involved in diverse cellular processes that rs2168730, rs7895217, rs4934275,ESR2_Rsa,IL1Ars3783546,IL2RArs2386841, rs7072398, rs11256456, rs11256457, rs6602398, rs11256497, rs791587, rs10905669, rs2476491, rs2256774, rs706779, rs706778, rs3118470,IL3rs181781,IL8RArs1008563, rs1008562, rs16858811,IL8RBrs1126579,IRF2rs809909, rs10009261, rs1425551, rs807684, rs3756094,PRKAG2rs1541538, rs2536082, rs6947064, rs7805747, rs1860743, rs10278273, rs7801616, rs7784818, rs3934597,RAF1rs3729931, rs9809501, rs11923427, rs4684871, rs904453,RUNX3rs7517302, rs2135756,SEPX1rs13331553, rs732510,SOCS1rs193779, STK11rs8111699, rs741765,TSC2rs2074968.
include cell proliferation and differentiation and apoptosis and implicated in progression [38]. The three major categories of MAPK are the stress-activated protein kinase c-Jun NH-2 terminal kinase (JNKor SAPK1), stress-activated protein kinase 2 (p38 or SAPK2), and the extracellular signal-regulated protein kinases (ERK1/2) [38,39]. JNK, which includes MAP3K10 that was associated with survival in our data, is generally associated with apoptosis induction [40]. DUSPs attenuate the effect of MAPK [41].
SEPX1was associated with survival for both colon and rectal cancer while
SEP15 was marginally associated (PARTP50.068) with colon cancer survival. We
previously reported that three SNPs in this pathway were associated with rectal cancer survival, SEPN1rs718391 (HR 1.67, 95% CI 1.11,2.51) and SEPX1
rs13331553 (HR 1.46 95%CI 1.07,2.00) and SEPX1rs732510 (HR 1.68 95% CI 1.09,2.60) after adjustment for multiple comparisons using FDR. However, taking the gene approach as we did with ARTP, SEPX1remained significant for both colon and rectal cancer.
Several cytokines, including interleukins and interferons, and other mediators of inflammation were associated with both colon (INFGR1, IL6, IRF2,NFkB1A,
TLR2) and rectal cancer survival (IL1Aand IL3), as was suppressor of cytokine signaling (SOCS1). Functions of cytokine-related pathways include apoptosis and cell proliferation. INFG has been shown to regulate the expression of apoptosis-related genes and has been hypothesized to regulate cell sensitivity to apoptosis [42]. TLRs can promote inflammation, cell survival and tumor progression [43]. Studies analyzing associations between risk or survival and SNPs in interleukin genes such as IL1B, IL1RA, IL10have reported conflicting results; some SNPs being associated with increased risk or survival while others associated with a lower risk or survival for colorectal cancer [44–46].
To estimate the magnitude of risk associated with carrying multiple high-risk alleles, we created a polygenic risk score. Our results suggest that the genetic variant load is important for survival after diagnosis since we observed substantial increased risk of dying with increasing numbers of variant genotypes. While one could hypothesize that a single insult to the pathway could influence risk and that additional insults would have minimal effect on risk, our data suggest otherwise. Inflammatory pathways are somewhat redundant, composed of multiple
those being diagnosed at AJCC Stage 4 having over a 12-fold increased risk of dying than those diagnosed at a local disease stage.
The pathway approach we used was novel in that it summarized the statistical significance of the pathway and genes rather than focus on individual SNPs. ARTP allowed us to combine single SNP p values using the rank truncated product statistic and assess significance via permutations at multiple levels, including the gene, sub-pathway, and overall pathway level. While we selected genes that we believed were most important to the pathway, there are many other genes and SNPs involved in this pathway that could be important and contribute to colorectal cancer-specific mortality. We also are limited in our ability to assess interaction between genes and with lifestyle factors that could influence risk, since ARTP at this time does not allow for assessment of interactions. Unfortunately, we do not have a separate population to validate these findings and therefore encourage others with similar data to replicate these findings. Likewise, we did not attempt a test and training set, given the impact of that method on study power; lack of replication thus could be from lack of power. Other limitations to our assessment is lack of treatment and other related medical conditions that could impact survival. While we can argue that it is unlikely that these genes and SNPs are associated with treatment, we do not have the ability to test that. However, treatment is highly correlated with AJCC stage, and we have adjusted for stage in our analysis.
It is noteworthy that our findings for colon and rectal cancer are for the most part different. There are several potential explanations for these findings. First, disease pathways could be different for the two cancer sites, and thus genes and sub-pathways that are important could also differ. Another explanation for these differences, could stem from a smaller sample size for rectal than colon cancer. This could explain the lack of replication in rectal cancer from colon cancer findings, however it would explain differences observed in rectal cancer that are not replicated in colon cancer. While the underlying cause of these differences is not clear, it has been observed that risk factors differ between colon and rectal cancer [11,47–54].
In conclusion, there is support that genes within the CHIEF pathway are associated with colorectal cancer-specific mortality, although the overall pathway did not influence risk. Replication of these findings, along with more detailed assessment of the specific genes may help identify key variants that could importantly contribute to prognosis.
Supporting Information
S1 Table. List of genes, aliases, and chromosomal location.
doi:10.1371/journal.pone.0116169.s001 (DOCX)
S2 Table. Table. List of sub-pathways and genes included in each sub-pathway for ARTP analysis.
S3 Table. Genes and related SNPs associated with colorectal cancer-specific mortality among patients diagnosed with colon cancer (0.05. gene
PARTP#0.10; SNP Ptrend#0.10).
doi:10.1371/journal.pone.0116169.s003 (DOCX)
S4 Table. Genes and related SNPs associated with colorectal cancer-specific mortality among patients diagnosed with rectal cancer (0.05. gene
PARTP#0.10; SNP Ptrend#0.10).
doi:10.1371/journal.pone.0116169.s004 (DOCX)
Acknowledgments
The contents of this manuscript are solely the responsibility of the authors and do not necessarily represent the official view of the National Cancer Institute. We would like to acknowledge the contributions of Dr. Bette Caan, Judy Morse and Donna Schaffer and the Kaiser Permanente Medical Research Program, and Sandra Edwards, Roger Wolff, Erica Wolff, Michael Hoffman and Jennifer Herrick at the University of Utah, and Dr. Kristin Anderson and Dr. John Potter for data management and collection at the University of Minnesota.
Author Contributions
Conceived and designed the experiments: MLS. Performed the experiments: MLS AL. Analyzed the data: AL. Contributed reagents/materials/analysis tools: MLS. Wrote the paper: MLS.
References
1. Slattery ML, Fitzpatrick FA (2009) Convergence of hormones, inflammation, and energy-related factors: a novel pathway of cancer etiology. Cancer Prev Res (Phila Pa) 2: 922–930.
2. Gordon KJ, Blobe GC(2008) Role of transforming growth factor-beta superfamily signaling pathways in human disease. Biochim Biophys Acta 1782: 197–228.
3. Carling D(2004) Ampk. Curr Biol 14: R220.
4. Hardie DG (2003) Minireview: the AMP-activated protein kinase cascade: the key sensor of cellular energy status. Endocrinology 144: 5179–5183.
5. Carling D(2004) The AMP-activated protein kinase cascade–a unifying system for energy control. Trends Biochem Sci 29: 18–24.
6. Viollet B, Andreelli F, Jorgensen SB, Perrin C, Flamez D, et al.(2003) Physiological role of AMP-activated protein kinase (AMPK): insights from knockout mouse models. Biochem Soc Trans 31: 216– 219.
7. Watson CJ, Webb NJ, Bottomley MJ, Brenchley PE(2000) Identification of polymorphisms within the vascular endothelial growth factor (VEGF) gene: correlation with variation in VEGF protein production. Cytokine 12: 1232–1235.
8. Waldner MJ, Wirtz S, Jefremow A, Warntjen M, Neufert C, et al.(2010) VEGF receptor signaling links inflammation and tumorigenesis in colitis-associated cancer. The Journal of experimental medicine 207: 2855–2868.
10. Slattery ML, Wolff RK, Lundgreen A (2014) A Pathway Approach to Evaluating the Association between the CHIEF Pathway and Risk of Colorectal Cancer. Carcinogenesis.
11. Slattery ML, Potter J, Caan B, Edwards S, Coates A, et al.(1997) Energy balance and colon cancer– beyond physical activity. Cancer Res 57: 75–80.
12. Slattery ML, Edwards S, Curtin K, Ma K, Edwards R, et al.(2003) Physical activity and colorectal cancer. Am J Epidemiol 158: 214–224.
13. Samowitz WS, Albertsen H, Herrick J, Levin TR, Sweeney C, et al.(2005) Evaluation of a large, population-based sample supports a CpG island methylator phenotype in colon cancer.
Gastroenterology 129: 837–845.
14. Slattery ML, Curtin K, Anderson K, Ma KN, Ballard L, et al.(2000) Associations between cigarette smoking, lifestyle factors, and microsatellite instability in colon tumors. J Natl Cancer Inst 92: 1831– 1836.
15. Samowitz WS, Curtin K, Ma KN, Schaffer D, Coleman LW, et al.(2001) Microsatellite instability in sporadic colon cancer is associated with an improved prognosis at the population level. Cancer Epidemiol Biomarkers Prev 10: 917–923.
16. Yu K, Li Q, Bergen AW, Pfeiffer RM, Rosenberg PS, et al. (2009) Pathway analysis by adaptive combination of P-values. Genetic epidemiology 33: 700–709.
17. Slattery ML, Curtin K, Wolff RK, Boucher KM, Sweeney C, et al.(2009) A comparison of colon and rectal somatic DNA alterations. Dis Colon Rectum 52: 1304–1311.
18. Hsieh FC, Cheng G, Lin J(2005) Evaluation of potential Stat3-regulated genes in human breast cancer. Biochem Biophys Res Commun 335: 292–299.
19. Xiong H, Zhang ZG, Tian XQ, Sun DF, Liang QC, et al.(2008) Inhibition of JAK1, 2/STAT3 signaling induces apoptosis, cell cycle arrest, and reduces tumor cell invasion in colorectal cancer cells. Neoplasia 10: 287–297.
20. Alessi DR, Downes CP(1998) The role of PI 3-kinase in insulin action. Biochim Biophys Acta 1436: 151–164.
21. Vivanco I, Sawyers CL(2002) The phosphatidylinositol 3-Kinase AKT pathway in human cancer. Nat Rev Cancer 2: 489–501.
22. Lee DF, Hung MC(2007) All roads lead to mTOR: integrating inflammation and tumor angiogenesis. Cell Cycle 6: 3011–3014.
23. Lee DF, Kuo HP, Chen CT, Hsu JM, Chou CK, et al. (2007) IKK beta suppression of TSC1 links inflammation and tumor angiogenesis via the mTOR pathway. Cell 130: 440–455.
24. Lee SJ, Kang BW, Chae YS, Kim HJ, Park SY, et al.(2014) Genetic Variations in STK11, PRKAA1, and TSC1 Associated with Prognosis for Patients with Colorectal Cancer. Ann Surg Oncol.
25. Guervos MA, Marcos CA, Hermsen M, Nuno AS, Suarez C, et al.(2007) Deletions of N33, STK11 and TP53 are involved in the development of lymph node metastasis in larynx and pharynx carcinomas. Cell Oncol 29: 327–334.
26. Nakanishi C, Yamaguchi T, Iijima T, Saji S, Toi M, et al.(2004) Germline mutation of the LKB1/STK11 gene with loss of the normal allele in an aggressive breast cancer of Peutz-Jeghers syndrome. Oncology 67: 476–479.
27. Hicklin DJ, Ellis LM(2005) Role of the vascular endothelial growth factor pathway in tumor growth and angiogenesis. Journal of clinical oncology: official journal of the American Society of Clinical Oncology 23: 1011–1027.
28. Wink DA, Vodovotz Y, Laval J, Laval F, Dewhirst MW, et al.(1998) The multifaceted roles of nitric oxide in cancer. Carcinogenesis 19: 711–721.
29. Przybylowska K, Kluczna A, Zadrozny M, Krawczyk T, Kulig A, et al.(2006) Polymorphisms of the promoter regions of matrix metalloproteinases genes MMP-1 and MMP-9 in breast cancer. Breast Cancer Research and Treatment 95: 65–72.
31. Fedirko V, Riboli E, Tjonneland A, Ferrari P, Olsen A, et al.(2012) Prediagnostic 25-hydroxyvitamin D, VDR and CASR polymorphisms, and survival in patients with colorectal cancer in western European ppulations. Cancer Epidemiol Biomarkers Prev 21: 582–593.
32. Ditsch N, Toth B, Mayr D, Lenhard M, Gallwas J, et al.(2012) The association between vitamin D receptor expression and prolonged overall survival in breast cancer. J Histochem Cytochem 60: 121– 129.
33. Slattery ML, Lundgreen A, Wolff RK(2013) VEGFA, FLT1, KDR and colorectal cancer: Assessment of disease risk, tumor molecular phenotype, and survival. Mol Carcinog.
34. Tsamandas AC, Kardamakis D, Ravazoula P, Zolota V, Salakou S, et al.(2004) The potential role of TGFbeta1, TGFbeta2 and TGFbeta3 protein expression in colorectal carcinomas. Correlation with classic histopathologic factors and patient survival. Strahlenther Onkol 180: 201–208.
35. Forsti A, Li X, Wagner K, Tavelin B, Enquist K, et al.(2010) Polymorphisms in the transforming growth factor beta 1 pathway in relation to colorectal cancer progression. Genes Chromosomes Cancer 49: 270–281.
36. Isaksson-Mettavainio M, Palmqvist R, Forssell J, Stenling R, Oberg A (2006) SMAD4/DPC4 expression and prognosis in human colorectal cancer. Anticancer Res 26: 507–510.
37. Xie W, Rimm DL, Lin Y, Shih WJ, Reiss M(2003) Loss of Smad signaling in human colorectal cancer is associated with advanced disease and poor prognosis. Cancer J 9: 302–312.
38. Park J, Park E, Han SW, Im SA, Kim TY, et al.(2012) Down-regulation of P-cadherin with PF-03732010 inhibits cell migration and tumor growth in gastric cancer. Investigational new drugs 30: 1404–1412.
39. Scharf PJ, Witney J, Daly R, Lyons BA(2004) Solution structure of the human Grb14-SH2 domain and comparison with the structures of the human Grb7-SH2/erbB2 peptide complex and human Grb10-SH2 domain. Protein science: a publication of the Protein Society 13: 2541–2546.
40. Puri MC, Bernstein A(2003) Requirement for the TIE family of receptor tyrosine kinases in adult but not fetal hematopoiesis. Proceedings of the National Academy of Sciences of the United States of America 100: 12753–12758.
41. Jacobs EJ, Rodriguez C, Mondul AM, Connell CJ, Henley SJ, et al.(2005) A large cohort study of aspirin and other nonsteroidal anti-inflammatory drugs and prostate cancer incidence. Journal of the National Cancer Institute 97: 975–980.
42. Tekautz TM, Zhu K, Grenet J, Kaushal D, Kidd VJ, et al.(2006) Evaluation of IFN-gamma effects on apoptosis and gene expression in neuroblastoma–preclinical studies. Biochim Biophys Acta 1763: 1000–1010.
43. Yang H, Zhou H, Feng P, Zhou X, Wen H, et al.(2010) Reduced expression of Toll-like receptor 4 inhibits human breast cancer cells proliferation and inflammatory cytokines secretion. J Exp Clin Cancer Res 29: 92.
44. Gunter MJ, Canzian F, Landi S, Chanock SJ, Sinha R, et al. (2006) Inflammation-related gene polymorphisms and colorectal adenoma. Cancer Epidemiol Biomarkers Prev 15: 1126–1131.
45. Miteva LD, Stanilov NS, Deliysky TS, Stanilova SA(2014) Significance of -1082A/G polymorphism of IL10 gene for progression of colorectal cancer and IL-10 expression. Tumour Biol.
46. Ting WC, Chen LM, Huang LC, Hour MJ, Lan YH, et al. (2013) Impact of interleukin-10 gene polymorphisms on survival in patients with colorectal cancer. J Korean Med Sci 28: 1302–1306.
47. Habermann N, Ulrich CM, Lundgreen A, Makar KW, Poole EM, et al.(2013) PTGS1, PTGS2, ALOX5, ALOX12, ALOX15, and FLAP SNPs: interaction with fatty acids in colon cancer and rectal cancer. Genes & nutrition 8: 115–126.
48. Murtaugh MA, Sweeney C, Ma KN, Potter JD, Caan BJ, et al. (2006) Vitamin d receptor gene polymorphisms, dietary promotion of insulin resistance, and colon and rectal cancer. Nutr Cancer 55: 35–43.
49. Slattery ML, Caan BJ, Benson J, Murtaugh M(2003) Energy balance and rectal cancer: an evaluation of energy intake, energy expenditure, and body mass index. Nutr Cancer 46: 166–171.
51. Slattery ML, Lundgreen A, Welbourn B, Corcoran C, Wolff RK (2012) Genetic variation in selenoprotein genes, lifestyle, and risk of colon and rectal cancer. PLoS One 7: e37312.
52. Slattery ML, Lundgreen A, Welbourn B, Wolff RK, Corcoran C(2012) Oxidative balance and colon and rectal cancer: interaction of lifestyle factors and genes. Mutation Research 734: 30–40.
53. Slattery ML, Murtaugh M, Caan B, Ma KN, Neuhausen S, et al.(2005) Energy balance, insulin-related genes and risk of colon and rectal cancer. Int J Cancer 115: 148–154.