Decreased Insulin-Stimulated ATP Synthesis
and Phosphate Transport in Muscle of
Insulin-Resistant Offspring of Type 2 Diabetic Parents
Kitt F. Petersen1, Sylvie Dufour1,3, Gerald I. Shulman1,2,3*
1Department of Internal Medicine, Yale University School of Medicine, New Haven, Connecticut, United States of America,2Department of Cellular and Molecular Physiology, Yale University School of Medicine, New Haven, Connecticut, United States of America,3Howard Hughes Medical Institute, Yale University School of Medicine, New Haven, Connecticut, United States of America
Competing Interests:The authors have declared that no competing interests exist. GIS is a member of the editorial board ofPLOS Medicine.
Author Contributions:KFP, SD, and GIS designed the study and analyzed the data. KFP enrolled patients. KFP, SD, and GIS contributed to writing the paper.
Academic Editor:Sudesh Kumar, University of Warwick Medical School, United Kingdom
Citation:Petersen KF, Dufour S, Shulman GI (2005) Decreased insulin-stimulated ATP synthesis and phosphate transport in muscle of insulin-resistant offspring of type 2 diabetic parents. PLoS Med 2(9): e233.
Received:January 4, 2005
Accepted:June 3, 2005
Published:August 16, 2005
DOI:
10.1371/journal.pmed.0020233
Copyright:Ó2005 Petersen et al. This is an open-access article distributed under the terms of the Creative Commons Attribution License, which permits unrestricted use, distribution, and reproduction in any medium, provided the original work is properly cited.
Abbreviations:ATP, adenosine triphosphate; BMI, body mass index; IMCL, intramyocellular lipid; IR, insulin-resistant; MRS, magnetic resonance spectroscopy; PCr, phosphocreatinine; Pi, inorganic phosphate
*To whom correspondence should be addressed. E-mail: gerald. shulman@yale.edu
A B S T R A C T
Background
Insulin resistance is the best predictor for the development of type 2 diabetes. Recent studies have shown that young, lean, insulin-resistant (IR) offspring of parents with type 2 diabetes have reduced basal rates of muscle mitochondrial phosphorylation activity associated with increased intramyocellular lipid (IMCL) content, which in turn blocks insulin signaling and insulin action in muscle. In order to further characterize mitochondrial activity in these individuals, we examined insulin-stimulated rates of adenosine triphosphate (ATP) synthesis and phosphate transport in skeletal muscle in a similar cohort of participants.
Methods and Findings
Rates of insulin-stimulated muscle mitochondrial ATP synthase flux and insulin-stimulated
increases in concentrations of intramyocellular inorganic phosphate (Pi) were assessed by31P
magnetic resonance spectroscopy (MRS) in healthy, lean, IR offspring of parents with type 2 diabetes and healthy, lean control participants with normal insulin sensitivity. IMCL content in
the soleus muscle of all participants was assessed by 1H MRS. During a
hyperinsulinemic-euglycemic clamp, rates of insulin-stimulated glucose uptake were decreased by approximately
50% in the IR offspring compared to the control participants (p¼0.007 versus controls) and
were associated with an approximately 2-fold increase in IMCL content (p , 0.006 versus
controls). In the control participants rates of ATP synthesis increased by approximately 90% during the hyperinsulinemic-euglycemic clamp. In contrast, insulin-stimulated rates of muscle
mitochondrial ATP synthesis increased by only 5% in the IR offspring (p¼0.001 versus controls)
and was associated with a severe reduction of insulin-stimulated increases in the
intra-myocellular Pi concentrations (IR offspring: 4.7%61.9% versus controls: 19.3%6 5.7%;p¼
0.03). Insulin-induced increases in intramyocellular Pi concentrations correlated well with
insulin-stimulated increases in rates of ATP synthesis (r¼0.67;p¼0.008).
Conclusions
Introduction
Type 2 diabetes affects about 171 million people world-wide, and the number of people likely to be affected by diabetes is expected to double by 2030 [1,2]. Diabetes develops when resistance to insulin action combines with impaired insulin secretion, resulting in hyperglycemia. Cross-sectional studies have demonstrated the presence of insulin resistance in virtually all patients with type 2 diabetes, and prospective studies have demonstrated the presence of insulin resistance one to two decades prior to the onset of the disease [3,4]. In addition, insulin resistance in the insulin-resistant (IR) offspring of parents with type 2 diabetes has been shown to be the best predictor for the later develop-ment of the disease [5]. Although the mechanism for their insulin resistance is unknown, previous studies have demon-strated a strong relationship between dysregulated intra-cellular fatty acid metabolism and insulin resistance in skeletal muscle [6–8]. Increases in certain intramyocellular lipid (IMCL) metabolites such as acyl CoAs and diacylglycerol have in turn been shown to block insulin signaling by activating a serine kinase cascade [9–12], resulting in reduced insulin-stimulated muscle glucose transport activity [10] and decreased muscle glycogen synthesis [13,14]. Recent com-bined 1H and 31P magnetic resonance spectroscopy (MRS)
studies have demonstrated an approximately 2-fold increase in the IMCL content in a group of healthy, young, lean, IR offspring of parents with type 2 diabetes associated with a 30% reduction in basal rates of muscle mitochondrial adenosine triphosphate (ATP) production. These data suggest that defects in mitochondrial activity, due to reduction in mitochondrial content and/or function, may be an important contributing factor to their increased IMCL content and insulin resistance [15]. Consistent with these functional MRS data two recent gene microarray studies have found a coordinated reduction in peroxisome proliferator-activated receptorccoactivator 1 responsive genes that are involved in mitochondrial oxidative phosphorylation activity in muscle biopsy samples obtained from obese participants with type 2 diabetes [16,17] and their overweight first-degree relatives [17].
In order to further characterize mitochondrial function in these individuals we measured insulin-stimulated rates of muscle mitochondrial ATP synthesis and changes in intra-myocellular inorganic phosphate (Pi) concentrations using 31P MRS in a similar group of young, lean, IR offspring of
parents with type 2 diabetes and body mass index (BMI)–age– activity-matched control participants. These individuals are ideal for examining the earliest defects responsible for the pathogenesis of insulin resistance since, in contrast to patients with diabetes, they are young, lean, healthy, and they have none of the other confounding factors that are likely to be present in patients with type 2 diabetes.
Methods
Participants
All volunteers were prescreened to be healthy, taking no medications, lean, nonsmoking, of normal birth weight (.2.25 kg), and sedentary, as defined by an activity index questionnaire [18]. IR offspring (four male and three female) had at least one parent or grandparent with type 2 diabetes
and at least one other family member with type 2 diabetes. All qualifying participants underwent a complete medical history and physical examination along with blood tests to verify normal: blood and platelet count, electrolytes, aspartate amino transferase, alanine amino transferase, blood urea nitrogen, creatinine, cholesterol, and triglyceride. IR off-spring were defined by an insulin (240 pmol/m2/min)–
stimulated glucose infusion rate ,4.85 mg/kg/min, whereas the control participants were defined by a rate of insulin-stimulated glucose uptake.6 mg/kg/min.
Written consent was obtained from each participant after the purpose, nature, and potential complications of the studies were explained. The protocol was approved by the Yale University Human Investigation Committee.
Diet and Study Preparation
Participants were instructed to abstain from any exercise and to eat a regular, weight maintenance diet containing at least 150 g of carbohydrate per day for the 3 d prior to the studies. To minimize changes in ovarian hormonal effects on glucose metabolism, the female participants were studied during the follicular phase (days 0–12) of the menstrual cycle [19].
Hyperinsulinemic-Euglycemic Clamp
Participants were admitted to the Yale University–New Haven Hospital General Clinical Research Center the evening before the studies and remained fasting from 10 p.m. until the end of the study the next day. At 6 a.m. antecubital IV catheters were inserted, and at 7 a.m. the participants were placed inside the 2.1T magnetic resonance spectrometer (Biospec Spectrometer, Bruker Instruments, Billerica, Massa-chusetts, United States) with the right calf positioned over the
31P receiver coil. After baseline 31P MRS measurements of
ATP synthesis flux and muscle intramyocellular Pi
concen-trations (described below), a primed-continuous insulin infusion was begun (240 pmol/m2/min) to raise plasma insulin concentrations to approximately 480 pmol/l and to maintain them at this level throughout the remaining 150 min of the clamp. Blood was collected every 5 min for determination of plasma glucose concentrations, and a variable intravenous infusion of dextrose (200 g/l) was administered to raise plasma glucose concentrations to 100 mg/dl and maintained at this concentration until the end of the clamp.
Metabolites and Hormones
Plasma glucose concentrations were measured using a Glucose Analyzer II (Beckman Instruments, Fullerton, Cal-ifornia, United States). Plasma concentrations of insulin were measured using double-antibody radioimmunoassay kits (Linco, St. Louis, Missouri, United States). Plasma fatty acid concentrations were determined using a microfluorimetric method [20]. Urine nitrogen content was measured at the Mayo Medical Laboratories (Rochester, Minnesota, United States).
31P MRS
measured at baseline and during the insulin clamp, using the saturation transfer method applied to the exchange between intracellular phosphate and ATP [21]. The steady-state intramyocellular Pi magnetization was measured in the
presence of a selective irradiation of the c resonance of ATP and compared to the equilibrium intracellular phos-phate magnetization in a control spectrum (without irradi-ation ofcATP) [21]. Total acquisition time for 31P spectra
was about 120 min (fromt¼30 to 150 min of the clamp).
1H MRS of IMCL Content
On a separate day, after a 12-h fast, all participants were transported by wheelchair to the Yale Magnetic Resonance Center and localized1H MRS of the soleus muscle to assess
IMCL content were acquired on a 2.1T Biospec as previously described [22].
Indirect Calorimetry
Rates of whole-body energy expenditure and glucose and fat oxidation were assessed by indirect calorimetry (Deltra-track Metabolic Monitor, Sensormedics, Anaheim, California, United States) during the last 20 min of the baseline period and during the last 20 min of the clamp [23].
Calculations
Hyperinsulinemic-euglycemic clamp.The rates of glucose infusion were calculated in 15-min blocks from 60–150 min during the insulin clamp. The data were corrected for urinary glucose loss and glucose space and were expressed as milligrams glucose metabolized per kilogram body weight per minute.
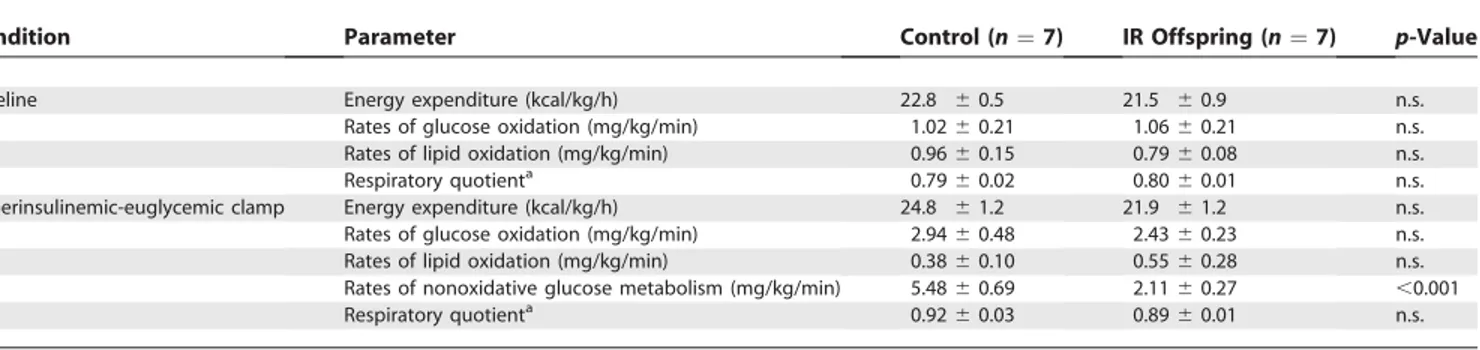
Indirect calorimetry.Basal and insulin-stimulated glucose and lipid oxidation rates were measured by the ventilated hood technique, using a Deltatrack Metabolic Monitor (as previously described [24]). The nonprotein respiratory quotients for 100% oxidation of fat and for oxidation of carbohydrates were 0.707 and 1.00, respectively [24]. Non-oxidative glucose metabolism was calculated by subtracting the amount of glucose oxidized from the total amount of glucose infused.
Statistical analyses. Statistical analyses were performed using the unpaired t-test to detect statistical differences between control and IR offspring, and the paired student t-tests were performed to test for interparticipant differences. Ap-value (two-sided) of,0.05 was considered significant. All data are expressed as mean6SEM.
Results
Participant Characteristics
The control participants and IR offspring were group matched for age, weight, height, BMI, and activity (Table 1). All participants were lean, nonsmoking, and had a sedentary lifestyle without regular participation in sports activities.
Hyperinsulinemic-Euglycemic Clamp
Rates of insulin-stimulated glucose metabolism were approximately 50% lower in the IR offspring compared to the control participants (control: 8.5660.88 mg/[kg/min] and IR offspring: 4.5460.11 mg/[kg/min];p,0.001) (Figure 1A). This reduction in insulin-stimulated rate of whole-body glucose metabolism was associated with an approximately 90% increase in the IMCL content in the IR offspring (1.68%
60.21% versus controls: 0.8660.09%,p¼0.006) and could
mostly be attributed to an approximately 60% reduction (p,
0.001) in nonoxidative glucose disposal (Table 2).
31P MRS
During insulin stimulation, rates of mitochondrial phos-phorylation activity increased by approximately 90% in the control participants (Figure 1B). In contrast, insulin-stimu-lated ATP synthase flux was severely blunted in the IR offspring (DATP flux: 5% 6 2%; p¼ 0.001) (Figure 1B).
During insulin stimulation concentrations of intramyocellu-lar Piincreased by 19.3%65.7% in the control participants,
whereas insulin-stimulated increases in intramyocellular Pi concentrations were also severely blunted in the IR offspring (DPi: 4.7% 6 1.9%; p¼ 0.03 versus controls) (Figure 1C).
There was a strong correlation between insulin-induced increases in intramyocellular Pi concentrations, and the
insulin-stimulated increases in rates of ATP synthesis (r ¼
0.67;p¼0.008). In order to determine whether or not these
changes in intramyocellular Pi might be attributable to
insulin-induced alterations in phosphocreatinine (PCr) me-tabolism, we also assessed the PCr/ATP ratio before and during the clamp in both groups of participants. We found no changes in the PCr/ATP ratio during the hyperinsulinemic-euglycemic clamp compared to the basal period in either the control participants (basal: 4.3660.06 versus clamp: 4.306
0.31) or IR offspring (basal: 3.8260.17 versus clamp: 3.916
0.33).
Discussion
Recent studies have demonstrated an approximately 30% reduction in basal rates of mitochondrial ATP synthesis in healthy, young, lean, IR offspring of parents with type 2 diabetes, which were associated with an approximately 2-fold increase in IMCL content [15]. We postulated that reductions in mitochondrial activity might predispose these individuals to increased IMCL accumulation, which in turn would lead to defects in insulin signaling and insulin action in skeletal muscle. In order to further characterize the regulation of mitochondrial activity in these individuals, we assessed insulin-stimulated rates of ATP synthesis in a similar group of young, lean, IR offspring as well as in a group of age–BMI– activity-matched control group participants using 31P MRS. We found that insulin was a potent stimulator of muscle ATP synthesis in that it increased this flux by 90% over basal rates
Table 1.Characteristics of the Two Groups of Participants
Characteristic Control (n¼7) IR Offspring (n¼7) p-Value
Age (y) 29 62 28 62 n.s.
Weight (kg) 66 64 68 65 n.s.
Height (m) 1.7660.04 1.7560.03 n.s. BMI (kg/m2) 21.3
60.8 22.2 60.9 n.s. Activity index 2.7 60.2 2.4 60.1 n.s. IMCL (%) 0.8660.09 1.6860.21 0.006
M-value (mg/kg/min) 8.5660.88 4.5460.11 ,0.001 Insulin sensitivity index 7.3 60.6 5.0 60.8 0.05
in the control participants. In contrast, insulin-stimulated rates of ATP synthase flux were severely blunted in the IR offspring where a similar increase in plasma insulin concen-trations increased this flux by only 5% over basal rates. These data demonstrate that the defects in basal rates of
mitochon-drial phosphorylation activity, previously found in the IR offspring, are even more pronounced under insulin-stimu-lated conditions and are consistent with a recent in vitro study that found reduced insulin-stimulated rates of oxidative phosphorylation activity in isolated mitochondria obtained from muscle biopsy samples of participants with type 2 diabetes [25]. Taken together these data suggest that the observed defect in insulin-stimulated rates of ATP synthesis is a very early defect in the pathogenesis of insulin resistance and type 2 diabetes.
Insulin also stimulates intramyocellular Pi transport into
skeletal muscle, which accounts for much of its hypophos-phatemic effects in vivo. Previous in vitro studies by Polgreen et al. [26] have demonstrated that insulin stimulates Na-dependent intramyocellular Piinflux in a mouse myoblast cell
line in a relatively rapid manner that is independent of protein synthesis. These authors speculated that insulin regulates intramyocellular Pi transport into skeletal muscle
by recruitment of intramyocellular Pitransporters to the cell
surface in a fashion similar to insulin regulation of glucose transport activity in skeletal muscle. Using31P MRS to assess intramyocellular Pi content before and during the
hyper-insulinemic-euglycemic clamp, we found a marked reduction of insulin-stimulated intramyocellular Pi transport into
skeletal muscle of the IR offspring. The parallel reductions in insulin-stimulated rates of muscle glucose metabolism, which can mostly be attributed to reduced insulin-stimulated glucose transport activity [27], and reduced insulin-stimu-lated phosphate transport activity suggests that a common insulin-signaling defect may be responsible for both of these abnormalities [28]. We also observed a strong correlation between insulin-stimulated increases in intramyocellular phosphate concentrations and insulin-stimulated increases in rates of ATP synthesis in control participants and IR offspring. Inorganic phosphate is the substrate for the phosphorylation of adenosine diphosphate to ATP during oxidative phosphorylation, and it is also a putative cytosolic signaling molecule in the regulation of this process [29,30]. Recent in vitro studies in isolated heart mitochondria have demonstrated that inorganic phosphate regulates oxidative phosphorylation by influencing both the proton motive force and the rate of ATP production [31]. Taken together these data suggest that insulin regulation of phosphate transport may be an important mechanism by which insulin regulates ATP synthesis in human skeletal muscle. If this is true, then it is possible that the observed reductions in insulin-stimulated rates of muscle ATP synthesis, which were observed in the IR offspring, may be secondary to the increased IMCL content that results in impaired insulin signaling and decreased insulin-stimulated phosphate transport [9–12]. While it is also possible that reduced insulin-stimulated muscle capillary recruitment [32–34] might be responsible for the observed reductions in insulin stimulation of ATP synthesis and intramyocellular Pi transport in the IR offspring, recent
studies in humans [27,35–37] have shown that the majority of insulin resistance can be accounted for by a decrement in insulin’s stimulatory effects on cellular glucose uptake and that stimulation of blood flow and capillary recruitment plays only a minor role in mediating insulin effects on glucose metabolism in human skeletal muscle. Therefore it appears unlikely that reductions in insulin-stimulated muscle capil-lary recruitment have a major role in explaining the observed Figure 1.Effect of Insulin Stimulation
(A) Rates of whole-body glucose metabolism, (B) rates of muscle mitochondrial ATP synthesis, and (C) intramyocellular Piconcentrations.
reductions in insulin-stimulated ATP synthesis and intra-myocellular Pitransport in the IR offspring.
In summary, these data provide further evidence of mitochondrial dysfunction in skeletal muscle of IR offspring of parents with type 2 diabetes. These individuals also manifest severe defects in insulin-stimulated phosphate transport in skeletal muscle, which may contribute to their observed defects in insulin-stimulated rates of mitochondrial ATP synthesis. Given the potentially important role that intracellular phosphate might have on regulating mitochon-drial ATP production, we propose that regulation of intra-myocellular Pitransport into the muscle cell by insulin may
be an important mechanism by which insulin regulates mitochondrial ATP synthesis in skeletal muscle.
Acknowledgments
The authors would like to thank Yanna Kosover, Mikhail Smolgovsky, Amy Dennean, Pritpal Rhandawa, M.D., and the staff of the Yale University–New Haven Hospital General Clinical Research Center for expert technical assistance with the studies and the volunteers for participating in this study. These studies were supported by grants from the United States Public Health Service: R01 AG-23686 (KFP), P01 DK-068229 (GIS), P30 DK-45735 (GIS), and M01 RR-00125 (Yale University–New Haven General Clinical Research Center). GIS is the recipient of a Distinguished Clinical Scientist Award from the American Diabetes Association and an investigator of the Howard Hughes Medical Institute. The funding agencies had no role in study design, data collection and analysis, decision to publish, or preparation of the manuscript.
References
1. Zimmet P, Alberti KG, Shaw J (2001) Global and societal implications of the diabetes epidemic. Nature 414: 782–787.
2. Wild S, Roglic G, Green A, Sicree R, King H (2004) Global prevalence of diabetes: Estimates for the year 2000 and projections for 2030. Diabetes Care 27: 1047–1053.
3. Lillioja S, Mott DM, Howard BV, Bennett PH, Yki-Jarvinen H, et al. (1988) Impaired glucose tolerance as a disorder of insulin action. Longitudinal and cross-sectional studies in Pima Indians. N Engl J Med 318: 1217–1225. 4. Lillioja S, Mott DM, Spraul M, Ferraro R, Foley JE, et al. (1993) Insulin resistance and insulin secretory dysfunction as precursors of non-insulin-dependent diabetes mellitus. Prospective studies of Pima Indians. N Engl J Med 329: 1988–1992.
5. Warram JH, Martin BC, Krolewski AS, Soeldner JS, Kahn CR (1990) Slow glucose removal rate and hyperinsulinemia precede the development of type II diabetes in the offspring of diabetic parents. Ann Intern Med 113: 909–915.
6. Perseghin G, Ghosh S, Gerow K, Shulman GI (1997) Metabolic defects in lean nondiabetic offspring of NIDDM parents: A cross-sectional study. Diabetes 46: 1001–1009.
7. Perseghin G, Scifo P, De Cobelli F, Pagliato E, Battezzati A, et al. (1999) Intramyocellular triglyceride content is a determinant of in vivo insulin resistance in humans: A 1H-13C nuclear magnetic resonance spectroscopy assessment in offspring of type 2 diabetic parents. Diabetes 48: 1600–1606. 8. Pan DA, Lillioja S, Kriketos AD, Milner MR, Baur LA, et al. (1997) Skeletal muscle triglyceride levels are inversely related to insulin action. Diabetes 46: 983–988.
9. Griffin ME, Marcucci MJ, Cline GW, Bell K, Barucci N, et al. (1999) Free fatty acid-induced insulin resistance is associated with activation of protein kinase C theta and alterations in the insulin signaling cascade. Diabetes 48: 1270–1274.
10. Dresner A, Laurent D, Marcucci M, Griffin ME, Dufour S, et al. (1999) Effects of free fatty acids on glucose transport and IRS-1-associated phosphatidylinositol 3-kinase activity. J Clin Invest 103: 253–259. 11. Yu C, Chen Y, Cline GW, Zhang D, Zong H, et al. (2002) Mechanism by
which fatty acids inhibit insulin activation of IRS-1 associated phosphati-dylinositol 3-kinase activity in muscle. J Biol Chem 277: 50230–50236. 12. Itani SI, Ruderman NB, Schmieder F, Boden G (2002) Lipid-induced insulin
resistance in human muscle is associated with changes in diacylglycerol, protein kinase C, and IkappaB-alpha. Diabetes 51: 2005–2011.
13. Boden G, Chen X, Ruiz J, White JV, Rossetti L (1994) Mechanisms of fatty acid-induced inhibition of glucose uptake. J Clin Invest 93: 2438–2446. 14. Roden M, Price TB, Perseghin G, Petersen KF, Rothman DL, et al. (1996)
Mechanism of free fatty acid-induced insulin resistance in humans. J Clin Invest 97: 2859–2865.
15. Petersen KF, Dufour S, Befroy D, Garcia R, Shulman GI (2004) Impaired mitochondrial activity in the insulin-resistant offspring of patients with type 2 diabetes. N Engl J Med 350: 664–671.
16. Mootha VK, Lindgren CM, Eriksson KF, Subramanian A, Sihag S, et al. (2003) PGC-1alpha-responsive genes involved in oxidative phosphorylation are coordinately downregulated in human diabetes. Nat Genet 34: 267–273. 17. Patti ME, Butte AJ, Crunkhorn S, Cusi K, Berria R, et al. (2003) Coordinated reduction of genes of oxidative metabolism in humans with insulin resistance and diabetes: Potential role of PGC1 and NRF1. Proc Natl Acad Sci U S A 100: 8466–8471.
18. Baecke JA, Burema J, Frijters JE (1982) A short questionnaire for the measurement of habitual physical activity in epidemiological studies. Am J Clin Nutr 36: 936–942.
19. Diamond MP, Jacob R, Connolly-Diamond M, DeFronzo RA (1993) Glucose metabolism during the menstrual cycle. Assessment with the euglycemic, hyperinsulinemic clamp. J Reprod Med 38: 417–421.
20. Miles J, Glasscock R, Aikens J, Gerich J, Haymond M (1983) A micro-fluorometric method for the determination of free fatty acids in plasma. J Lipid Res 24: 96–99.
21. Lebon V, Dufour S, Petersen KF, Ren J, Jucker BM, et al. (2001) Effect of triiodothyronine on mitochondrial energy coupling in human skeletal muscle. J Clin Invest 108: 733–737.
22. Mayerson AB, Hundal RS, Dufour S, Lebon V, Befroy D, et al. (2002) The effects of rosiglitazone on insulin sensitivity, lipolysis, and hepatic and skeletal muscle triglyceride content in patients with type 2 diabetes. Diabetes 51: 797–802.
23. Petersen KF, Hendler R, Price T, Perseghin G, Rothman DL, et al. (1998) 13C/31P NMR studies on the mechanism of insulin resistance in obesity. Diabetes 47: 381–386.
24. Lusk G (1924) Animal calorimetry: Analysis of the oxidation of mixtures of carbohydrates and fat: A correction. J Biol Chem 59: 41–42.
25. Stump CS, Short KR, Bigelow ML, Schimke JM, Nair KS (2003) Effect of Table 2.Rates of Energy Expenditure, Glucose and Lipid Oxidation, and Respiratory Quotient Values in the Basal State and during the Hyperinsulinemic-Euglycemic Clamp in Control Individuals and IR Offspring
Condition Parameter Control (n¼7) IR Offspring (n¼7) p-Value
Baseline Energy expenditure (kcal/kg/h) 22.8 60.5 21.5 60.9 n.s.
Rates of glucose oxidation (mg/kg/min) 1.0260.21 1.0660.21 n.s. Rates of lipid oxidation (mg/kg/min) 0.9660.15 0.7960.08 n.s.
Respiratory quotienta 0.79
60.02 0.8060.01 n.s. Hyperinsulinemic-euglycemic clamp Energy expenditure (kcal/kg/h) 24.8 61.2 21.9 61.2 n.s. Rates of glucose oxidation (mg/kg/min) 2.9460.48 2.4360.23 n.s. Rates of lipid oxidation (mg/kg/min) 0.3860.10 0.5560.28 n.s. Rates of nonoxidative glucose metabolism (mg/kg/min) 5.4860.69 2.1160.27 ,0.001
Respiratory quotienta 0.92
60.03 0.8960.01 n.s.
aRatio of rates of carbon dioxide production to rates of oxygen uptake.
n.s., not significant.
insulin on human skeletal muscle mitochondrial ATP production, protein synthesis, and mRNA transcripts. Proc Natl Acad Sci U S A 100: 7996–8001. 26. Polgreen KE, Kemp GJ, Leighton B, Radda GK (1994) Modulation of Pi transport in skeletal muscle by insulin and IGF-1. Biochim Biophys Acta 1223: 279–284.
27. Cline GW, Petersen KF, Krssak M, Shen J, Hundal RS, et al. (1999) Impaired glucose transport as a cause of decreased insulin-stimulated muscle glycogen synthesis in type 2 diabetes. N Engl J Med 341: 240–246. 28. Shulman GI (2000) Cellular mechanisms of insulin resistance. J Clin Invest
106: 171–176.
29. Chance B, Williams GR (1956) The respiratory chain and oxidative phosphorylation. Adv Enzymol Relat Subj Biochem 17: 65–134.
30. Lardy HA, Wellman H (1952) Oxidative phosphorylations: Role of inorganic phosphate and acceptor systems in control of metabolic rates. J Biol Chem 195: 215–224.
31. Bose S, French S, Evans FJ, Joubert F, Balaban RS (2003) Metabolic network control of oxidative phosphorylation: Multiple roles of inorganic phos-phate. J Biol Chem 278: 39155–39165.
32. Coggins M, Lindner J, Rattigan S, Jahn L, Fasy E, et al. (2001) Physiologic hyperinsulinemia enhances human skeletal muscle perfusion by capillary recruitment. Diabetes 50: 2682–2690.
33. Gudbjornsdottir S, Sjostrand M, Strindberg L, Lonnroth P (2005) Decreased muscle capillary permeability surface area in type 2 diabetic subjects. J Clin Endocrinol Metab 90: 1078–1082.
34. Sjostrand M, Gudbjornsdottir S, Strindberg L, Lonnroth P (2005) Delayed transcapillary delivery of insulin to muscle interstitial fluid after oral glucose load in obese subjects. Diabetes 54: 152–157.
35. Parsonage W, Hetmanski D, Cowley A (2002) Differentiation of the metabolic and vascular effects of insulin in insulin resistance in patients with chronic heart failure. Am J Cardiol 89: 696–703.
36. Laine H, Yki-Jarvinen H, Kirvela O, Tolvanen T, Raitakari M, et al. (1998) Insulin resistance of glucose uptake in skeletal muscle cannot be ameliorated by enhancing endothelium-dependent blood flow in obesity. J Clin Invest 101: 1156–1162.
37. Utriainen T, Nuutila P, Takala T, Vicini P, Ruotsalainen U, et al. (1997) Intact insulin stimulation of skeletal muscle blood flow, its heterogeneity and redistribution, but not of glucose uptake in non-insulin-dependent diabetes mellitus. J Clin Invest 100: 777–785.
Patient Summary
Background Type 2 diabetes is one of the fastest growing chronic diseases. We know quite a bit about the risk factors that predispose people to diabetes (such as being overweight), but we do not understand well how the disease starts (usually in adults but increasingly in teenagers and even children).
Why Was This Study Done?Children whose parents are diabetic have a higher risk of developing type 2 diabetes themselves. Some of them have the first signs of the disease (a condition called insulin resistance, which is a strong predictor for subsequent development of diabetes) while they are still young and lean. The group of Gerald Shulman (who is the senior author of this study) has studied such individuals to understand the causes and effects of their insulin resistance. Having previously found some abnormalities in the mitochondria (the parts of cells involved in generating energy), they studied mitochondrial function in more detail here.
What Did the Researchers Do and Find?They compared seven young lean insulin-resistant adults with a family history of diabetes with seven lean young adults without diabetic family members and with normal insulin sensitivity. Specifically, they looked at energy generated in the muscles in response to insulin stimulation. They found that while insulin increases energy production in the muscles of the control individuals by approximately 90%, it had very little effect in the insulin-resistant individuals. They also studied the amount of inorganic phosphate (an essential trace element) in muscle cells of both groups, and how it was affected by insulin. They found that in control individuals, insulin results in an increase of phosphate transport into the muscle cells and that this is also much reduced in insulin-resistant individuals.
What Does This Mean?Intracellular phosphate is a key regulator of energy generation, and this study provides more support for the notion that insulin resistance compromises proper functioning of energy generation in the mitochondria of muscle cells. This and similar studies should eventually result in a better understanding of the early events in diabetes. The hope is that this will then allow the development of therapies that might prevent the disease or treat its symptoms more effectively.
Where Can I Find More Information Online?The following Web sites contain information on diabetes and insulin resistance.
US National Diabetes Clearinghouse (English and Spanish): http://diabetes.niddk.nih.gov/dm/pubs/insulinresistance/ http://diabetes.niddk.nih.gov/spanish/indexsp.asp
Stanford University Web site on syndrome X, diabetes, and insulin resistance:
http://syndromex.stanford.edu/ Diabetes UK:
http://www.diabetes.org.uk/
American Diabetes Association (English and Spanish): http://www.diabetes.org/
http://www.diabetes.org/espanol/default.jsp Information on Dr. Shulman’s research: