Bariatric Surgery in Morbidly Obese Insulin
Resistant Humans Normalises Insulin
Signalling but Not Insulin-Stimulated Glucose
Disposal
Mimi Z. Chen1☯, Claire A. Hudson1☯, Emma E. Vincent2☯, David A. R. de Berker3, Margaret
T. May4, Ingeborg Hers5, Colin M. Dayan6, Robert C. Andrews1*, Jeremy M. Tavaré2
1School of Clinical Sciences, University of Bristol, Bristol, United Kingdom,2School of Biochemistry, University of Bristol, Bristol, United Kingdom,3Bristol Dermatology Centre, Bristol Royal Infirmary, Bristol, United Kingdom,4School of Social and Community Medicine, University of Bristol, Bristol, United Kingdom, 5School of Physiology and Pharmacology, University of Bristol, Bristol, United Kingdom,6Institute of Molecular and Experimental Medicine, Cardiff University School of Medicine, Cardiff, United Kingdom
☯These authors contributed equally to this work. *[email protected]
Abstract
Aims
Weight-loss after bariatric surgery improves insulin sensitivity, but the underlying molecular mechanism is not clear. To ascertain the effect of bariatric surgery on insulin signalling, we examined glucose disposal and Akt activation in morbidly obese volunteers before and after Roux-en-Y gastric bypass surgery (RYGB), and compared this to lean volunteers.
Materials and Methods
The hyperinsulinaemic euglycaemic clamp, at five infusion rates, was used to determine glucose disposal rates (GDR) in eight morbidly obese (body mass index, BMI=47.3±2.2 kg/m2) patients, before and after RYGB, and in eight lean volunteers (BMI=20.7±0.7 kg/m2). Biopsies of brachioradialis muscle, taken at fasting and insulin concentrations that induced half-maximal (GDR50) and maximal (GDR100) GDR in each subject, were used to examine the phosphorylation of Akt-Thr308, Akt-473, and pras40,in vivobiomarkers for Akt activity.
Results
Pre-operatively, insulin-stimulated GDR was lower in the obese compared to the lean indi-viduals (P<0.001). Weight-loss of 29.9±4 kg after surgery significantly improved GDR50 (P=0.004) but not GDR100(P=0.3). These subjects still remained significantly more insulin resistant than the lean individuals (p<0.001). Weight loss increased insulin-stimulated skel-etal muscle Akt-Thr308 and Akt-Ser473 phosphorylation, P=0.02 and P=0.03 respectively (MANCOVA), and Akt activity towards the substrate PRAS40 (P=0.003, MANCOVA), and
OPEN ACCESS
Citation:Chen MZ, Hudson CA, Vincent EE, de Berker DAR, May MT, Hers I, et al. (2015) Bariatric Surgery in Morbidly Obese Insulin Resistant Humans Normalises Insulin Signalling but Not Insulin-Stimulated Glucose Disposal. PLoS ONE 10(4): e0120084. doi:10.1371/journal.pone.0120084
Academic Editor:Andrew Wolfe, John Hopkins University School of Medicine, UNITED STATES
Received:August 4, 2014
Accepted:January 19, 2015
Published:April 13, 2015
Copyright:© 2015 Chen et al. This is an open access article distributed under the terms of the Creative Commons Attribution License, which permits unrestricted use, distribution, and reproduction in any medium, provided the original author and source are credited.
Data Availability Statement:All relevant data are available from Figshare, under the DOIhttp://dx.doi. org/10.6084/m9.figshare.1292883.
Funding:This study was funded by a grant from Diabetes Research and Wellness Foundation, Medical Research Council and AstraZeneca. These funders had no role in study design, data collection and analysis, decision to publish, or preparation of the manuscript.
in contrast to GDR, were fully normalised after the surgery (obese vs lean, P=0.6, P=0.35, P=0.46, respectively).
Conclusions
Our data show that although Akt activity substantially improved after surgery, it did not lead to a full restoration of insulin-stimulated glucose disposal. This suggests that a major defect downstream of, or parallel to, Akt signalling remains after significant weight-loss.
Introduction
Weight gain is a major risk factor for the development of Type 2 Diabetes (T2DM) and the relative risk increases dramatically with even a small increase in weight [1]. Weight gain is thought to have its effect by reducing the effectiveness of insulin action. Insulin-stimulated glu-cose uptake in skeletal muscle and adipocytes tissues is impaired in obesity and T2DM, causing peripheral insulin resistance (IR). Furthermore, insulin resistant obese individuals have re-duced insulin sensitivity and maximal insulin-stimulated glucose uptake when compared to lean individuals [2,3].
The molecular basis of IR is poorly understood. Insulin increases glucose uptake into muscle and adipose tissue by promoting the translocation of GLUT4 (glucose transporter isoform 4) from the cell interior to the plasma membrane [4,5]. The fact that GLUT4 expression is not re-duced in those with insulin resistance, such as in the obese and T2DM [6,7], suggests that the major underlying defects in this condition are likely to lie in the insulin signal transduction pathways and/or the translocation of GLUT4 to the plasma membrane in skeletal muscle. Re-duction in insulin stimulated phosphorylation of the insulin receptor and IRS-1, and reduced activity of PI3-kinase in T2DM suggest that defective insulin signalling may be, at least in part, responsible for insulin resistance [8].
Adipose tissue secretes a number of endocrine and inflammatory mediators, including free fatty acid (FFA) and adipokines (e.g. tumour necrosis factorα, Adiponectin, Leptin and Resis-tin) that influence insulin sensitivity and glucose homeostasis. Elevated FFA secretion associat-ed with fat mass expansion is widely believassociat-ed to play an important part in insulin resistance with it affecting the phosphorylation of IRS-1 and pathways that link into this [9,10].
Akt is an insulin-stimulated serine/threonine-specific protein kinase that is well established as a critical component of the signalling mechanism used by insulin to stimulate glucose uptake [11–14]. A reduced ability of insulin to stimulate Akt in skeletal muscle has been observed in several studies of human IR [15–18], although others have disputed this [19–23]. This discrep-ancy could be due to the different experimental approaches used in these studies, including the use of different insulin infusion rates during hyperinsulinaemic euglycaemic clamps (HEC) or differences in the degree of obesity or glycaemic status of the subjects.
Studies that employ a single insulin concentration for both the control and affected group (i.e. obese, T2DM), either at the lower physiological or supra-physiological ends [15], provide limited insight into dynamic molecular activity. A given insulin concentration may fall outside the effective insulin range for one group and thus fail to provoke an observable physiological response, or only provoke a partial response, and thus lead to misleading results. Construction of a detailed insulin dose response curve specific to an individual is important in allowing dy-namic assessment of the insulin signalling pathway and allows for better comparison between individuals [2].
Novo Nordisk, Sanofi-Aventis, and Lilly, as well as travel expenses from Sanofi-Aventis to attend the European Association for the Study of Diabetes annual meeting in 2011. MZC received speaker honoraria for education events from Novo Nordisk, Bristol-Myers Squibb and AstraZeneca, as well as travel expenses from Sanofi-Aventis, Lilly, and Novo Nordisk. JMT and IH received funding from AstraZeneca, which, in part, supported the salary and consumables costs of EEV for this study. MTM has received funding from GlaxoSmithKline (in 2001 for work on HIV) and grants from MRC UK and NIH. CMD received consultancy fees from
Bariatric surgery can bring about substantial and sustainable weight loss in patients with morbid obesity, with patients losing 40–60% of their excess weight and maintaining this weight-loss for more than 10 years [24]. Despite this considerable weight-loss in patients with T2DM, studies have shown that although diabetes control is improved in the majority, a‘cure’
(confirmed against 2009 ADA agreed criteria for remission [25]) is only seen in 40–50% of pa-tients undergoing bariatric surgery [26,27] and, of these, 10% see a recurrence in their diabetes each year [28]. One possible explanation for this is that insulin sensitivity is only partially nor-malised through augmentation of Akt activity in response to surgery.
In an attempt to clarify the role Akt plays in modulating insulin sensitivity after significant weight-loss through bariatric surgery, we carried out a detailed examination of the correlation between insulin-stimulated glucose disposal and Akt signalling in eight morbidly obese insulin resistant volunteers before and after a Roux-en-Y gastric bypass (RYGB). For each volunteer, we constructed a detailed insulin dose response curve for glucose disposal rates (GDR) calcu-lated from HEC using 5 different insulin infusion rates. This was used to estimate the insulin concentrations required to induce half-maximal (GDR50) and maximal (GDR100) glucose dis-posal. In a second shorter clamp, forearm muscle biopsies were taken at three insulin infusion rates (fasting, GDR50and GDR100), which allowed insulin signalling to be examined across the full physiological range for each individual. To study insulin signalling, we measured the state of phosphorylation of Akt on both Thr308 and Ser473, sites which play a role in the regulation of kinase activity and thus glucose uptake [29,30]. We also assessed phosphorylation of the Akt substrate PRAS40, which we have shown previously to be anin vivobiomarker of Akt ac-tivity [30,31]. Glucose disposal and insulin signalling were compared to eight lean volunteers.
Materials and Methods
Materials
Anti-phospho-Akt (Thr308), anti-phospho-Akt (Ser473) and anti-phospho-PRAS40 (T246) antibodies were purchased from Cell Signaling Technology (Danvers, MA, US) and an anti-total Akt2 antibody from Upstate (Hampshire, UK). Unless otherwise stated all other materials were purchased from Sigma Aldrich (Dorset, UK). Serum glucose samples were run using Abbot Architect c Systems reagent kit, with a limit of detection of 0.139mmol/L and an assay precision of<5% total CV. Serum insulin samples were run using Abbot Architect
chemilumi-nescent microparticle immunoassay (CIMA), with a limit of detection of 1μU/ml and an assay precision of<7% total CV.
Research volunteers
Eight lean and eight obese white Caucasian volunteers participated in this study. The lean vol-unteers consisted of 4 females and 4 males, mean age 27.5±3.1 (mean ± SEM) years, BMI of 20.7±0.7 kg/m2and were on no medication (Table 1). The obese volunteers consisted of 6 fe-males and 2 fe-males, mean age of 47.9±3.5 years and BMI of 47.3±2.2 kg/m2. Four of these obese volunteers had T2DM treated with oral medication (Table 2).
Study design
At visit 1 a medical history was taken and a physical examination performed. Blood samples were taken for full blood count, clotting screen, urea and electrolytes, liver function, and fasting free fatty acids (FFA) (measured by the colourmetrix method, Randox Laboratories Limited, UK).
Ethics
Ethical approval was granted by South West 1 Research Ethics Committee and the study was sponsored by the University of Bristol, UK. Informed written consent was obtained from all the participants. All participants were adults older than 18 years. The study was carried out in accordance with the principles of the Declaration of Helsinki as revised in 2000.
Long hyperinsulinaemic euglycaemic clamp for insulin dose response
curve
Subjects attended at 8am having fasted from 11pm the night before and remained fasted throughout the test. All anti-diabetic medications were stopped for at least 24 hours before the clamp study. A cannula was placed in an antecubital vein for infusion of insulin (Actrapid, Novo Nordisk, UK) and glucose solution (5%, 10% or 20%; Baxter Pharmaceuticals, UK) and a
Table 1. Clinical characteristics and biochemical observations for lean volunteers.
Lean Sex Age (year) Weight (kg) Height (cm) BMI (kg/m2) Diabetes Fasting BG (mmol/L)
1 m 28 65 188 18.4 no 4.6
2 f 29 54 160 21.1 no 5
3 f 47 53 165 19.5 no 4.9
4 m 25 65 181 19.8 no 5.1
5 f 22 62 178 18.9 no 5.1
6 m 21 75 189 21 no 5.2
7 m 29 86 186 24.9 no 4.7
8 f 19 60 165 22 no 4.1
mean±SEM 27.5±3.1 65.0±3.9 176.5±4.1 20.7±0.7 4.8±0.1
doi:10.1371/journal.pone.0120084.t001
Table 2. Clinical characteristics and biochemical observations for obese volunteers before and after weight loss surgery.
ID Sex Age DM BMI (kg/m2) Diabetes medication
Fasting glucose (mmol/L)
HbA1c (%) Fasting free fatty acids (μmol/L)
Pre Post Pre Post Pre Post Pre Post Pre Post
1 F 37 Yes 54.8 33.5 SU, TZD None 12.3 5.2 7.5 5.9 528 470
2 M 45 Yes 50.3 38.3 Met, TZD None 9.6 5.4 7.9 5.4 763 1143
3 M 57 Yes 37.4 29.5 Met, SU None 11.9 6.2 8.5 7.4 978 489
4 F 53 Yes 54.5 46.7 Met, SU None 8.6 6.3 7.8 7.1 861 866
5 F 56 No 44.4 36.2 None None 4.6 4.1 771 838
6 F 56 No 48.2 41.1 None None 6.1 5.1 923 1005
7 F 49 No 41.5 32.9 None None 6 4 1500 604
8 F 30 No 47.4 35.6 None None 3.6 4.7 845 653
Mean±SEM 47.9±3.5 47.3±2.2 37±1.9* 7.8±1.2 5.1±0.3* 7.9±0.2 6.5±0.5* 896.1±98.6 758.5±86.3
Abbreviations for medications as follows; sulphonylureas (SU), metformin (Met) and rosiglitazone (TZD). HbA1c was only measured in patients with diabetes.
*= significant difference pre vs post with p<0.05
second cannula placed retrogradely in a contralateral dorsal hand vein, the hand being kept in a heat pad for arterialised blood sampling.
Insulin was infused at five different rates, 0.2, 0.5, 1, 2 and 5 mU/kg/min and this was in-creased in a stepwise fashion every 2 hours [32]. A priming bolus dose of insulin was given at the beginning of each increase and blood glucose (BG) levels were monitored every 5 minutes using a glucose-monitoring device (One-Touch Ultra, Life Scan Limited, UK). Using this infor-mation, the rate of glucose infusion was adjusted to maintain BG at 5mmol/L. In addition to frequent bedside glucose monitoring, samples were obtained for laboratory serum blood glu-cose and insulin level [33].
Blood was immediately centrifuged, and the plasma was frozen and stored at−80°C until analysis. Steady-state glucose uptake was achieved at 90 minutes during each of the 2-hour in-fusion periods. GDR were calculated from inin-fusion rates of glucose in the final 30 min of each rate of insulin. Insulin response curves were constructed using these data and subsequently used to determine the insulin infusion rates required to induce half-maximal (GDR50) and maximal (GDR100) glucose disposal for each individual.
Short hyperinsulinaemic euglycaemic clamp
Participants re-attended for a short HEC within 6 weeks of the long clamp. Again they attended at 8am having fasted from 11pm the night before and remained fasted throughout the test. All anti-diabetic medications were stopped for at least 24 hours before the clamp study. Similar procedures were followed as described for the long hyperinsulinaemic euglycaemic clamp.
In brief, two cannulas were used: one was placed in the antecubital vein for infusion of insu-lin and glucose solution and the other retrograde in the cannula in a contralateral dorsal hand for blood sampling.
Insulin was infused at two different rates, the infusion rate predicted from the long clamp to achieve GDR50and the infusion rate predicted to achieve GDR100. A priming bolus dose of in-sulin was given at the beginning of each increase and blood glucose (BG) levels were monitored every 5 minutes using a glucose-monitoring device (One-Touch Ultra, Life Scan Limited, UK). Using this information, the rate of glucose infusion was adjusted to maintain BG at 5mmol/ L. In addition to frequent bedside glucose monitoring, samples were obtained for laboratory serum blood glucose and insulin level at the start and end of each infusion rate to ensure the ex-pected insulin concentration had been obtained.
Muscle biopsies were taken at baseline, 45 minutes after the initiation of an insulin infusion rate that was predicted from the long clamp to achieve GDR50, and then again 45 minutes after the start of an insulin. Biopsies were briefly washed in ice-cold phosphate-buffered saline to remove residual blood and then immediately frozen in liquid nitrogen and stored at -80C until analysis.
An interval of 45 minutes was chosen as the original hyperinsulaemic clamp study by Defronzo RA [33] demonstrated that insulin concentrations reach a steady state by 20 minutes. In addition Middelbeek et al have shown that Akt Thr308 and AS160 phosphorylation was similar in biopsies taken at 30 minutes and 180 minutes into a hyperinsulaemic clamp study in lean and obese patients with and without diabetes [34].
Muscle biopsies
mm punch biopsies (30–50 mg of protein) were obtained at the proximal (first biopsy), distal (second biopsy) and middle (third biopsy) section of the exposed muscle with at least 5 cm be-tween the biopsy sites. Bebe-tween biopsies the wound was closed with steristrips and covered with gauze. At the end of the procedure the wound was closed using 4/0 Vicryl and 5/0 Ethilon.
Tissue processing
Muscle biopsies were homogenised in 40μl of ice-cold extraction buffer (50 mM Tris pH 7.5, 120 mM NaCl, 1% Nonidet P40, 40 mMβ-glycerophosphate, 1 mM benzamidine, 1 mM EDTA, 50 mM NaF, 10 mM Na4P2O7, 10μg/ml pepstatin, 10μg/ml antipain, 10μg/ml leupep-tin, 2μM microcystin, 5 mM Na3VO4, 2 mM phenylmethylsulfonyl fluoride) per mg of wet muscle using a Polytron homogenizer for a total of 1 minute. Tissue lysates were rotated for 45 minutes at 4°C before being cleared by centrifugation (16,000g for 15 minutes at 4°C). Protein concentration was determined using a commercial kit (protein assay from Bio-Rad, Hemel Hempstead, UK), and adjusted to 2 mg/ml with extraction buffer.
Western blotting
50μg aliquots of muscle protein were solubilised with 4x Laemmli sample buffer and, proteins were separated by SDS-PAGE using 4–12% gradient gels and transferred to polyvinylidene difluor-ide membranes (Millipore, Hertfordshire, UK). Membranes were blocked using 7.5% (w/v) non-fat dry milk in TBS-T (20 mM Tris pH 7.6, 137 mM NaCl, 0.1% Tween-20) for 1 hour. Membranes were washed, incubated with either phospho-Akt (Ser473), phospho-Akt (Thr308), anti-phospho-PRAS40 (T246), or anti-total Akt2 antibodies for 1 hour (all 1μg/ml in TBS-T containing 5% w/v bovine serum albumin), before washing and incubating with the appropriate secondary an-tibodies diluted in TBS-T for 1 hour. Immunoblots were visualised using an Enhanced ChemiLu-minescence detection system (ECL; GE Healthcare, Buckinghamshire, UK), and quantified by densitometry (Scion Image Software; Scion cooperation, Frederick, MD). Inter-blot comparison of phosphorylation levels was possible due to the inclusion of a positive control (lysate from insulin-stimulated rat adipocytes) on every SDS-PAGE gel to which other bands were normalised.
Statistics
All data are expressed as the mean ± standard error of the mean (SEM). Clinical data between the obese and lean groups were compared using the unpairedt-test and between the obese pa-tients before and after surgery using the pairedt-test. When examining GDR, differences in insulin sensitivity between lean and obese groups were tested using multivariate analysis of co-variance (MANCOVA). In this dose-response model, the initial GDR measurement and the re-peated measures of GDR at different insulin infusion rates were taken into account as well as the pairing of subjects when comparing pre versus post operation GDR in the obese group.
Differences in trajectories of Akt-Ser473, Akt-Thr308 and PRAS40-T246 phosphorylation as a function of plasma insulin concentration between lean and obese groups were compared graphically and using the MANCOVA F-test. When comparing obese pre versus post opera-tion Akt-Thr308, Akt-Ser473 and PRAS40-T246 phosphorylaopera-tion, pairing of subjects was taken into account.
Results
Comparison of insulin sensitivity in the lean and obese subjects
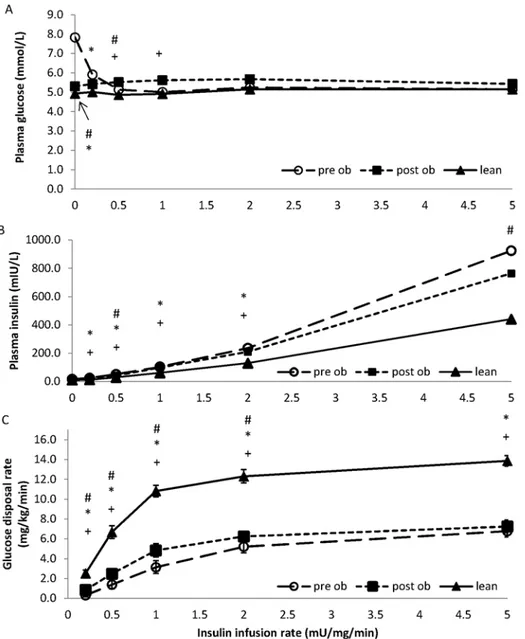
Fig 1shows the glucose and insulin concentrations obtained from blood samples taken
with a higher plasma glucose (7.8±1 vs 4.9±0.2 mmol/L, P = 0.007), glucose was subsequently maintained close to 5 mmol/L in both groups at all insulin infusion rates (Fig 1A). Plasma insu-lin concentrations were similar in each group at the start of the clamp but increased more in the obese subjects relative to the lean subjects (P =<0.01,Fig 1B).
Fig 1. Glucose disposal rates in lean and obese volunteers before and after surgery.A comparison of glucose concentration (panel A), insulin concentrations (panel B) and glucose disposal (panel C), between lean (filled triangles) and obese volunteers before (open circles; pre-op) and after (filled squares; post-op) surgery, measured during a 10 hour hyperinsulinaemic euglycaemic clamp. Insulin infusion rates of 0, 0.5, 1, 2 and 5 mU kg-1 min-1 were used. Data points represent the mean±SEM where*represents P<0.05 determined by unpaired t tests, between lean and pre-op obese volunteers; + represents P<0.05 determined by unpaired t tests between lean and post-op obese volunteers; # represents P<0.05 determined by paired t tests between pre-op and post-op obese volunteers. Glucose disposal rates were different between lean and obese volunteers (MANCOVA, P<0.001), and in obese volunteers before and after surgery (MANCOVA, P<0.05).
The insulin dose response curve for glucose disposal in obese volunteers (pre-surgery) is sig-nificantly shifted down and to the right compared to lean subjects (Fig 1C). This is evidenced by lower GDR at all insulin infusion rates examined and higher insulin infusion rate or plasma insulin concentration required to induce GDR50(MANCOVA P<0.001). This reduction could be readily seen whether we plotted GDR against insulin infusion rate (Fig 1C) or against the plasma insulin concentration achieved at each infusion rate in each subject (Fig 2A).
Phosphorylation of Akt on Thr308 (B) or Ser473 (C), and PRAS40 on T426 (D) were deter-mined by western blotting for each volunteer and quantified by densitometry using an internal standard. Data points represent the mean ± SEM of the phosphorylation score against the mean insulin concentration seen at baseline, GDR50and GDR100. Before surgery, Akt phosphorylation on Thr308 across the dose response profile was reduced in the obese volunteers when compared to the lean (Fig 2B; P = 0.06 using a MANCOVA F-test); Ser473 phosphorylation also showed a tendency to a reduction (Fig 2C; P = 0.15). Weight loss increased skeletal muscle Akt phosphor-ylation on both Thr308 and Ser473 (P = 0.020 and P = 0.027, respectively; MANCOVA F-test). PRAS40 was reduced in the obese compared with lean volunteers across dose response profile (P = 0.006, using MANCOVA F-test). After surgery, PRAS40 phosphorylation on T246 recov-ered in the obese volunteer (P = 0.003, MANCOVA F-test), and was no longer significantly dif-ferent from the lean controls (P = 0.46, respectively; MANCOVA F-test).
Glucose disposal rates were different between lean and obese volunteers (MANCOVA, P<0.001), and in obese volunteers before and after surgery (MANCOVA, P<0.05).
Phosphor-ylation of Akt on Thr308 (C) and Ser473 (B) were compared between lean and obese volun-teers (P = 0.06 and P = 0.15 respectively), and in obese volunvolun-teers before and after surgery (P = 0.020 and P = 0.027 respectively). However, there were no statistical differences between the lean and obese volunteers after surgery.
Comparison of insulin-stimulated Akt and PRAS40 phosphorylation
between lean and obese subjects
Insulin signalling in obese versus lean volunteers were compared. Before surgery, Akt phos-phorylation on Thr308 across the dose response profile was reduced in the obese volunteers when compared to the lean non-insulin resistant volunteers (Fig 2B; P = 0.06 using a MAN-COVA F-test). Ser473 phosphorylation also showed a tendency to a reduction (Fig 2C; P = 0.15). PRAS40 phosphorylation was also reduced in the obese compared with lean volun-teers across the dose response profile (Fig 2D, p = 0.006, using a MANCOVA F-test).
Comparison of insulin sensitivity in obese subjects before and after
surgery
Surgery resulted in a mean weight-loss of 29.9±4.0 kg (135.2±7.1 vs 105.3±6.9 kg, P<0.001,
Table 2), with accompanied glycaemic improvement. In those volunteers with diabetes,
reduc-tions in fasting plasma glucose (7.8±1.2 vs 5.1±0.3mmol/L, P = 0.01) and HbA1c were observed (7.9±0.2 vs 6.5±0.5%, P = 0.02), together with cessation of all diabetes medications (Table 2).
The plasma insulin concentrations attained were similar across all infusion rates, except during the 0.5 and 5 mU/kg/min infusion rates where the insulin concentrations achieved were lower post-operatively (42.7±4.5mIU/L vs 52.3±5.5 mIU/L, P = 0.03; and 765±96.2 mIU/L vs 925±121.6 mIU/L, P = 0.04; respectively,Fig 1B).
Fig 2. Summary of glucose disposal rates and insulin signalling in lean and obese volunteers, pre and post weight loss surgery.A comparison of glucose disposal (panel A), phosphorylation of Akt on Thr308 (panel B), phosphorylation of Akt on Ser473 (panel C) and phosphorylation of PRAS40 on T426 (panel D) between lean (filled triangles) and obese volunteers before (open circles; pre-op) and after (filled squares; post-op) surgery. The glucose disposal was measured during a 10 hour hyperinsulinaemic euglycaemic clamp with insulin infusion rates of 0.2, 0.5, 1, 2 and 5 mU kg-1 min-1. Data points represent the mean±SEM with the glucose disposal plotted against the mean insulin concentration achieved at each insulin
infusion rate.
more insulin resistant than the lean (i.e. obese patients required more insulin to induce a GDR50response than the lean (73.3±12.8 post-surgery vs 33.8±11.9 mIU/L lean, P = 0.012,Fig
2A); at an insulin infusion rate of 1 mU/kg/min, glucose disposal was 4.8±0.7 mg/kg/min in obese volunteers post-surgery versus 10.8±0.6 mg/kg/min in the lean (P<0.001). Maximal
GDRs reached 7.3±0.6 mg/kg/min in the obese post-surgery versus 13.9±0.5 mg/kg/min in the lean (P<0.001).
Comparison in insulin-stimulated Akt and PRAS40 phosphorylation in
obese subjects before and after surgery
As shown in Fig2Band2C, weight loss was accompanied by an increased skeletal muscle Akt phosphorylation on both Thr308 and Ser473 (P = 0.020 and P = 0.027, respectively; MAN-COVA F-test). PRAS40 phosphorylation on T246 also improved (P = 0.003, MANMAN-COVA F-test). After surgery insulin-stimulated Akt-Thr308 and Ser473 phosphorylation, as well as PRAS40-Thr246 phosphorylation were not significantly different from the lean controls (P = 0.6, P = 0.35 and P = 0.46, respectively; MANCOVA F-test). A representative experiment is shown inFig 3.
Discussion
This study aimed to explore the molecular basis underlying the impairment in insulin stimulated glucose disposal observed in obesity. A comprehensive examination of Akt phosphorylation was performed in skeletal muscle of lean and morbidly obese individuals at fasting and at higher plasma insulin concentrations, corresponding to half maximal (GDR50) and maximal (GDR100) levels of glucose disposal for each individual. Repeating these studies four months after the obese participants underwent a Roux-en-Y gastric bypass, a procedure that led to significant weight loss and cessation of requirement for diabetes medication, enabled us to look at the effect of weight loss on Akt phosphorylation and activity, and glucose disposal rates in response to insu-lin. We used lean controls as a benchmark for optimum insulin signalling and sensitivity.
Fig 3. Insulin signalling in obese volunteers, pre and post weight loss surgery.Obese volunteers (pre and post-op) underwent a 3-hour euglycaemic hyperinsulinaemic clamp and muscle biopsies were taken at fasting (0) and insulin infusion rates predicted to achieve half maximal (GDR50) and maximal (GDR100) rates
of glucose disposal. The extent of phosphorylation of Akt on Thr308, Ser473 and PRAS40 on T246 was determined by western blotting. The results shown are from a single individual, but are representative of the eight obese volunteers [seeMaterials and Methods].
As expected, when examining whole body glucose disposal, the morbidly obese individuals were significantly less insulin sensitive than the lean volunteers. The insulin dose response curve was shifted down and to the right. GDRs were lower at all insulin infusion rates exam-ined (Figs1Cand2A). RYGB surgery-induced weight loss (22.9±4.0kg) significantly improved insulin-stimulated glucose disposal with the greatest change occurring at GDR50, and no change at GDR100. While the glucose disposal profile still remained insulin resistant relative to lean volunteers, the improvement was clinically meaningful as it was accompanied by normali-sation of fasting plasma glucose and HbA1c, and cesnormali-sation of diabetes medication in all four of the volunteers with diabetes (Table 2).
Previous studies that have examined the effect of bariatric surgery on IR have used either a measure of basal insulin sensitivity, HOMA, or a HEC at a single insulin infusion rate equiva-lent to 1mU/kg /min. In these studies, HOMA and glucose disposal improved significantly [35–38]. The improvement we see at 1mU/kg/min is of similar magnitude to that reported in other studies [37], however our study is the first to undertake a detailed examination across a range of plasma insulin concentrations.
Glucose disposal in the obese subjects after surgery remained highly insulin resistant when compared with the lean subjects despite significant weight loss, improved glycaemic control and metabolic parameters. In contrast, surgery-induced weight loss improved Akt-Thr308 phosphorylation (pre vs post surgery, P = 0.020; MANCOVA F-test), and the phosphorylation of the downstream Akt substrate PRAS40 on Thr246 (P = 0.003, MANCOVA F-test), such that they became indistinguishable across the insulin dose response profile to those observed in lean subjects (P = 0.6 and 0.46, respectively; MANCOVA F-test). In human biopsy samples and human platelets we have previously shown that Thr308 is an excellent biomarker for Akt kinase activity, which is consistent with this observation [30,31]. Taken together, this suggests that the reduced insulin-stimulated Akt-Thr308 phosphorylation, and activity of this kinase to-wards downstream substrates such as PRAS40, as observed in obese patients before surgery when compared to lean subjects (P = 0.06 and P = 0.006 for Akt-Thr308 and PRAS40-Thr246, respectively; MANCOVA F-test), may reflect a state of‘Akt- resistance’to insulin action in the obese, a reversible phenomenon that can be improved by surgery induced weight loss.
We also saw an improvement in insulin-stimulated Akt-Ser473 phosphorylation after sur-gery in obese subjects (pre vs post sursur-gery, P = 0.027; MANCOVA F-test). However, the reduc-tion in insulin-stimulated Akt-Ser473 phosphorylareduc-tion in obese subjects before surgery, when compared to lean individuals, was not as obvious as it was for Thr308 phosphorylation and would require a larger sample size to confirm that it normalises in the same manner as Akt-Thr308 phosphorylation after weight loss.
The mechanism by which weight loss leads to the substantial improvement in Akt-Thr308 and Akt activity leading to PRAS40-Thr246 phosphorylation is unknown. Circulating FFA lev-els were higher in the obese subjects prior to surgery when compared to lean individuals (759 ±86μmol/L versus 561±80.8μmol/L, respectively; P = 0.06, unpaired studentt-test). Elevated FFA have been reported to reduce insulin-stimulated IRS1 tyrosine phosphorylation, possibly via activation of PKCθ, which would be expected to reduce insulin-stimulated Akt activation [42]. This does not appear to play a role in the current study as no change in circulating FFA were observed in the obese subjects after surgery (Table 2), although we cannot exclude the possibility that intramyocellular levels of FFA were reduced after surgery so reducing local PKCθactivity.
RYGB surgery increases GLP-1 production immediately after the operation and remains el-evated for at least 18 months [43,44]. Studies have shown that GLP-1 activates Akt signalling, either via transactivation of the epidermal growth factor receptor or induction of cAMP and cAMP response element-binding dependent transcription of IRS2 [45]. Thus the increase in GLP-1 could be one way that bypass surgery improves insulin signaling. This may partially ex-plain the normalisation of Akt activity after RYGB, however, there is no direct evidence linking increased GLP-1 production and improved phosphorylation of Akt in the morbidly obese indi-viduals undergoing bariatric surgery.
In previous studies, two hour insulin infusion rates were employed before biopsies were taken as it was considered that this time interval was required before insulin concentrations and glucose disposal become stable [46]. However Defronzo’s original hyperinsulinaemic study showed that insulin concentration reach a steady state after 20 minutes [33] and Middel-beek et al have shown that Akt Thr308 and AS160 phosphorylation was similar in biopsies taken at 30 minutes and 180 minutes into a hyperinsulinaemic clamp study in lean and obese patients with and without diabetes [34]. In light of this we elected to do our muscle biopsies after only 45minutes of insulin infusion. In addition looking at changes with a shorter insulin infusion time is more physiological as high insulin concentrations are rarely elevated for 2 hours invivo. It may well be that if we had biopsied after 2hours of insulin we may have seen slightly different levels of phosphorylation of AKT [47].
It remains to be established whether the glucose disposal profile of our obese volunteers would approach that of lean individuals upon further weight reduction, as this might be expected to reduce circulating FFA levels to normal [48,49]. The findings that only 40–50% of patients with diabetes see a remission in diabetes after RYGB, and of those 10% see a reoccurrence each year despite an improvement in insulin secretion and insulin receptor concentration, suggest that this does not occur. However in 30 RYGB patients we have seen further improvements in IR between 6 and 18 months with only 5% more weight loss [50].
To conclude, our data suggest that an improvement in Akt-Thr308 phosphorylation and its kinase activity induced by weight loss brought about by bariatric surgery is associated with a small but clinically significant improvement in glucose homeostasis. However a major defect in glucose disposal, most likely in muscle, still remains, which underlies IR in morbid obesity and which is downstream or parallel to Akt signalling. This defect may be overcome once further weight loss has been attained and circulating FFA levels are normalised, or may remain and explain why resolution of diabetes after bariatric surgery is not seen in all cases and is not always permanent.
Acknowledgments
Author Contributions
Conceived and designed the experiments: MZC IH RCA JMT. Performed the experiments: MZC RCA CAH EEV IH JMT. Analyzed the data: MTM MZC RCA IH JMT. Contributed reagents/materials/analysis tools: MZC RCA CAH EEV IH JMT DAB. Wrote the paper: MZC CAH EEV IH RCA JMT CMD MTM DAB. Preformed patient visits: MZC DAB RCA.
References
1. Colditz GA, Willett WC, Rotnitzky A, Manson JE. Weight-Gain as a Risk Factor for Clinical Diabetes-Mellitus in Women. Annals of internal medicine. 1995; 122(7):481–6. PMID:7872581
2. Muniyappa R, Lee S, Chen H, Quon MJ. Current approaches for assessing insulin sensitivity and resis-tance in vivo: advantages, limitations, and appropriate usage. Am J Physiol Endocrinol Metab. 2008; 294(1):E15–26. PMID:17957034
3. Bonadonna RC, Groop L, Kraemer N, Ferrannini E, Del Prato S, DeFronzo RA. Obesity and insulin re-sistance in humans: a dose-response study. Metabolism. 1990; 39(5):452–9. PMID:2186255 4. Dugani CB, Klip A. Glucose transporter 4: cycling, compartments and controversies. EMBO Rep. 2005;
6(12):1137–42. PMID:16319959
5. Watson RT, Pessin JE. Bridging the GAP between insulin signaling and GLUT4 translocation. Trends in Biochemical Sciences. 2006; 31(4):215–22. PMID:16540333
6. Pender C, Goldfine ID, Tanner CJ, Pories WJ, MacDonald KG, Havel PJ, et al. Muscle insulin receptor concentrations in obese patients post bariatric surgery: relationship to hyperinsulinemia. International journal of obesity and related metabolic disorders: journal of the International Association for the Study of Obesity. 2004; 28(3):363–9.
7. Garvey WT, Maianu L, Hancock JA, Golichowski AM, Baron A. Gene expression of GLUT4 in skeletal muscle from insulin-resistant patients with obesity, IGT, GDM, and NIDDM. Diabetes. 1992; 41(4):465–75. PMID:1535055
8. Leng Y, Karlsson HK, Zierath JR. Insulin signaling defects in type 2 diabetes. Reviews in endocrine & metabolic disorders. 2004; 5(2):111–7.
9. Randle PJ, Garland PB, Hales CN, Newsholme EA. The glucose fatty-acid cycle. Its role in insulin sensi-tivity and the metabolic disturbances of diabetes mellitus. Lancet. 1963; 1(7285):785–9. PMID:13990765 10. Shulman GI. Cellular mechanisms of insulin resistance. J Clin Invest. 2000; 106(2):171–6. PMID:
10903330
11. Kohn AD, Summers SA, Birnbaum MJ, Roth RA. Expression of a constitutively active Akt Ser/Thr ki-nase in 3T3-L1 adipocytes stimulates glucose uptake and glucose transporter 4 translocation. The Journal of biological chemistry. 1996; 271(49):31372–8. PMID:8940145
12. Cong LN, Chen H, Li Y, Zhou L, McGibbon MA, Taylor SI, et al. Physiological role of Akt in insulin-stimulated translocation of GLUT4 in transfected rat adipose cells. Mol Endocrinol. 1997; 11:1881–90. PMID:9415393
13. Gonzalez E, McGraw TE. Insulin signaling diverges into Akt-dependent and -independent signals to regulate the recruitment/docking and the fusion of GLUT4 vesicles to the plasma membrane. Mol Biol Cell. 2006; 17(10):4484–93. PMID:16914513
14. Cho H, Mu J, Kim JK, Thorvaldsen JL, Chu Q, Crenshaw EB, et al. Insulin resistance and a diabetes mellitus-like syndrome in mice lacking the protein kinase Akt2 (PKB beta). Science. 2001;
292:1728–31. PMID:11387480
15. Krook A, Roth RA, Jiang XJ, Zierath JR, Wallberg-Henriksson H. Insulin-stimulated Akt kinase activity is reduced in skeletal muscle from NIDDM subjects. Diabetes. 1998; 47(8):1281–6. PMID:9703329 16. Kim Y-B, Shulman GI, Kahn BB. Fatty Acid Infusion Selectively Impairs Insulin Action on Akt1 and
Protein Kinase C lambda /zeta but Not on Glycogen Synthase Kinase-3. J Biol Chem. 2002; 277(36):32915–22. PMID:12095990
17. Belfort R, Mandarino L, Kashyap S, Wirfel K, Pratipanawatr T, Berria R, et al. Dose-Response Effect of Elevated Plasma Free Fatty Acid on Insulin Signaling. Diabetes. 2005; 54(6):1640–8. PMID:15919784 18. Brozinick JT Jr., Roberts BR, Dohm GL. Defective Signaling Through Akt-2 and -3 But Not Akt-1 in
Insulin-Resistant Human Skeletal Muscle: Potential Role in Insulin Resistance. Diabetes. 2003; 52(4):935–41. PMID:12663464
20. Kim YB, Nikoulina SE, Ciaraldi TP, Henry RR, Kahn BB. Normal insulin-dependent activation of Akt/ protein kinase B, with diminished activation of phosphoinositide 3-kinase, in muscle in type 2 diabetes. J Clin Invest. 1999; 104(6):733–41. PMID:10491408
21. Kruszynska YT, Worrall DS, Ofrecio J, Frias JP, Macaraeg G, Olefsky JM. Fatty Acid-Induced Insulin Resistance: Decreased Muscle PI3K Activation But Unchanged Akt Phosphorylation. J Clin Endocrinol Metab. 2002; 87(1):226–34. PMID:11788651
22. Meyer MM, Levin K, Grimmsmann T, Beck-Nielsen H, Klein HH. Insulin signalling in skeletal muscle of subjects with or without Type II-diabetes and first degree relatives of patients with the disease. Diabeto-logia. 2002; 45(6):813–22. PMID:12107725
23. Storgaard H, Jensen CB, Bjornholm M, Song XM, Madsbad S, Zierath JR, et al. Dissociation between Fat-Induced in Vivo Insulin Resistance and Proximal Insulin Signaling in Skeletal Muscle in Men at Risk for Type 2 Diabetes. J Clin Endocrinol Metab. 2004; 89(3):1301–11. PMID:15001626
24. Sjostrom L, Narbro K, Sjostrom CD, Karason K, Larsson B, Wedel H, et al. Effects of bariatric surgery on mortality in Swedish obese subjects. The New England journal of medicine. 2007; 357(8):741–52. PMID:17715408
25. Buse JB, Caprio S, Cefalu WT, Ceriello A, Del Prato S, Inzucchi SE, et al. How do we define cure of dia-betes? Diabetes Care. 2009; 32(11):2133–5. doi:10.2337/dc09-9036PMID:19875608
26. Pournaras DJ, Aasheim ET, Sovik TT, Andrews R, Mahon D, Welbourn R, et al. Effect of the definition of type II diabetes remission in the evaluation of bariatric surgery for metabolic disorders. Br J Surg. 2011.
27. Miras AD, Risstad H, Baqai N, Law S, Søvik TT, Mala T, et al. Application of the International Diabetes Federation and American Diabetes Association criteria in the assessment of metabolic control after bar-iatric surgery. Diabetes Obes Metab. 2014; 16(1):86–9. doi:10.1111/dom.12177PMID:23841525 28. DiGiorgi M, Rosen DJ, Choi JJ, Milone L, Schrope B, Olivero-Rivera L, et al. Re-emergence of diabetes
after gastric bypass in patients with mid- to long-term follow-up. Surgery for obesity and related dis-eases: official journal of the American Society for Bariatric Surgery. 2010; 6(3):249–53. doi:10.1016/j. soard.2009.09.019PMID:20510288
29. Alessi DR, Andjelkovic M, Caudwell B, Cron P, Morrice N, Cohen P, et al. Mechanism of activation of protein kinase B by insulin and IGF-1. The EMBO journal. 1996; 15(23):6541–51. PMID:8978681 30. Vincent EE, Elder DJ, Thomas EC, Phillips L, Morgan C, Pawade J, et al. Akt phosphorylation on
Thr308 but not on Ser473 correlates with Akt protein kinase activity in human non-small cell lung can-cer. British journal of cancan-cer. 2011; 104(11):1755–61. doi:10.1038/bjc.2011.132PMID:21505451 31. Moore SF, Hunter RW, Hers I. mTORC2 protein complex-mediated Akt (Protein Kinase B) Serine 473
Phosphorylation is not required for Akt1 activity in human platelets [corrected]. J Biol Chem. 2011; 286(28):24553–60. doi:10.1074/jbc.M110.202341PMID:21592956
32. Rizza RA, Mandarino LJ, Gerich JE. Dose-response characteristics for effects of insulin on production and utilization of glucose in man. The American journal of physiology. 1981; 240(6):E630–9. PMID:7018254 33. DeFronzo RA, Tobin JD, Andres R. Glucose clamp technique: a method for quantifying insulin
secre-tion and resistance. The American journal of physiology. 1979; 237(3):E214–23. PMID:382871 34. Middelbeek RJ, Chambers MA, Tantiwong P, Treebak JT, An D, Hirshman MF, et al. Insulin stimulation
regulates AS160 and TBC1D1 phosphorylation sites in human skeletal muscle. Nutr Diabetes. 2013; 3: e74 doi:10.1038/nutd.2013.13PMID:23752133
35. Ballantyne G, Farkas D, Laker S, Wasielewski A. Short-term Changes in Insulin Resistance following Weight Loss Surgery for Morbid Obesity: Laparoscopic Adjustable Gastric Banding versus Laparo-scopic Roux-en-Y Gastric Bypass. Obesity Surgery. 2006; 16:1189–97. PMID:16989703
36. Friedman JE, Dohm GL, Leggett-Frazier N, Elton CW, Tapscott EB, Pories WP, et al. Restoration of in-sulin responsiveness in skeletal muscle of morbidly obese patients after weight loss. Effect on muscle glucose transport and glucose transporter GLUT4. J Clin Invest. 1992; 89(2):701–5. PMID:1737857 37. Rosa G, Mingrone G, Manco M, Euthine V, Gniuli D, Calvani R, et al. Molecular mechanisms of
diabe-tes reversibility after bariatric surgery. Int J Obes. 2007; 31(9):1429–36. PMID:17515913 38. Wickremesekera K, Miller G, Naotunne T, Knowles G, Stubbs R. Loss of Insulin Resistance after
Roux-en-Y Gastric Bypass Surgery: a Time Course Study. Obesity Surgery. 2005; 15:474–81. PMID: 15946424
39. Garvey WT, Maianu L, Zhu JH, Brechtel-Hook G, Wallace P, Baron AD. Evidence for defects in the traf-ficking and translocation of GLUT4 glucose transporters in skeletal muscle as a cause of human insulin resistance. The Journal of clinical investigation. 1998; 101(11):2377–86. PMID:9616209
41. Oh E, Thurmond DC. The stimulus-induced tyrosine phosphorylation of Munc18c facilitates vesicle exocytosis. J Biol Chem. 2006; 281(26):17624–34. PMID:16638745
42. Savage DB, Petersen KF, Shulman GI. Disordered Lipid Metabolism and the Pathogenesis of Insulin Resistance. Physiol Rev. 2007; 87(2):507–20. PMID:17429039
43. Dar MS, Chapman WH, Pender JR, Drake AJ, O'Brien K, Tanenberg RJ, et al. GLP-1 response to a mixed meal: what happens 10 years after Roux-en-Y gastric bypass (RYGB)? Obes Surg. 2012; 22(7):1077–83. doi:10.1007/s11695-012-0624-1PMID:22419108
44. Korner J, Bessler M, Inabnet W, Taveras C, Holst JJ. Exaggerated glucagon-like peptide-1 and blunted glucose-dependent insulinotropic peptide secretion are associated with Roux-en-Y gastric bypass but not adjustable gastric banding. Surg Obes Relat Dis. 2007; 3(6):597–601. PMID:17936091
45. González N, Acitores A, Sancho V, Valverde I, Villanueva-Peñacarrillo ML. Effect of GLP-1 on glucose transport and its cell signalling in human myocytes. Regul Pept. 2005; 126(3):203–11. PMID:
15664668
46. Bakker LE, van Schinkel LD, Guigas B, Streefland TC, Jonker JT, van Klinken JB, et al. A 5-day high-fat, high-calorie diet impairs insulin sensitivity in healthy, young South Asian men but not in Caucasian men. Diabetes. 2014; 63(1):248–58. doi:10.2337/db13-0696PMID:24357702
47. Grimmsmann T, Levin K, Meyer MM, Beck-Nielsen H, Klein HH. Delays in insulin signaling towards glu-cose disposal in human skeletal muscle. J Endocrinol. 2002; 172(3):645–51. PMID:11874713 48. Benedetti G, Mingrone G, Marcoccia S, Benedetti M, Giancaterini A, Greco AV, et al. Body Composition
and Energy Expenditure after Weight Loss Following Bariatric Surgery. J Am Coll Nutr. 2000; 19(2):270–4. PMID:10763909
49. Mari A, Manco M, Guidone C, Nanni G, Castagneto M, Mingrone G, et al. Restoration of normal glucose tolerance in severely obese patients after bilio-pancreatic diversion: role of insulin sensitivity and beta cell function. Diabetologia. 2006; 49(9):2136–43. PMID:16819611