EXPLANATORY METHODS OF MARKETING DATA
ANALYSIS – THEORETICAL AND METHODOLOGICAL
CONSIDERATIONS
Lecturer Manuela Rozalia GABOR „Petru Maior” University,Tg. Mureş
Abstract:
Explanatory methods of data analysis – also named by some authors supervised learning methods - enable researchers to identify and analyse configurations of relations between two or several variables, most of them with a high accuracy, as there is possibility of testing statistic significance by calculating the confidence level associated with validation of relation concerned across the entire population and not only the surveyed sample. The paper shows some of these methods, respectively: variance analysis, covariance analysis, segmentation and discriminant analysis with the mention - for every method – of applicability area for marketing research.
Key words: explanatory methods, ANOVA, ANCOVA, segmentation and discriminant analysis
Introduction
The data analysis methods are unlike the descriptive ones, in that, they divide variables in dependent and independent and study the independence relations and not the interdependence relations as the descriptive methods. Most times, they are also preceded by the descriptive
analysis methods and as a result, both explained variable and the explanatory ones are defined in relation to the problem context.
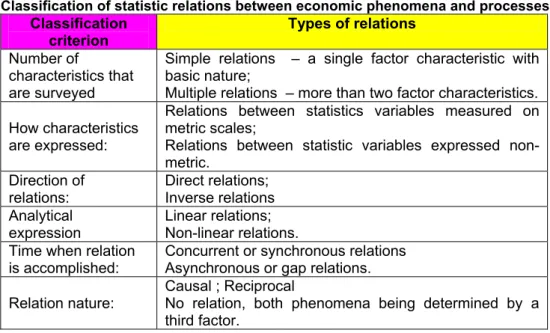
Relations between economic phenomena and processes occur as statistic relations (stochastic) and they can be classified according to several criteria, as follows (table no. 1):
Table 1 Classification of statistic relations between economic phenomena and processes
Classification criterion
Types of relations
Number of
characteristics that are surveyed
Simple relations – a single factor characteristic with basic nature;
Multiple relations – more than two factor characteristics.
How characteristics are expressed:
Relations between statistics variables measured on metric scales;
Relations between statistic variables expressed non-metric.
Direction of relations:
Direct relations; Inverse relations Analytical
expression
Linear relations; Non-linear relations. Time when relation
is accomplished:
Concurrent or synchronous relations Asynchronous or gap relations.
Relation nature:
Causal ; Reciprocal
In marketing, research data is characterized by variability as both individuals and variables are researched, in their turn they have other feature, namely these variables can relate both to noticeable, measurable and quantitatively represented variables, either to variables that comprise aspects related to attitudes, opinions, interests etc. the explanatory methods being useful to research such variables.
Variance analysis (ANOVA) and covariance analysis (ANCOVA)
These methods (the initiator of these methods is mathematician R. Fisher, in 1920) are used to investigate the differences between average values of the dependent variable under effect of some controlled independent variables, and influence of uncontrolled independent variables, respectively.
The variance analysis is in several versions, respectively, when a single dependent variable is surveyed and several factors (n) are taken into consideration, the method is named variance analysis with n factors, and when several dependent variables and several factors are surveyed simultaneously, the method is known as the multivariate variance analysis (MANOVA) and is used for data from marketing experiments very often. When the set of independent variables contains both non-metric and metric variables the method is used as the covariance analysis (ANCOVA). According to some authors, the covariance analysis or the simultaneous variance is a combination of two statistic methods; the regression and variance analysis combined in case of experimental projection and used in order to lower the effect of variations that experiment is unable to control.
Metric dependent variables
Single independent
Binary
T test
1 or several single independent
Factor category:
Category and range type
Range type
Variance analysis
Single factor
Univariate variation analysis
Multivariate variation analysis
Covariance Regression
Several factors
Figure 1. Relation between variance analysis, covariance analysis and regression analysis
(Source: Malhorta, N. - Études marketing avec SPSS – 4e édition, Ed. Pearson Education
As explanatory method, the variance analysis differs from the regression analysis by that, as a rule, the independent variable has a qualitative nature (in case when it is quantitative it will be approached as a qualitative variable) but it has in common the fact that it uses the observed data in analysis. In order to emphasize better this difference between the two methods, let’s consider a conventional example in the area of marketing: analysis of a product selling according to the unit price. In the regression analysis, means of repartitions should be found in the regression curve that describes the relation between the two variables. The
variance analysis assumes that each price level is associated with a distinct population that expresses the values of sales for the set level, each population having a certain repartition. In figure no. 1 the relations and differencies between regression analysis, variance analysis and covariance analysis are schematically represented
The major advantage of this method is provided by the ability to locate the source of significant differences at combined groups, carried out based on two, three or several characteristics.
Stages of accomplishing the single factor variance analysis are illustrated in figure no. 2.
Identification of dependent and independent
variables
Total variation decomposition
Effect measurement
Testing of statistic significance
Result interpretation
Figure no. 2 – Stages of carrying out the single factor variation analysis
(Adaptation after Malhorta, N.-Études marketing avec SPSS, Ed. Pearson Education
France, Paris, 2004, p. 395)
To check the model reliability the residue analysis is used to diagnose if: variation is unsteady, errors are not independent, abnormal values are present, independent variables are overlooked, errors are not normally independent.
The basic assumptions - according to N. Malhotra – that data should meet in order to use this data analysis method relate to the following aspects:
• Variables are measured on types of scale required by this method;
• Categories of independent variables are assumed to be steady;
• Error has a normal distribution and is not related to any category of independent variable;
• Error values are not correlated among them;
Table 2 Indicators and statistic notions related to variance analysis
Indicator or statistic notion used Description Variation between groups
It represents variation of dependent variable appropriate to average variation on categories of independent variable. It represents the part of sum of squares related to the independent variable.
Variation inside groups
It represents variation of the dependent variable due to variation inside each category of independent variable. This variation is not generated by the independent variable.
Total variation
It represents variation of the dependent variable appropriate to average variation on categories of independent variable. It represents the part of sum of squares related to the dependent variable deviations related to the independent variable.
Mean square Is calculated as a sum of squares divided to the number of degrees of freedom.
Statistic tests Eta test, F test
(Adaptation after Dăneţiu, T. – Multivariate methods used in computer aided marketing data
analysis – doctoral dissertation and Malhorta, N. - Études marketing avec SPSS – 4e
édition, Ed. Pearson Education France, Paris, 2004)
A variance analysis table can be thus summarized (table no. 3):
Table 3 ANOVA table
Dispersion nature
Sum of squares
No. of degrees of freedom Ratio 2/3 M (4)
1 2 3 4 5
In cells
∑
∑∑
= = =
−
t j n k ij ijk r ix
x
1 1 2 1)
(
rt (n-1) 2
t
s
σ2Interaction
(r-1)(t-1) 2 2
s
∑∑
= =+
−
−
r i t j iij
x
x
x
x
n
1 1 2)
(
∑∑
−
−
+
r i t j ijt
r
n
2 2)
1
)(
1
(
θ
σ
Columns
∑
−
t
j
j
x
x
nr
(
)
2(t-1) 2
3
s
∑
−
+
t i ja
t
nr
2 2)
1
(
σ
Lines
∑
−
t
j
i
x
x
nt
(
)
2(r-1) 2
4
s
∑
−
+
t i ia
r
nt
2 2)
1
(
σ
Total
∑
∑∑
= = =
−
t j n k ijk r ix
x
1 1 2 ... 1)
(
(rtn-1)In marketing research, the variance analysis (univariate or multivariate) and covariance analysis is usedto identify the differencies between groups or segments bringing its contribution to carrying out the marketing experiments, the factor projections, Latin squares and Greek-Latin squares being most common. Examples of these methods for marketing data are comprised in table no. 4, on each subtype of method, variance analysis, multivariate variance analysis and covariance analysis, respectively.
Table 4 Applications of marketing variance analysis method
Type Examples for marketing data
Variance an
alysis
• There are differences as regards total monthly duration of phone calls between people in various regions in the country or on categories of education and income?
• What are the differences as regards buying intentions at different prices levels of a product?
• The assumption concerning a certain product consumption within consumers grouped in four groups can be tested (occasional consumption, average, high or no consumption) is the same as regards a certain brand of the surveyed product;
• Perceptions concerning diversity of supply (categories), interaction with sellers (yes/no) and how complaints (categories) were handled and influence the customer satisfaction?
• Influence of a commodity and packaging colour on sales;
• Perception of tour-operators and travel agencies in a certain country as regards four destinations, for instance, Mediterranean – Greece, Egypt, Italy, Turkey – variables that can be taken into consideration –being affective, perceptual, and image criteria for each country, the variance analysis is able to indicate that, for instance, affective factors show significant differences across the four destinations concerned.
Multivaria
te varianc
e
ana
lysis
• Coffee consumption is influenced by age (categories) and education (categories)?
• Study concerning consumers’ preferences for different beer brands, surveying if there are differences concerning weekly beer consumption in line with the type of consumers and geographical region;
• How do vary the consumers’ buying intentions in line with the various price levels and various distribution levels of a product brand;
• How are sales of a brand influenced when interact various advertising levels – high, average, low – and price levels – high, average, low;
• We are investigating if the level of education (secondary, high school, high education, post university) and age (< 35 years, 35 – 55 years, > 55 years) is affecting a certain brand consumption;
Cova
riance analysis
• It can be used when preferences for a product or a service are surveyed according to consumption and loyalty, at the same time taking into consideration the individuals’ attitude opposite to the surveyed subject and the importance provided to this subject (for instance, importance of nutrition related to cereal consumption) where as qualitative independent variables are used consumption and loyalty versus a product and the attitude regarding nutrition and importance provided to it are used as co variables (metric independent variables);
• in order to study how consumers’ buying intentions vary according to different price levels, taking into consideration their attitude by reporting to brand;
• to determine how different groups exposed to different billboard commercials evaluate a brand, their previous knowledge about the brand concerned should be surveyed.
• Sales of some shops depend on population income in that location, on the traffic of people in the area where shops are etc.
Discriminant analysis
As explanatory method of data analysis, we can define it as a method offorecast thelinear relation between a non-diametric dependent variable type dichotomous or multichotomous and linear combinations of several metric independent variables. Spircu L. says this method applies to a population of individuals defined by continuous or category variables that are a priori (or even naturally) divided in groups. There are two versions of this method, the discriminant analysis of two groups respectively, when dichotomous variables are comprised in the study, and the multiple discriminant analysis, when the dependent variable has several categories.
This method of data analysis is the only one that can be approached from two methodological perspectives, as the explanatory method as well as the descriptive method respectively, basically having two purposes: a descriptive one (searching an as low as possible number of explanatory variables to express ”best” the separation of individuals in classes) and an explanatory purpose, of forecast (consisting of checking to what extent a certain individual, still ungrouped, is similar to individuals in a certain class,
and if this similitude exists, to decide its distribution to the class concerned).
The major objectives of discriminant analysis relates to:
• Building the discriminant functions, represented as a linear combination of independent variables (explanatory or predictor variables) that will discriminate best between categories of dependent variables;
• Setting independent variables that contribute mostly to explaining the differencies between groups;
• Classification of cases (objects) by allotment to a certain group, according to values of independent variables;
• Setting the existence of some significant differences between the groups thus built;
• Evaluation of classification accuracy.
• Determination of linear correlations of predictor variables to separate the groups by maximization of intergroup variations compared to intragroup variation.
• Testing if there are major differencies between two groups based on the group centroid;
profile is known but the group they belong is not known.
Stages covered in carrying out the discriminant analysis are illustrated in figure no. 3.
Figure no. 3 – Stages of accomplishing discriminant analysis
(Source: Malhorta, N.-Études marketing avec SPSS – 4e edition, Ed. Pearson Education
France, Paris, 2004, p. 479)
In the first stage important aspects are connected with the fact that the dependent variable is measured on the non-metric scale and independent variables should be metric, formation of the two samples – analysis and validation. In the stage of result interpretation graphics like territorial maps are very eloquent. Related to this issue, several types of multivariate maps are mentioned in the literature.
These maps can be carried out by means of discriminant analysis: vector-point map, dispersed representation of all groups, discriminant territorial map, vectorial-territorial map.
Indicators and statistic notions related to the method of discriminant analysis of explanatory data analysis are illustrated systematically in table no. 5.
Table 5 Indicators and statistic notions related to discriminant analysis
Indicator or statistic notion
used
Description
Canonical correlation
Measures association between discriminant function values and dependent variable groups (expressed by means of a set of category variables in line with these categories);
Centroids
Represent average values of discriminant scores in case of a certain group. For each group and for each discriminant function a centroid can be calculated. Within a group, all average values related to discriminant functions composed the group centroids.
Classification matrix
Often named confusion matrix or forecast matrix, it contains the number of cases classified correctly, and incorrectly, respectively. Cases classified correctly are shown on diagonal and those classified incorrectly are placed outside this diagonal. The ratio between the sum of elements on diagonal and the total number of surveyed cases is called contingence rate.
Discriminant function coefficients
Are variable multiplicators, when variables are expressed in initial measurement units. They show as a non-standard form.
Problem wording
Estimation of discriminant function coefficients
Determination of statistic significance of discriminant function
Standard coefficients of discriminant function
Are discriminant function coefficients obtained after normalization (standardization) of independent variables.
Own value
For each discriminant function, the own value is the ratio between the sum of squares concerning deviation between groups (variation between groups) and the sum of squares within groups (variation inside groups). High own values show that discriminate function distinguishes the groups well.
Structure correlation
Also named discriminant loads, represent simple correlations between independent variables and discriminant function.
Class average and
standard error Are calculated for each explanatory variable and each class.
Intra-class
correlation matrix
Is carried out starting from averages of covariance matrix for each class.
Total correlation matrix
Is obtained when cases are approached as if they come from a single sample and correlations are calculated.
Statistic tests U test, Wilks test
(Adaptation after Dăneţiu, T. – Multivariate methods used in computer aided marketing data
analysis - doctoral dissertation and Malhorta, N. - Études marketing avec SPSS – 4e
édition, Ed. Pearson Education France , Paris, 2004, p. 477 - 478)
Discriminant analysis is less used in marketing data analysis, however discriminant analysis has a wide applicability in carrying out classifications in the area of market segmentations and in predicting non-metric marketing variables, and are able to successfully comply with problems related to:
• What are the differencies between life styles of marketing directors in the banking area and that of information technology?
• What are those characteristics that distinguish the subscribers to a car newsletter?
• Are there differencies between market shares concerning the habits of using media?
• What are psychographic
features useful to distinguish the hypermarket customers according to price sensitivity?
• How are the loyal customers of a shop distinguished as regards the socio-demographic issue?
• Are there differencies between categories of a movie rent firm’s customers as regards the car brand or the phone type they have?
• What are the severalties of consumers that reply to advertising e-mails?
• In terms of life style, what are the differences between hypermarket customers and those of discount shops?
• Are various customers different in their media consumption habits?
• What are the psychographic differencies that help distinguish buyers of price sensitive products and those who are not?
This method is most often used for
this case, the discriminant analysis helps formulate the discrimination rule using the history of bank’s customers and at the same time provides a measure of evaluation related to a wrong decision risk.
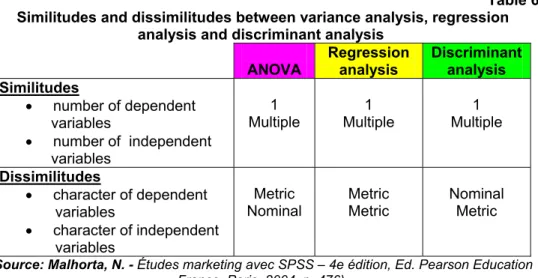
At the end of presenting this method, we are emphasizing –
according to N. Malhotra in the quoted paper – the relation (similitude and dissimilitude, respectively) between discriminant analysis, regression analysis and variance analysis (table no. 6).
Table 6 Similitudes and dissimilitudes between variance analysis, regression
analysis and discriminant analysis
ANOVA
Regression analysis
Discriminant analysis Similitudes
• number of dependent variables
• number of independent variables
1 Multiple
1 Multiple
1 Multiple
Dissimilitudes
• character of dependent variables
• character of independent variables
Metric Nominal
Metric Metric
Nominal Metric
(Source: Malhorta, N. - Études marketing avec SPSS – 4e édition, Ed. Pearson Education France, Paris, 2004, p. 476)
Segmentation
The promoter of this method is Smith (1956) however, we should also mention Kotler’s major contribution, in 1967, when he used segmentation as geographical segmentation that does not require any other typical technical solution of grouping attitudes, personalities or life style. Until being mainly used in the area of marketing, segmentation has been used widely in areas such as botany, archaeology, geology etc. where grouping of area related elements in homogenous families, of types of elements.
Smith – quoted by Smajda – in his innovative article published in 1956 described market segmentation as a strategy emphasizing the accuracy of which a firm’s products are able to meet the requirements of one or several various market shares. Therefore, he assumed that market was not an anonymous and uniform mass of consumers and it was possible to find the groups of consumers different
among them both as regards behaviour and their needs and requirements. Eight years later, Yankelovitch, in 1964, extended this definition and described it as ”systematic understanding that enables the marketing research selection of market shares that are more important strategically, and to place products, packaging and marketing communication strategies around these market shares. It considerably simplifies the goal setting”.
The variable explained in segmentation can be either qualitative, and quantitive, but explanatory variables are always qualitative. As a procedure, segmentation assumes regrouping of contingency table columns. The contingency table is related to the Xk variable in two
segments (or categories) so as individuals belonging to these two categories are as different as possible.
always preceded by research of segmentation modules), general variables and variables related to the product or the service surveyed, respectively and can be:
• Geographical variables, based on assumption that geographical position primarily influences the consumer, the main variables can be:
country, importance of city, population density, climate etc. This criterion is less and less used due to intensive migration of population;
• Socio-demographic variables:
age, gender, social class, income, house, education, religion, professional activity, civil status etc.;
• Behaviour variables: buying frequency, consumption frequency, brands purchased in a certain range of
products, easiness of using the product etc.;
• Attitude related variables; • Personality variables: anxiety, narcissism, obsessions, introversion etc.;
• Segmentation based on life styles, used for the first time in USA by Plumer in 1974, considered an innovative idea at that time;
• Segmentation based on product advantages;
• Segmentation by product positioning.
Stages covered by the segmentation process are illustrated in figure no. 4.
Figure no. 4 – Stages of segmentation process
(Adaptation after Spircu, L. Calciu, M., Spircu, T. – Marketing data analysis, Ed. ALL,
Bucharest, 1994, p.175)
The final results of segmentation can be „visualized” easily by means of the graphical representation typical to this method, the segmentation tree
respectively, that provides a picture of initial population and how it was progressively proportioned in subpopulations as different as possible, each knot of the tree having a lower or a
higher percentage in total population. Most often two segmentation criteria
were used in segmentation, namely the Belsoncriterion and theχ2distance.
As an explanatory technique used for marketing data, it can be successfully applied to:
• Segmentation of readers of a daily paper according to geographical 1. Segmentation of each
”p” contingency table and selection, in relation to selected segmentation criterion, of that variable that accomplishes the best dichotomy.
2. For each of the two segments (p-1) contingency tables are elaborated according to the (p-1) predictor variabile remained and each of them is segmented. The predictor variable carrying out the best segmentation is selected in regard to the selected criterion.
3. Procedure for each segment and predictor variables unused yet.
region, political option, age, variable that should be explained being dichotomous: daily reader or occasional reader.
• Identification, for instance, of a product consumers starting from a series of qualitative characteristics such as gender, age, socio-professional category, average income etc.
In the end, we may state that, the basic assumption in segmentation is that, a product market consists of groups of consumers or segments that have different needs, interests, life styles. Segmentation is very important as the results of this method are used for decisions related to differentiation strategies.
Conclusions
In marketing, when prediction or understanding of causal nexus between certain marketing variables is targeted, using of explanatory methods of data analysis is recommended. Either is about sales or market shares, of product and service evaluations, of satisfaction degree or buying intentions, the one who will take the marketing decisions will be directly interested in the analysis of those variables that can explain these results and implicitly find out what is the nature of relation between the surveyed variables.
In marketing research, these methods push forward the major rise of amount as regards the relevant and useful information that can be selected from information sources used for research. The explanatory methods of data analysis comply with some major issues in marketing, that are connected either to market segmentation, or accomplishment of marketing predictions, either to analyse relations – and implicitly their intensity – between the surveyed variables.
In certain cases, according to Dăneţiu, such as business – to – business marketing or niche marketing, the segmentation methods are, the only way to get information for statistically relevant segments.
The variance analysis can be applied, in case of marketing studies in the following cases:
• marketing experiments
wherein individuals are distributed randomly on types of treatments (independent variables),
• comparative studies whose goal is to notice the differencies between naturally built populations,
• pre-test-post-test type analysis – of effects related to some advertisements,
• Longitudinal studies
wherein data is collected by applying the same scale on the same sample,
• Samplings aiming to
describe the differencies between responses of individuals distributed on subsamples of the same population.
By covariance analysis effects of uncontrolled variable variations diminish from environment of the issue to survey as well as variations from typical, inherent, non-random differencies of elements to be analysed, experimental treatment respectively.
REFERENCES
Aaker, D. A., Kumar, V., Day G. S. (1998), Marketing research – sixth edition, New York, Ed. John Wiley & Sons, p. 559.
Baron, T., Biji, E., Tövisi, L.Wagner, P., Isaic-Maniu, Al., Korka, M., Porojan, D. (1996), Theoretical and economic statistics, Bucharest, Editura Didactică şi Pedagogică, p. 162 – 163.
Colibabă, D. (2000), Advanced market research methods, Ed. ASE, Bucharest, 2000, p. 69, 71 – 72.
Dăneţiu, T. (2005), Multivariate methods used in computer aided marketing data analysis - doctoral dissertation, Bucharest, p. 6.
Demetrescu, M.C., Drăgan, J.C. (1996), Market research practice – marketing research techniques, Bucharest, Ed. Europa Nova, p. 197, 206 – 207.
Gabor, M. R. (2008), Regression analysis as analysis method, Economia XXI magazineno. 4 (22), Iaşi, pp. 32 – 36.
Gabor M. R. (2009) „Data analysis - evolution approach”, Analele Universităţii din Oradea. Seria Ştiinţe Economice – tom XVIII, vol. IV, p. 676 – 680.
Gabor M. R. (2009) „Statistics tests used in data analisys”, Management şi Inginerie Economică editată de AMIER Cluj, Volum 6 / nr. 3 / 2009, p. 185 – 194. Giannelloni, J. L., Vernette, E. (2001), Etudes de marche – 2e edition, Ed. Vuibert,
p. 416.
Malhorta, N. (2004), Études marketing avec SPSS – 4e édition, Paris, Ed. Pearson Education France, p. 389 – 390, 394- 395, 405, 476 – 478.
Novak, A. (2004), Statistics and sampling, Bucharest, Ed. Universitară, p. 109.
Smajda, A. (1988), Segmenter ses marches – applications pratique de technique de segmentation dans le marketing, Ed. PPR, p. 21, 28 30.
Spircu, L., (2008), Data analysis. Economic applications –course notes, Academy of Economic Science, Bucharest, www.ase.ro/bibliotecadigitala .