Structural and vibrational study of cubic Sb2O3
under high pressure
A. L. J. Pereira,1,2,* L. Gracia,2D. Santamar´ıa-P´erez,3R. Vilaplana,4F. J. Manj´on,5D. Errandonea,6M. Nalin,7and A. Beltr´an2
1S˜ao Paulo State University–UNESP, Advanced Materials Group, Bauru (Brazil)
2Departament de Qu´ımica F´ısica i Anal´ıtica, MALTA Consolider Team, Universitat Jaume I, 12071 Castell´o, Spain
3Departamento de Qu´ımica F´ısica I, Facultad de Ciencias Qu´ımicas, Universidad Complutense de Madrid, Madrid, Spain
4Centro de Tecnolog´ıas F´ısicas, MALTA Consolider Team, Universitat Polit`ecnica de Val`encia, Cam´ı de Vera s/n, 46022 Val`encia, Spain
5Instituto de Dise˜no para la Fabricaci´on y Producci´on Automatizada, MALTA Consolider Team, Universitat Polit`ecnica de Val`encia,
Cam´ı de Vera s/n, 46022 Val`encia, Spain
6Departamento de F´ısica Aplicada–ICMUV, Universidad de Valencia, Edificio de Investigaci´on, C/Dr. Moliner 50,
46100 Burjassot, Valencia, Spain
7Departamento de Qu´ımica, LAVIE, Universidade Federal de S˜ao Carlos, S˜ao Carlos, Brazil
(Received 12 November 2011; revised manuscript received 12 April 2012; published 18 May 2012)
We report an experimental and theoretical study of antimony oxide (Sb2O3) in its cubic phase (senarmontite)
under high pressure. X-ray diffraction and Raman scattering measurements up to 18 and 25 GPa, respectively, have been complemented withab initiototal-energy and lattice-dynamics calculations. X-ray diffraction measurements do not provide evidence of a space-group symmetry change in senarmontite up to 18 GPa. However, Raman scattering measurements evidence changes in the pressure coefficients of the Raman mode frequencies at 3.5 and 10 GPa, respectively. The behavior of the Raman modes with increasing pressure up to 25 GPa is fully reproduced by the lattice-dynamics calculations in cubic Sb2O3. Therefore, the combined analysis of both experiments and
lattice-dynamics calculations suggest the occurrence of two isostructural phase transformations at 3.5 and 10 GPa, respectively. Total-energy calculations show that the isostructural phase transformations occur through local atomic displacements in which senarmontite loses its molecular character to become a three-dimensional solid. In addition, our calculations provide evidence that cubic senarmontite cannot undergo a phase transition to orthorhombic valentinite at high pressure, and that a phase transition to aβ-Bi2O3-type structure is possible
above 25 GPa.
DOI:10.1103/PhysRevB.85.174108 PACS number(s): 62.50.−p, 71.20.Nr, 78.20.Bh, 78.40.Fy
I. INTRODUCTION
Antimony oxide (Sb2O3) is a sesquioxide of late group XV elements of the Periodic Table, like As2O3 and Bi2O3, with outstanding properties. It is used extensively in industry as a flame retardant in polymers, coatings, and textiles;1 as a catalyst in the production of polyethylene terephthalate, and polyester resins and fibers;2 to increase stability and
decrease wear of fluid lubricants;3 and in the manufacture
of semiconductors and glassy devices.4–6
Sesquioxides of late group XV elements have closely related structures with several polymorphic structures that are not clearly related to those of other sesquioxides, like those of group XIII, group III, and rare earths. In fact, the structures of sesquioxides of late group XV elements are far from those of sesquioxides of simple metals and can be understood on the basis of five array models of the defective fluorite structure. In these sesquioxides, the presence of a lone electron pair in the metal atom plays a central role in determining the local atomic arrangement, as has been recently shown by theoretical calculations.7
The solid phases of Sb2O3include an amorphous (glassy) and three crystalline structures, senarmontite (α-Sb2O3), valentinite (β-Sb2O3), and a very recently found new phase (γ-Sb2O3). Senarmontite is a cubic “molecular” crystal composed of spherical-top Sb4O6 “dimers” that forms an adamantanoid cage withTd symmetry and is the predominant
form below 570◦C.5,8–10Valentinite has an orthorhombic unit
cell, consisting of chains of four-membered rings formed by
SbO3pyramids, and is the predominant form above 570◦C.11 Finally,γ-Sb2O3is an orthorhombic metastable phase recently obtained after a high-pressure and high-temperature treatment of both senarmontite and valentinite.12 The structure of
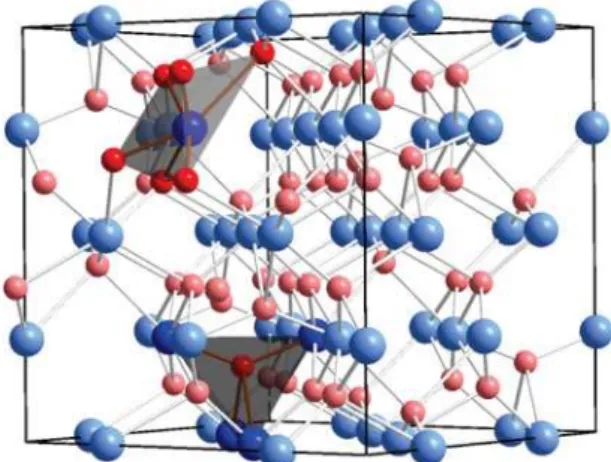
senarmontite at ambient pressure is shown in Fig. 1 and it is also found in arsenolite (cubic As2O3) and in δ-Bi2O3 (cubic Bi2O3). It can be observed that in senarmontite the coordination of Sb is three, while coordination of O is two. The adamantoid structure can be seen as Sb linked to other three Sb by three O atoms in a tetrahedral configuration where one bond is lost due to the presence of a pair of nonbonding electrons in Sb. These adamantoid cages are held together by van der Waals forces to give the molecular solid.
A few high-pressure studies have been reported in sesquiox-ides of late group XV elements. In particular, there are studies of As2O3,13,14 Bi2O3,15,16 and β-Sb2O3.17 These works show that while arsenolite and monoclinic α-Bi2O3 undergo a crystalline-to-amorphous transition above 15 and 20 GPa, respectively, claudetite (orthorhombic As2O3) remains crystalline to 40 GPa, and a solid-solid phase transition seems to be present near 8 GPa in valentinite. These studies have shown the complex nature of the phase transitions in these sesquioxides and the need to study the pressure-induced phase transitions in other polymorphic phases of these compounds in order to better understand their similarities and differences with respect to other sesquioxides.18
FIG. 1. (Color online) Structure of senarmontite at ambient pressure. Sb atoms are big blue balls, while O atoms are small red balls. It is composed of molecular Sb4O6 units (see darker atoms
and bond) linked by van der Waals forces. Note that Sb and O have threefold and twofold coordination, respectively.
(XRD) and Raman measurements which are complemented with total-energy and lattice-dynamics calculations in the framework of density-functional theory (DFT). We will show that, unlike arsenolite, senarmontite remains in the cubic structure up to 25 GPa and that it suffers two isostructural phase transitions at 3.5 and 10 GPa, respectively, in which senarmontite loses its molecular character to become a three-dimensional solid.
II. EXPERIMENTAL DETAILS
The cubic Sb2O3samples used in this work were purchased from Aldrich with grade purity higher than 99% (code 11115). XRD and Raman scattering measurements were performed both at ambient and at high pressures. For both types of high-pressure experiments a mixture of methanol and ethanol with a 4:1 ratio was used as pressure medium and ruby chips evenly distributed in the pressure chamber were used to measure the pressure by the fluorescence method.19
Angle-dispersive XRD measurements on Sb2O3were car-ried out with an Xcalibur diffractometer (Oxford Diffraction Limited). X-ray diffraction patterns were obtained on a 135 mm Atlas CCD detector placed at 110 mm from the sample using Kα1:Kα2 molybdenum radiation (0.7093 and 0.7136 ˚A, respectively). The X-ray beam was collimated to a diameter of 300μm. High-pressure XRD measurements on Sb2O3 powder were performed up to 18 GPa in a modified Merrill-Bassett diamond anvil cell (DAC) allowing access to an angular range 4θ=50◦
. The diamond anvils used have 500-μm diameter culets. The white Sb2O3powder was placed in the 150-μm-diameter holes of the stainless-steel gasket preindented to a thickness of 50 μm. Exposure times were typically of 1 h. The observed intensities were integrated as a function of 2θin order to give conventional, one-dimensional diffraction profiles. TheCRYSALISsoftware, version 171.34.49 (Oxford Diffraction Limited), was used for the data collections and the preliminary reduction of the data. The indexing and refinement of the powder diffraction patterns were performed using theFULLPROF20 andPOWDERCELL21program packages.
The same procedure was used previously to successfully study the high-pressure behavior of different oxides.22,23
Unpolarized room-temperature Raman scattering experi-ments in backscattering geometry were performed using a HeNe laser (6328 ˚A line) with a power below 5 mW in order not to burn the sample. The signal was collected by a Horiba Jobin Yvon LabRAM HR microspectrometer equipped with a thermoelectrically-cooled multichannel CCD detector and a spectral resolution better than 2 cm−1. High-pressure mea-surements up to 25 GPa were performed in a membrane-type DAC with diamond anvils having a 400-μm diameter culet.
III. THEORETICAL DETAILS
DFT calculations were performed with the CRYSTAL09 program package.24 Sb and O centers have been described
in the scheme of Gaussian basis sets25used in other previous
works26 and 6-31G∗, respectively. Becke’s three-parameter hybrid nonlocal exchange functional27combined with the
Lee-Yang-Parr gradient-corrected correlation functional, B3LYP,28
has been used. The standard B3LYP hybrid method has been extensively used for molecules and also provides an accurate description of crystalline structures as bond lengths, binding energies, and band-gap values are regarded.29,30 The diagonalization of the Fock matrix was performed at adequate
k−point grids in the reciprocal space (Pack-Monkhorst 1976) of shrinking parameters 4–6 depending on the phase being treated (8, 18, 27, and 27kpoints for sernamontite,β-Bi2O3 -type, γ-Sb2O3, and valentinite-type phases, respectively). The thresholds controlling the accuracy of the calculation of Coulomb and exchange integrals were set to 10−8 and 10−14 assuring a convergence in total energy better than 10−6a.u. in all cases. The percent of Fock/Kohn-Sham matrix mixing was set to 40.24 The empirical correction scheme to energy that considers the long-range dispersion contributions proposed by Grimme31 and implemented by B¨ucko et al.32 for periodic
systems was used in this work.
In order to take into account the effect of pressure on this system, we have optimized the geometrical parameters and the internal positions of all phases, at a number of fixed volumes (V), whereV0 is the equilibrium unit-cell volume. Then, the computed (E,V) pairs are used to calculate the pressure-volume data by minimizing the enthalpy with respect toV at selected values of pressure in the range 0–40 GPa. We have also generated values of the zero-pressure bulk modulus and its pressure derivative: B0 andB0′, by means of a numerical fitting procedure consistent with the Birch-Murnaghan33 equation of state (EOS). Vibrational-frequency
calculations inCRYSTALare performed at theŴpoint within the harmonic approximation, and the dynamical matrix has been computed. The band structures have been obtained along the appropriate high-symmetry paths of the Brillouin zone for the cubic and orthorhombic systems.
IV. RESULTS AND DISCUSSION
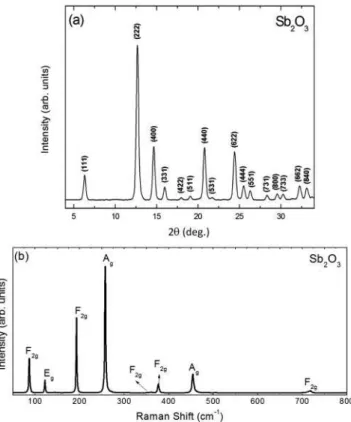
FIG. 2. (a) X-ray diffraction and (b) Raman scattering pattern of the Sb2O3powder measured at ambient conditions. Note that XRD
peaks at ambient pressure have been measured within a capillary tube and show larger widths than XRD peaks measured inside the DAC.
and Raman patterns obtained for Sb2O3at ambient pressure. The XRD pattern shows that the phase of Sb2O3 at ambient pressure is cubic (senarmontite), which belongs to the space group No. 227 (F d¯3m), where the Sb atom occupies a 32e
site with 3msymmetry and the O atom occupies a 48f site withmm2symmetry.10,34The observed diffraction peaks agree very well with the JCPDS data card No. 05-0534. Note that XRD peaks at ambient pressure have been measured within a capillary tube and show larger widths than XRD peaks measured inside the DAC (see Fig.3).
As regards lattice dynamics of Sb2O3, there are two formula units of Sb4O6in the primitive cell and therefore there are 60 normal modes of vibration whose symmetry is35
Ŵ60 =2A1g+2A1u+2Eu+2Eg+3F2u
+5F2g+5F1u+3F1g,
where the E modes are doubly degenerated and the F
modes are triply degenerated. There are nine Raman-active modes Ŵ = 2A1g + 2Eg + 5F2g, where one of them is a
translationalF2g mode and the rest are internal modes of the
adamantoid cage of cubic senarmontite derived from factor group analysis.13 Raman scattering measurements in Sb
2O3 at ambient pressure show that the most prominent Raman bands are at 84 cm−1 (translational-F
2g), 119 cm−1 (Eg),
190 cm−1(F
2g), 255 cm−1 (A1g), 357 cm−1 (F2g), 374 cm−1
(F2g), 451 cm−1 (A1g), and 715 cm−1 (F2g) in agreement
with the Raman modes previously reported for cubic Sb2O3 senarmontite.13,36,37 A small band at 141 cm−1 at ambient pressure indicates a residual portion of the valentinite phase
FIG. 3. Room-temperature x-ray diffraction patterns of senar-montite measured at different pressures.
not detected by XRD measurements. The positions of these peaks are listed in TableIfor comparison with the results of other works.
B. XRD measurements under pressure
Figure3shows the XRD patterns of Sb2O3with increasing pressure up to 18 GPa. The XRD patterns were only collected up to 18.9◦
because of the presence of the peaks associated to the gasket at higher angles. Four peaks of the cubic senarmontite structure could be measured within this angular range. XRD patterns at different pressures indicate that the cubic symmetry of Sb2O3remains unchanged up to the highest pressure attained. It can be also seen that all diffraction peaks markedly shift to larger diffraction angles as pressure increases. The measured lattice constant at ambient conditions isa =11.1466(8) ˚A, which yields a unit-cell volumeV0 = 1384.9(3) ˚A3. The experimental and theoretical pressure dependence of the volume in senarmontite is shown in Fig.4. TheP-Vdata are fitted using a third-order Birch-Murnaghan33 EOS to obtain the ambient pressure bulk modulusB0and its pressure derivativeB′
0. Good agreement is observed between the theoretical and experimental results reported in TableII. The fit of all data leads to an unusual large value forB′
TABLE I. Zero-pressure Raman frequencies and pressure coefficients in different pressure ranges in senarmontite.
Experimental Theoretical∂v/∂p Experimental∂v/∂p Calculated frequency (cm−1) (cm−1/GPa) (cm−1/GPa)
frequency This Mestlet al. 0–5 5–10 10–25 0–5 5–10 10—25
Symmetry (cm−1) work 38 GPa GPa GPa GPa GPa GPa Assignment
F2g 93 85 82 3.54 1.78 0.37 3.81 0.48 Translational mode
Eg 121 120 118 −0.50 0.06 0.44 −0.71 −0.18 0.29 Sb-O-Sb bend
F2g 196 191 189 3.14 3.14 3.14 3.18 3.18 3.18 Sb-O-Sb bend
Ag 263 255 254 0.46 0.82 1.53 −1.30 0.39 1.03 Sb-O-Sb stretch
Eg 335 −2.46 −2.46 0.83 Sb-O-Sb stretch
F2g 365 358 355 −0.23 −0.76 0.58 2.27 −0.71 0.10 Sb-O-Sb stretch
F2g 384 374 373 4.25 4.25 4.25 4.57 4.57 4.57 Sb-O-Sb stretch
Ag 473 452 450 2.49 2.49 2.49 2.59 2.59 2.59 Sb-O-Sb bend
F2g 709 715 712 2.07 1.50 2.75 −3.14 0.94 2.13 Sb-O-Sb stretch
the intermediate pressure range (3.5 GPa < P <10 GPa), and another EOS for the high-pressure range (P >10 GPa). The results of the EOS obtained in these three ranges are summarized in Table II. Fitting data with three EOS, we achieved more reasonable results for B′
0 with higher bulk modulus for the high-pressure phases above 3.5 and 10 GPa, respectively (see Table II). As we will show later, the three different regions of compressibility are a consequence of the transformation of Sb2O3from a solid with molecular character to a solid with more covalent character.
C. Raman scattering measurements under pressure Figure5shows the evolution of the Raman spectra as the sample is subjected to compression. From ambient pressure to 3.5 GPa it can be observed that the F2g modes, whose
frequencies were at 93, 196, 365, and 384 cm−1 at ambient pressure, and theA1g mode at 473 cm−1shift to higher wave
numbers, while theEg(120 cm−1),A1g (263 cm−1), andF2g
(709 cm−1) modes shift to lower wave numbers. A change in
FIG. 4. Equation of state for Sb2O3 senarmontite. The open
circles represent the theoretical data and the solid circles represent the experimental results. The lines overlaid on the circles are the Birch-Murnaghan equation of state fit of the data.
the pressure coefficients of many vibrational modes without any significant shift in frequency occur at 3.5 GPa. Above this pressure, the new pressure coefficients of the Raman modes remain basically similar till 10 GPa. However, above this pressure, a new change in the pressure coefficients of the Raman modes occurs and a strong luminescence background and four new weak vibrational modes appear (see Fig. 6). Note that the emerging peaks above 10 GPa are weak and they cannot be observed anymore above 21 GPa. The observed changes in the Raman spectra at 3.5 and 10 GPa suggest the occurrence of two phase transitions at these pressures. Furthermore, the top of Fig.5(b)shows the Raman spectrum when the pressure is removed after reaching 25 GPa. It has the same pattern as that of the starting material except for broader features, indicating the reversibility of the structural changes suffered by senarmontite in this pressure range.
Figure 7 shows the experimental Raman frequencies (symbols) as a function of pressure from 0 to 25 GPa. The assignment of the symmetries of the Raman modes, their frequencies, and pressure coefficients are presented in TableI. The pressures at which changes in the Raman spectra are observed are marked with red dashed vertical lines. As mentioned, at 3.5 GPa there are considerable changes in the pressure coefficients of the Raman-active modes. In particular, the Eg mode (120 cm−1) decreases the frequency pressure
coefficient from −0.71 cm−1/GPa to −0.18 cm−1/GPa,
TABLE II. E-V data fitted with three EOS: one for the data covering all the range from 0 to 18 GPa (all range), one for values withP <3.5 GPa (range 1), another for 3.5 GPa < P <10GPa (range 2), and another forP >10 GPa (range 3).
V0( ˚A3) B0(GPa) B0′
Exp. (all range) 1386(5) 16.5(2) 13.4(1) Theory (all range) 1420(4) 28(3) 12.4(1)
Exp. (range 1) 1380(4) 20(2) 9.4(2)
Theory (range 1) 1443(4) 21(3) 6.0(1)
Exp. (range 2) 1362(8) 25(2) 9.4(3)
Theory (range 2) 1416(9) 36(4) 7.1(1)
Exp. (range 3) 1351(6) 27(1) 9.4(3)
FIG. 5. Room-temperature Raman spectra of Sb2O3at different pressures: (a) ambient to 8 GPa; (b) 10–25 GPa. In (a) triangles and marks
indicate the experimental and theoretical (DFT) position of the Raman-active modes at ambient pressure, respectively. In (b) the top Raman spectrum is the measurement at atmospheric pressure after decompression from 25 GPa.
while the modes A1g (263 cm−1),F2g (365 cm−1), andF2g
(709 cm−1) change totally the sign of the pressure coefficient. The change of the pressure coefficients of all these vibrational modes indicates that some changes in the Sb-O bonds of the senarmontite structure must be taking place around 3.5 GPa, likely related to the occurrence of a phase transition without any significant change of volume since there is no shift of
the Raman mode frequencies at 3.5 GPa. This is in good agreement with the lack of volume change observed by XRD measurements at this pressure. On the other hand, a new change in the pressure coefficients of the Raman modes, without significant shift in frequencies, occurs at 10 GPa. TheEgmode,
initially at 120 cm−1, changes its pressure coefficient from −0.18 cm−1/GPa to 0.29 cm−1/GPa. Likewise, the modeF
2g
FIG. 7. (Color online) (a) Pressure dependence of Raman modes of Sb2O3 during compression from 0 to 25 GPa. Symbols represent
the experimental data and lines the calculation results. Open symbols represent new Raman bands which appear above 10 GPa. (b) Detailed pressure dependence of the Ag and Eg modes of Sb2O3 during
compression up to 25 GPa. Symbols represent the experimental data. Vertical red dashed lines mark the pressures at which the two isostructural transitions occur.
initially at 358 cm−1changes from −0.71 cm−1/GPa to 0.10 cm−1/GPa. Additionally, theA
1gandF2gsoft modes, initially
at 255 and 715 cm−1, respectively, that had changed the pressure coefficient at 3.5 GPa, show rather high and positive pressure coefficients above 10 GPa. Finally, the translational modeF2g(93 cm−1) merge with the modeEgaround 115 cm−1
near 10 GPa. All the changes at 10 GPa again indicate that a phase transition without a significant change in volume must be occurring at this pressure. Again, our Raman results around 10 GPa are in good agreement with the lack of volume change observed by XRD measurements at this pressure.
Figure7(b)shows the details of the changes of the Raman modesA1g andEg of Sb2O3 during compression from 0 to 25 GPa. Curiously, the softA1g andEg modes correspond to
symmetric and antisymmetric breathing modes of the Sb4O6 molecule, respectively. On the other hand, the other soft mode, withF2g symmetry, can be viewed as a stretching mode of
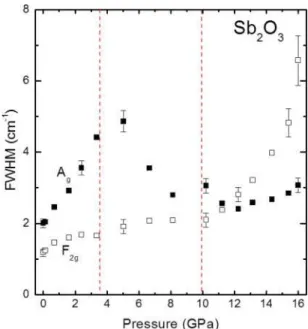
FIG. 8. (Color online) Full width at half maximum (FWHM) of the most intenseF2gandAgmodes as a function of pressure. Vertical
red dashed lines mark the pressures at which the two isostructural transitions occur.
the Sb4O6molecule where two opposite O and the Sb atoms remain at rest while the other four O atoms move enlarging one Sb-O bond and decreasing another Sb-O bond.36As can be observed clearly, the threeEg,A1g, andF2gmode frequencies
show clearly different pressure coefficients below and above 3.5 and 10 GPa thus suggesting structural changes in the senarmontite structure at those pressures. The pressure depen-dence of the Raman mode frequencies of these three modes cannot be described by a nonlinear function vs pressure and cannot be simply due to the extraordinary change of the van der Waals forces between the Sb4O6 molecules, since there are involved internal modes of the Sb4O6cage where van der Waals forces do not play any role.
In order to check if the changes observed in the Raman mode frequencies correlate with changes in the Raman linewidths, we have analyzed the full width at half maximum (FWHM) of several Raman-active modes. Figure8shows the FWHM of the two most intense Raman modes, which are the
F2g andA1g modes with frequencies near 191 and 255 cm−1
at ambient pressure. The peakF2gshows a slightly increasing
FWHM up to 10 GPa, and above this pressure there is a sudden increase of the FWHM. Unfortunately, above 16 GPa this peak merges with theA1g peak and it is difficult to determine the
FWHM accurately. On the other hand, the FWHM of the most intense peak (A1g) suffers a significant increase till 5 GPa.
However, its FWHM decreases quickly above this pressure and remains almost constant till 16 GPa when it merges with theF2gmode. Curiously, both modes have a FWHM that seems
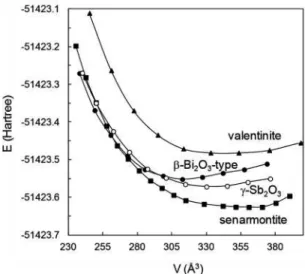
FIG. 9. Total energy as a function of volume for the senarmontite, valentinite,β-Bi2O3-like andγ-Sb2O3phases in Sb2O3. Claudetite-I
and claudetite-II forms are located at high-energy values.
We think there should be a correlation between the Raman changes observed and the compressibility changes detected above 5 GPa by XRD measurements. The changes of the pressure coefficients in the range up to 10 GPa are rather striking since several Raman modes exhibiting rather high negative pressure coefficients at zero pressure clearly show high positive pressure coefficients above 10 GPa. Another interesting thing is that the merge of phonons that occur above 10 GPa is totally consistent with the fact that the sample becomes more symmetric from 5 GPa on.
In order to explain the changes in the Raman spectrum and in the compressibility between 3.5 and 10 GPa we have explored theoretically four possible high-pressure phases of senarmontite. In this sense we simulated and compared the structures of valentinite (Sb2O3, orthorhombic), claudetite-I and claudetite-claudetite-Iclaudetite-I (As2O3, monoclinic),38 and β-Bi2O3 (tetragonal).39 The results of these calculations show that in
the range of pressures used in this work, cubic Sb2O3 does not undergo a phase transition to these structures in good agreement with XRD data. Figure 9 shows the total energy vs volume for the senarmontite, valentinite, β-Bi2O3-like, andγ-Sb2O3phases in Sb2O3. Claudetite-I and claudetite-II structures are located at rather high-energy values and they are not plotted in Fig.9. An analysis of this figure shows that senarmontite could undergo a phase transition to tetragonal
β-Bi2O3, but only above 25 GPa; i.e., outside our range of pressures of interest. Calculations of the tetragonal structure of β-Bi2O3 provided 34 different vibrational modes that are active in Raman, 7B1+15Eg+7A1g+5B1g. Of these modes,
eight vibrational modes have frequencies comparable with those of senarmontite. However, the other 26 Raman modes have not been observed in our Raman spectra up to 25 GPa. Similarly, a very high number of vibrational modes, not observed in our Raman spectra, characterize theγ-Sb2O3 phase. Therefore, our calculations give support to the absence of symmetry change in the changes observed in the Raman spectra between 0 and 25 GPa.
Since no high-pressure phase transition is expected below 25 GPa, we have tried to understand the pressure behavior
of the vibrational modes of senarmontite by performing lattice-dynamics calculations of senarmontite till 25 GPa. The theoretical Raman mode frequencies and their pressure dependences from 0 to 25 GPa are depicted in Fig.7 (solid lines). They are also summarized in TableI. As can be observed in this figure, the calculated modes of senarmontite are in rather good agreement with the experimental results. Only the Raman-activeEgmode, theoretically predicted near 335 cm−1,
was not observed experimentally. All pressure dependences of the Raman mode frequencies are well reproduced by calcula-tions with the exception of some modes at low pressures, such as the lowest-frequencyA1gmode and the highest-frequency
F2gmode of senarmontite. Curiously, both are soft modes; i.e.,
they exhibit a negative pressure coefficient. The discrepancy between experimental and calculated pressure coefficients at low pressures can be understood by the molecular character of senarmontite at low pressures and the difficulty of DFT calculations to deal with molecular solids with van der Waals interactions. Note that DFT calculations reproduce well the pressure dependence of all modes above 3.5 GPa once senar-montite acquires a more covalent character. Due to the rela-tively good agreement between experimental and theoretical calculations we will now proceed to see if there are structural changes in cubic senarmontite that could help in explaining the changes observed in the compressibility and the vibrational properties of senarmontite at different pressures up to 25 GPa.
D. Structural and electronic changes under pressure At ambient pressure the structure of senarmontite is basically composed by molecular units Sb4O6(those that exist in gaseous phase). These units let gaps among themselves and they are weakly bonded (it resembles a structure laminated with strong internal links and weak external links). This can be seen in Fig.1, where each Sb atom is bonded to three O atoms and each O atom is bonded to two Sb atoms, being the intramolecular Sb-O bond distances close to 2 ˚A [see squares in Fig. 10(a)]. The tetrahedral arrangement of Sb atoms is completed with the unshared valence electrons (lone pair of electrons). In addition, there are three O atoms from other molecules whose distance to Sb atoms is approximately 2.9 ˚A. These intermolecular distances are plotted as circles in Fig.10(a).
The nature of bonding and relative bond strengths in the packing arrangement of Sb4O6 molecules of senarmontite was topologically analyzed by Whitten et al. at ambient pressure, verifying the existence of the weak intermolecular bonds.37 As a result of this type of porous structure, the
FIG. 10. (Color online) (a) Calculated internal (squares) and external (circles) Sb-O distances of the Sb4O6 cage as a function
of pressure. (b) Calculated atomic coordinatexof Sb (squares) andx of O (circles). Vertical red dashed lines mark the pressures at which the two isostructural transitions occur.
distance decreases, while the short intramolecular Sb-O bond distance is almost constant. From 3.5 to 12 GPa the atomic positions tend to increase with a smaller slope, and the large intermolecular Sb-O distance decreases considerably. Also an appreciated decrease of the intramolecular Sb-O bond distance occurs in this pressure range. Finally, above 12 GPa the atomic positions change with a much smaller rate than at lower pressures and the same occurs to the intermolecular Sb-O distance. However, the intramolecular Sb-O distances decrease in a larger rate above 12 GPa. Therefore, our calculations would agree with the existence of two isostructural phase
FIG. 11. (Color online) Structure of senarmontite at 15 GPa. Sb atoms are big blue balls, while O atoms are small red balls. It is composed of SbO6 octahedra where Sb and O have 6 and 4
coordination, respectively.
transitions occurring in cubic Sb2O3at 3.5 and 12 GPa inferred from the changes observed in the Raman spectrum at 3.5 and 10 GPa. In the following we will show that the above structural changes allow us to explain the observed behavior of senarmontite up to 25 GPa.
There is a large decrease of the intermolecular Sb-O distance up to 3.5 GPa and a rather small decrease of this distance from 12 to 24 GPa. Note that at 12 GPa the intermolecular bond distance is reduced by 7.4%. This means that above this pressure, the intermolecular Sb-O bonds stop being negligible (compared with intramolecular bonds) and consequently there is a smaller change in the atomic positions and the decrease of both Sb-O bond distances is more similar. Thus, our calculations show that the molecular compound tends to become a classic covalent solid above 12 GPa. Figure11shows the senarmontite structure at 20 GPa where Sb atoms are disposed in an octahedral coordination forming distorted SbO6units. The hollow sites almost disappear from the structure and the compound without changing its symmetry is restructured so that it ceases to be a molecular compound resembling a pyrochlore and it acquires a classic covalent solid character composed of SbO6octahedra.
Another interesting feature which supports the isostructural transition taking place in senarmontite is given by the relative intensities of the weak diffraction peaks (111) and (331) with respect of the two most intense peaks (222) and (400). Simulations of XRD patterns with the calculated positions at different pressures show a decrease in intensity of the (111) and (331) peaks with respect to the most intense peaks. This result is in good agreement with the XRD experimental patterns of Fig.3where the (111) and (331) peaks have almost disappeared at 17.9 Gpa, while the (222) and (400) peaks are clearly present.
FIG. 12. (Color online) Total charge density projected on the plane containing three Sb bridge atoms bonded to three O of Sb4O6
units, (a) at 0.0 GPa, (b) at 9.0 Gpa, and (c) at 24.5 GPa.
bonds start being formed on compression above 3.5 GPa. A clear view of the pressure-induced isostructural transitions taking place in senarmontite can be observed in Fig.12where the electronic charge density contours are depicted at 0.0, 9.0, and 24.5 GPa. The contour plots reflect the pass from molecular isolated Sb4O6units [Fig.12(a)] to a more compacted structure with SbO6units [Fig.12(c)] in which the O atoms become a bridge between two Sb4O6 units [Fig.12(b)]. The formation of these new bonds is associated to a reduction of empty sites between molecules. Note the change of coordination of Sb from 3 to 6 and of O from 2 to 4 on increasing pressure (see Figs.1and11).
As regards Raman changes above 3.5 GPa, we have measured slightly increasing values of the Raman frequencies between 3.5 and 10 GPa and much larger positive pressure coefficients above 10 GPa. These behaviors can be explained by the small reduction of the calculated intramolecular Sb-O distances between 3.5 and 12 GPa, and the larger reduction of the calculated intramolecular Sb-O bond distances above 12 GPa. Therefore, our Raman measurements and calculations are consistent with the existence of two isostructural phase transitions near 3.5 and 10–12 GPa.
To reinforce the idea that two pressure-induced isostructural transitions occur in senarmonite, we have calculated the nor-malized enthalpy at different pressures for three isostructural
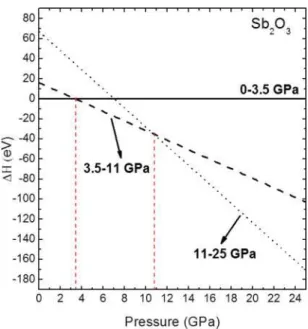
FIG. 13. (Color online) Different linear behavior of enthalpy variation in senarmontite at some ranges of pressures, according to DFT calculations.
phases. The difference between each phase is the evolution of atomic positions which are forced to follow in the whole pressure range the pressure evolution found for each of the three different pressure ranges that we report in Fig. 10: 0–3.5 GPa (phase I), 3.5–11 GPa (phase II), 11–25 GPa (phase III). The obtained results are shown in Fig.13, where the I-II-III structural sequence confirms that senarmontite undergoes two isostructural phase transitions up to 25 GPa.
FIG. 14. (Color online) Density of states projected on atoms and orbitals for senarmontite (a) at ambient pressure and (b) at 20 GPa.
pressure acquiring the system a more semiconductor character with a band-gap energy of 3.9 eV at 15 GPa.
Finally, we want to mention that pressure-induced isostruc-tural phase transformations are relatively exotic phenomena, in many cases related to a change in the electronic structure. They have been reported for a few elements, such as Ce (a well-known example of the isostructural transition),40 Zr,41
Os,42 and recently B.43In some cases, the isostructural phase transition is related to compounds containing elements with a variable chemical valence due to fully or partially freed -and/or f-electronic shells (for example, SmS,44 EuCo
2P2,45 rare-earth chalcogenides46 and pnictides,47 and/or materials
which undergo magnetic or spin transitions, e.g., MnO (Ref.48) or YCo5.49Finally, we could mention the case of the topological insulators Bi2Te3,50,51 Bi2Se3,52and Sb2Te3,53–55 where a pressure-induced isostructural phase transition seems to be related to an electronic topological transition driven by the distortion of the electronic band structure near the Fermi surface resulting in a topological van Hove singularity crossing the Fermi level. Similarly, recent theoretical calculations predict a first-order isostructural transformation in PdN2driven by a phase transition of the electronic structure, which is manifested by a discontinuous change in the hybridization between Pdd and Npelectrons as well as a conversion from single to triple bonded nitrogen dimmers.56 It is noteworthy that senarmontite undergoes two consecutive isostructural phase transitions. Furthermore, it is strange that arsenolite (α-As2O3), having the same structure as senarmontite, does not undergo similar pressure-induced phase transitions. As already
mentioned, arsenolite has been recently studied and a solid-to-amorphous phase transition has been observed near 15 GPa, followed by an amorphous-to-amorphous phase transition near 25 GPa. In fact, no anomaly in the behavior of the Raman modes was observed.14 The other compound isostructural to
senarmontite isδ-Bi2O3but its behavior under pressure is still unknown. However, Jovalekicet al.55compared the Bi-O bond
distances in the BiO6polyhedra for different structural Bi2O3 phases. The increase in coordination when going fromδ-Bi2O3 toβ-Bi2O3is in good agreement with our calculations, which point to an increase in coordination if cubic Sb2O3undergoes a phase transition to theβ-Bi2O3structure. In this sense, we can consider that the two isostructural phase transitions without symmetry change indeed prepare the SbO6 arrangement to achieve the tetragonalβ-Bi2O3-type structure above 25 GPa.
V. CONCLUSIONS
In this work we present a structural and vibrational study of senarmontite up to 25 GPa by means of XRD and Raman measurements which are complemented with DFT-based total-energy and lattice-dynamicsab initiocalculations. We have observed striking changes of the pressure coefficients of the Raman-active modes around 3.5 and 10 GPa. However, XRD measurements evidence no change in the cubic symmetry of the compound up to 18 GPa but just a significant change in compressibility with increasing pressure, without a change in volume. All these features have been understood thanks to theoretical calculations which show that senarmontite under-goes two isostructural phase transitions that lead senarmontite from a low-density phase to a high-density phase above 10–12 GPa. In the isostructural phase transitions senarmontite loses its molecular character, with van der Waals interactions between the adamantoid Sb4O6molecules, to become a three-dimensional covalent solid. This transformation is related to changes in hybridization between Sb 5s and O 2pelectrons resulting in considerable changes of the mechanical, vibra-tional, and electronic properties. Furthermore, our calculations suggest that senarmontite does not undergo a pressure-induced phase transition at room temperature either to valentinite, or to the monoclinic structures of As2O3 (claudetite-I and claudetite-II), or to the recently found γ-Sb2O3 phase, but it could undergo a phase transition to tetragonal β-Bi2O3 above 25 GPa despite Raman measurements having shown no evidence for this transition up to 25 GPa..
ACKNOWLEDGMENTS
*Corresponding author: [email protected]
1S. Boryniec and W. Przygocki, Prog. Rub. Plast. Tech.17, 59 (2001). 2J. H. Youk, R. P. Kambour, and W. J. MacKnight,Macromolecules
33, 3594 (2000).
3J. S. Zabinski, M. S. Donley, and N. T. McDevitt,Wear165, 103
(1993).
4A. Ghosh and D. Chakravorty,J. Phys.: Condens. Matter3, 3335
(1991).
5P. S. Gopalakrishnan and H. Manohar,J. Solid State Chem.15, 61
(1975).
6W. H. Zachariasen,J. Am. Chem. Soc.54, 3841 (1932).
7A. Matsumoto, Y. Koyama, A. Togo, M. Choi, and I. Tanaka,Phys.
Rev. B83, 214110 (2011).
8P. J. Miller and C. A. Cody,Spectrochim. Acta, Part A 38, 555
(1982).
9C. Svensson,Acta Crystallogr. Sect. B: Struct. Sci.31, 2016 (1975). 10C. Wood, B. Vanpelt, and A. Dwight,Phys. Status Solidi B54, 701
(1972).
11M. Nalin, Y. Messaddeq, S. J. L. Ribeiro, M. Poulain, V. Briois,
G. Brunklaus, C. Rosenhalm, B. D. Mosel, and H. Eckert,J. Mater. Chem.14, 3398 (2004).
12D. Orosel, R. E. Dinnebier, V. A. Blatov, and M. Jansen,Acta.
Crystallogr., Struct. Sci.: Sect. B68, 1 (2012).
13A. Grzechnik,J. Solid State Chem.144, 416 (1999).
14E. Soignard, S. A. Amin, Q. Mei, C. J. Benmore, and J. L. Yarger,
Phys. Rev. B77, 144113 (2008).
15C. Chouinard and S. Desgreniers,Solid State Commun.113, 125
(1999).
16S. A. Ghedia, Ph.D. Thesis, Universit¨at Stuttgart, 2010
(unpub-lished).
17A. Geng, L. Cao, C. Wan, and Y. Ma,Phys. Status Solidi C8, 1708
(2011).
18F. J. Manjon and D. Errandonea,Phys. Status Solidi B246, 9 (2009). 19H. K. Mao, J. Xu, and P. M. Bell,J. Geophys. Res.91, 4673 (1986). 20J. Rodr´ıguez-Carvajal,Physica B192, 55 (1993).
21G. Nolze and W. Kraus, Powder Diffr.13, 256 (1998).
22D. Errandonea, D. Santamaria-Perez, T. Bondarenko, and
O. Khyzhun,Mater. Res. Bull.45, 1732 (2010).
23D. Errandonea, D. Santamaria-Perez, S. N. Achary, A. K. Tyagi,
P. Gall, and P. Gougeon,J. Appl. Phys.109, 043510 (2011).
24R. Dovesi, V. R. Saunders, C. Roetti, R. Orlando, C. M.
Zicovich-Wilson, F. Pascale, B. Civalleri, K. Doll, N. M. Harrison, I. J. Bush, P. D’Arco, and M. Llunell,CRYSTAL09program (2009).
25See [http://www.tcm.phy.cam.ac.uk/∼mdt26/basis_sets/Sb_basis.
txt].
26D. G. Stroppa, L. A. Montoro, A. Beltran, T. G. Conti, R. O. da
Silva, J. Andres, E. Longo, E. R. Leite, and A. J. Ramirez,J. Am. Chem. Soc.131, 14544 (2009).
27A. D. Becke,J. Chem. Phys.98, 5648 (1993).
28C. T. Lee, W. T. Yang, and R. G. Parr,Phys. Rev. B37, 785 (1988). 29C.-H. Hu and D. P. Chong, Encyclopedia of Computational
Chemistry(Wiley, Chichester, 1998).
30L. Gracia, A. Beltran, and J. Andres,J. Phys. Chem. B110, 23417
(2006).
31S. Grimme,J. Comput. Chem.27, 1787 (2006).
32T. Bucko, J. Hafner, S. Lebegue, and J. G. Angyan,J. Phys. Chem.
A114, 11814 (2010).
33F. Birch,J. Geophys. Res.57, 227 (1952).
34A. E. Whitten, B. Dittrich, M. A. Spackman, P. Turner, and T. C.
Brown,Dalton Trans.1, 23 (2004).
35E. Kroumova, M. I. Aroyo, J. M. Perez-Mato, A. Kirov, C. Capillas,
S. Ivantchev, and H. Wondratschek, Phase Transitions 76, 155 (2003).
36C. A. Cody, L. Dicarlo, and R. K. Darlington,Inorg. Chem.18,
1572 (1979).
37S. J. Gilliam, J. O. Jensen, A. Banerjee, D. Zeroka, S. J.
Kirkby, and C. N. Merrow, Spectrochim. Acta, Part A60, 425 (2004).
38G. Mestl, P. Ruiz, B. Delmon, and H. Knozinger,J. Phys. Chem. 98, 11276 (1994).
39S. K. Blower and C. Greaves,Acta Crystallogr., Sect C: Crystal
Struct. Commun.44, 587 (1988).
40B. Johansson and S. Li,Philos. Mag.89, 1793 (2009).
41Y. Akahama, M. Kobayashi, and H. Kawamura,J. Phys. Soc. Jpn. 60, 3211 (1991).
42F. Occelli, D. L. Farber, J. Badro, C. M. Aracne, D. M. Teter,
M. Hanfland, B. Canny, and B. Couzinet, Phys. Rev. Lett. 93, 095502 (2004).
43E. Zarechnaya, N. Dubrovinskaia, R. Caracas, M. Merlini,
M. Hanfland, Y. Filinchuk, D. Chernyshov, V. Dmitriev, and L. Dubrovinsky,Phys. Rev. B82, 184111 (2010).
44A. Chatterj and A. K. Singh,Phys. Rev. B6, 2285 (1972). 45M. Chefki, M. M. Abd-Elmeguid, H. Micklitz, C. Huhnt,
W. Schlabitz, M. Reehuis, and W. Jeitschko,Phys. Rev. Lett.80, 802 (1998).
46R. Caracas and X. Gonze,Phys. Rev. B69, 144114 (2004). 47A. Svane, P. Strange, W. M. Temmerman, Z. Szotek, H. Winter, and
L. Petit,Phys. Status Solidi B223, 105 (2001).
48C. S. Yoo, B. Maddox, J. H. P. Klepeis, V. Iota, W. Evans,
A. McMahan, M. Y. Hu, P. Chow, M. Somayazulu, D. Hausermann, R. T. Scalettar, and W. E. Pickett, Phys. Rev. Lett.94, 115502 (2005).
49H. Rosner, D. Koudela, U. Schwarz, A. Handstein, M. Hanfland,
I. Opahle, K. Koepernik, M. D. Kuz’min, K. H. Muller, J. A. Mydosh, and M. Richter,Nat. Phys.2, 469 (2006).
50A. Polian, M. Gauthier, S. M. Souza, D. M. Triches, J. Cardoso de
Lima, and T. A. Grandi,Phys. Rev. B83, 113106 (2011).
51R. Vilaplana, O. Gomis, F. J. Manjon, A. Segura, E. Perez-Gonzalez,
P. Rodriguez-Hernandez, A. Munoz, J. Gonzalez, V. Marin-Borras, V. Munoz-Sanjose, C. Drasar, and V. Kucek, Phys. Rev. B 84, 104112 (2011).
52R. Vilaplana, D. Santamar´ıa-P´erez, O. Gomis, F. J. Manj´on,
J. Gonz´alez, A. Segura, A. Mu˜noz, P. Rodr´ıguez-Hern´andez, E. P´erez-Gonz´alez, V. Mar´ın-Borr´as, V. Mu˜noz-Sanjose, C. Drasar, and V. Kucek,Phys. Rev. B84, 184110 (2011).
53N. Sakai, T. Kajiwara, K. Takemura, S. Minomura, and Y. Fujii,
Solid State Commun.40, 1045 (1981).
54M. K. Jacobsen, R. S. Kumar, A. L. Cornelius, S. V. Sinogeiken and
M. F. Nicol, inShock Compression of Condensed Matter—2007, Pts 1 and 2, edited by M. Elert, M. D. Furnish, R. Chau, N. C. Holmes, and J. Nguyen (Springer Verlag, Berlin, 2007), Vol. 955, pp. 171–174.
55S. M. Souza, D. M. Trichˆes, C. M. Poffo, J. C. de Lima,
T. A. Grandi, and R. S. de Biasi,J. Appl. Phys.109, 013512 (2011).
56D. Aberg, P. Erhart, J. Crowhurst, J. M. Zaug, A. F. Goncharov, and