Phylogenetic utility of ribosomal genes for
reconstructing the phylogeny of five Chinese
satyrine tribes (Lepidoptera, Nymphalidae)
Mingsheng Yang1, Yalin Zhang1
1 Key Laboratory of Plant Protection Resources and Pest Management of Ministry of Education, Entomological Museum, Northwest A&F University, Yangling, Shaanxi 712100, China
Corresponding author: Yalin Zhang (yalinzh@nwsuaf.edu.cn)
Academic editor: C. Peña | Received 25 December 2014 | Accepted 5 March 2015 | Published 19 March 2015
http://zoobank.org/89CA4CCB-5244-465A-AEFC-335EAB338C66
Citation: Yang M, Zhang Y (2015) Phylogenetic utility of ribosomal genes for reconstructing the phylogeny of ive Chinese satyrine tribes (Lepidoptera, Nymphalidae). ZooKeys 488: 105–120. doi: 10.3897/zookeys.488.9171
Abstract
Satyrinae is one of twelve subfamilies of the butterly family Nymphalidae, which currently includes nine tribes. However, phylogenetic relationships among them remain largely unresolved, though diferent researches have been conducted based on both morphological and molecular data. However, ribosomal genes have never been used in tribe level phylogenetic analyses of Satyrinae. In this study we investigate for the irst time the phylogenetic relationships among the tribes Elymniini, Amathusiini, Zetherini and Melanitini which are indicated to be a monophyletic group, and the Satyrini, using two ribosomal genes (28s rDNA and 16s rDNA) and four protein-coding genes (EF-1α, COI, COII and Cytb). We mainly aim to assess the phylogenetic informativeness of the ribosomal genes as well as clarify the relationships among diferent tribes. Our results show the two ribosomal genes generally have the same high phylogenetic informativeness compared with EF-1α; and we infer the 28srDNA would show better informativeness if the 28srDNA sequence data for each sampling taxon are obtained in this study. he placement of the monotypic genus Callarge Leech in Zetherini is conirmed for the irst time based on molecular evidence. In addition, our maximum likelihood (ML) and Bayesian inference (BI) trees consistently show that the involved Satyrinae including the Amathusiini is monophyletic with high support values. Although the relationships among the ive tribes are identical among ML and BI analyses and are mostly strongly-sup-ported in BI analysis, those in ML analysis are lowly- or moderately- supstrongly-sup-ported. herefore, the relation-ships among the related ive tribes recovered herein need further veriication based on more sampling taxa.
Keywords
Butterly, molecular systematics, Bayesian inference, Satyrinae
http://zookeys.pensoft.net
Copyright Mingsheng Yang, Yalin Zhang. This is an open access article distributed under the terms of the Creative Commons Attribution License (CC BY 4.0), which permits unrestricted use, distribution, and reproduction in any medium, provided the original author and source are credited.
Mingsheng Yang & Yalin Zhang / ZooKeys 488: 105–120 (2015) 106
Introduction
he butterly subfamily Satyrinae, comprising approximately 2,500 described extant species, is amongst the most diverse groups in insects (Ackery et al. 1999). Recent-ly, Marín et al. (2011) summarized the indings of systematic studies on this group (Peña et al. 2006; Peña and Wahlberg 2008; Wahlberg et al. 2009), proposing that the Satyrinae could be divided into nine tribes. However, phylogenetic relationships among them remain mostly unresolved despite they are assigned to four groups (Marín et al. 2011): group one consisting of two Neotropical Morphini and Brassolini; group two including Elymniini, Amathusiini, Zetherini, Dirini and Melanitini; group three including only the Neotropical Haeterini; and group four comprising the speciose Satyrini distributed worldwide. Regarding the group two, phylogenetic relationships of its ive tribes remain unresolved except for the well-deined sister relationship of Di-rini and Melanitini (Peña et al. 2006; Peña and Wahlberg 2008; Wahlberg et al. 2009; Price et al. 2011; see the igure 1 in Marín et al. 2011). he phylogenetic uncertainty among them can be mainly exhibited in two aspects: one is the weakly supported nodes bearing them; and another is the unstable topologies of trees conducted by diferent analysis methods (Peña et al. 2006; Peña and Wahlberg 2008; Wahlberg et al. 2009).
It is widely accepted that selecting suitable genetic markers is of great importance in study of molecular systematics. In previous phylogenetic studies on the tribe level relationships of Satyrinae, the protein-coding genes (e.g., mitochondrial COI, and a number of nuclear genes) have been the main source of phylogenetic information (Peña et al. 2006; Peña and Wahlberg 2008; Wahlberg et al. 2009; Price et al. 2011). However, the ribosomal genes, to date have been never considered. he ribosomal genes have already been proven to be informative for phylogenetic analyses in other butterly groups (e.g., 16s rDNA in Kim et al. 2010; 28s rDNA and 18s rDNA in Jiang et al. 2013).
In order to test the phylogenetic utility of the ribosome genes for constructing the tribe level relationships of Satyrinae which have not been resolved based on morpho-logical and protein-coding sequence data, two ribosomal genes (16s rDNA and 28s rDNA) as well as four additional protein-coding genes (COII, Cytb, COI and EF-1α) are used in our study to reconstruct the phylogeny of the Elymniini, Amathusiini, Zetherini, Melanitini and Satyrini which represent all the major lineages of Chinese satyrines. Besides, we further clarify the taxonomic placement of the Callarge Leech, a satyrine genus which has never been included in previous molecular studies.
Materials and methods
Taxon sampling
P
hylogenetic utility of ribosomal genes for r
econstr
ucting the phylogeny
...
107
Subfamily Tribe Species Specimen voucher Collecting locality GenBank accession number
COI COII Cytb 16s rDNA EF-1α 28s rDNA
Libytheinae Libythea myrrha limyr1 China: Yunnan, Jinghong KC158418* KJ777775 KJ805831 KJ777730 KJ805856 KJ777756
Danainae Danaini
Danaus genutia dagen1 China: Yunnan, Hekou KF226386* KJ777776 KJ805832 KJ777731 KJ805857 KJ777757 Parantica sita pasit1 China: Yunnan, Rili NC_024412* KJ777777 KJ805833 KJ777732 KJ805858 KJ777758 Euploea mulciber eumul China: Yunnan, Lincang NC_016720* KJ777778 KJ805834 KJ777733 KJ805859 KJ777759 Apaturinae Apatura ilia apili1 China: Hunan, Zhangjiajie NC_016062* KJ777779 KJ805835 KJ777734 KJ805860 KJ777760 Biblidinae Biblidini Ariadne merione armer1 China: Yunnan, Lincang KC755827* KJ777780 KJ805836 KJ777735 KJ805861 KJ777761
Calinaginae Calinaga davidis cadav1 Mt. QingchengshanChina: Sichuan, NC_015480* KJ777781 KJ805837 KJ777736 KJ805862 n.a.
Charaxinae Charaxini Charaxes bernardus chber1 China: Yunnan, Hekou EF534101* KJ777782 KJ805838 KJ777737 KJ805863 n.a. Polyura eudamippus poeud1 China: Sichuan, Pinwu AB855881* KJ777783 KJ805839 KJ777738 KJ805864 n.a.
Satyrinae
Melanitini Melanitis leda meled1 China: Yunnan, Hekou KM111608 KJ777784 KJ805840 KJ777739 KJ805865 KJ777762 Melanitis phedima mephe1 China: Fujian, Dehua KM111609 KJ777785 KJ805841 KJ777740 KJ805866 n.a.
Elymniini Elymnias hypermnestra elhyp1 China: Yunnan, Hekou KM111610 KJ777786 KJ805842 KJ777741 KJ805867 KJ777763 Elymnias malelas elmal1 China: Xizang, Motuo KM111611 KJ777787 KJ805843 KJ777742 KJ805868 KJ777764
Zetherini
Callarge sagitta casag1 China: Gansu, Wenxian KM111612 KJ777788 KJ805844 KJ777743 KJ805869 KJ777765 Ethope noirei NW121-7 Vietnam DQ338773* n.a. n.a. n.a. DQ338915* n.a. Penthema adelma peade1 China: Gansu, Wenxian EF534103* KJ777789 KJ805845 KJ777744 KJ805870 n.a. Penthema darlisa CP-B02 Vietnam DQ338775* n.a. n.a. n.a. DQ338917* n.a.
Satyrini
M
ingsheng
Yang &
Yalin Zhang / Z
ooK
eys 488: 105–120 (2015)
108
Subfamily Tribe Species Specimen voucher Collecting locality GenBank accession number
COI COII Cytb 16s rDNA EF-1α 28s rDNA
Amathusiini
Stichophthalma howqua sthow1 China: Yunnan, Hekou AY218250* KJ777790 n.a. KJ777745 KJ805871 n.a. Faunis aerope faaer1 China: Zhejiang, Danxi n.a. KJ777791 KJ805846 KJ777746 KJ805872 n.a. Amathusia phidippus NW114-17 Indonesia DQ018956* n.a. n.a. n.a. DQ018923* n.a.
hauria lathyi thlat1 China: Yunnan, Jinghong KM111613 n.a. KJ805847 KJ777747 KJ805873 KJ777766 Discophora necho NW101-6 Indonesia DQ338747* n.a. n.a. n.a. DQ338887* n.a.
previous studies (Freitas and Brown 2004; Peña et al. 2006), other nine species of six subfamilies (Libytheinae, Danainae, Apaturinae, Biblidinae, Calinaginae and Charaxi-nae) of the family Nymphalidae were selected as outgroup taxa. Among them, Libythea myrrha Fruhstorfer of Libytheinae was used to root the resulting phylogenetic trees, since Libytheinae is widely accepted as the sister group to the rest Nymphalidae (e.g., Ackery et al. 1999; Freitas and Brown 2004; Peña et al. 2006; Peña and Wahlberg 2008). he butterlies studied stem from the specimens in Entomological Museum of Northwest A&F University (NWAFU), Yangling, China. Details of the sampling are presented in Table 1.
DNA extraction, ampliication and sequencing
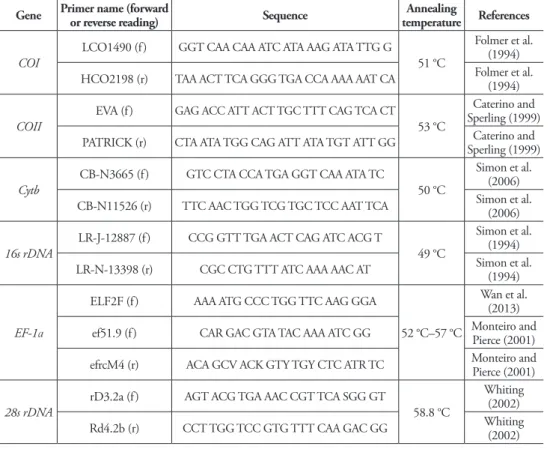
Genomic DNA was extracted from 95–100% ethanol-preserved muscle tissue of two adult butterly legs, using an EasyPure Genomic DNA Kit according to the manufac-turer’s instructions (TransGen Biotech Co., Led., Beijing, China). Extracted genomic DNA was eventually dissolved in 80 µL ddH2O and kept in a freezer (–20 °C) until it was used for polymerase chain reaction (PCR). Sequences of six nuclear and mito-chondrial genes (EF-1α, 28s rDNA, COI, COII, Cytb and 16s rDNA) were amplified through PCR in a total volume of 25 µL. he volume consisted of 12.5 µL CWBIO 2 × Taq MasterMix, 8.5 µL sterile distilled H2O, 2.0 µL genomic DNA template and 1.0 µL 10 µM each primer. he primers used and corresponding annealing temperature in PCR as well as references are listed in Table 2. After electrophoretic analysis to ensure the ampliication products were the target fragments we needed, the PCR products were subsequently sent to Sunny Biotechnology Co., Ltd. (Shanghai, China) for se-quencing with the same primers used in the PCR. All sequences gathered in this study have been deposited in the GenBank.
Sequence analysis and phylogenetic inference
Mingsheng Yang & Yalin Zhang / ZooKeys 488: 105–120 (2015) 110
for phylogenetic reconstruction (Aagesen 2004; Redelings and Suchard 2009). As proposed by Xia et al. (2003), we performed tests of substitutional saturation based on the Iss (i.e. index of substitutional saturation) statistic for diferent partitioned dataset with DAMBE version 5.3.74 (Xia 2013). For this method, if Iss is smaller than Iss.c (i.e. critical Iss), we can infer that the sequences have experienced little substitutional saturation (Xia and Lemey 2009).
Maximum likelihood (ML) analysis was performed using the raxmlGUI version 1.3 interface (Silvestro and Michalak 2012) of RAxML version 7.2.6 (Stamatakis 2006). he best-it substitution model for each gene partition was determined by jModelTest version 2.1.4 (Darriba et al. 2012) under the Akaike Information Criterion (AIC) (Akaike 1974). Clade supports were assessed using the ML + rapid bootstrap algorithm with 1000 bootstrap iterations.
Bayesian inference (BI) analyses were conducted in MrBayes 3.1.2 (Ronquist and Huelsenbeck 2003). he best-it partitioning schemes and partition-speciic substitu-tion models, deined from 16 subsets formed by gene and codon posisubstitu-tion of the six genes used, were tested using the ‘greed’ algorithm of program PartitionFinder v1.1 Table 2. Primers in PCRs for multiple genes used in this study.
Gene Primer name (forward or reverse reading) Sequence temperatureAnnealing References
COI
LCO1490 (f) GGT CAA CAA ATC ATA AAG ATA TTG G
51 °C
Folmer et al. (1994)
HCO2198 (r) TAA ACT TCA GGG TGA CCA AAA AAT CA Folmer et al. (1994)
COII
EVA (f) GAG ACC ATT ACT TGC TTT CAG TCA CT 53 °C
Caterino and Sperling (1999)
PATRICK (r) CTA ATA TGG CAG ATT ATA TGT ATT GG Sperling (1999)Caterino and
Cytb
CB-N3665 (f) GTC CTA CCA TGA GGT CAA ATA TC
50 °C
Simon et al. (2006)
CB-N11526 (r) TTC AAC TGG TCG TGC TCC AAT TCA Simon et al. (2006)
16s rDNA
LR-J-12887 (f) CCG GTT TGA ACT CAG ATC ACG T
49 °C
Simon et al. (1994)
LR-N-13398 (r) CGC CTG TTT ATC AAA AAC AT Simon et al. (1994)
EF-1α
ELF2F (f) AAA ATG CCC TGG TTC AAG GGA
52 °C–57 °C
Wan et al. (2013)
ef51.9 (f) CAR GAC GTA TAC AAA ATC GG Monteiro and Pierce (2001)
efrcM4 (r) ACA GCV ACK GTY TGY CTC ATR TC Monteiro and Pierce (2001)
28s rDNA
rD3.2a (f) AGT ACG TGA AAC CGT TCA SGG GT
58.8 °C
Whiting (2002)
(Lanfear et al. 2012) under the Bayesian information criterion (BIC). Two independ-ent MCMC runs were performed either for 300,000 generations or until the average standard deviation of split frequencies fell below 0.01. he sampling frequency was set as every 100 generations. After the irst 25% of the yielded trees were discarded as burn-in, a 50% majority-rule consensus tree with the posterior probability (PP) values was constructed by summarizing the remaining trees. For BI analyses, two dif-ferent datasets, the full six-gene-dataset and the non-COI + Cytb + COII-3rds-dataset (with 3rd positions removed), were used to examine the phylogenetic utility of the 3rd sites of COI + Cytb + COII, because these sites have sufered substantial saturation (see the results).
Phylogenetic informativeness
We used phylogenetic informativeness (PI) profiles to quantify the relative contribu-tion of each particontribu-tion to the resulted tree. he peak of the PI distribucontribu-tion is suggested to predict the maximum phylogenetic informativeness for corresponding partition (Owen et al. 2014). he PI profiles were generated with the PhyDesign (Townsend 2007; Lopez-Giraldez and Townsend 2011). For this, the aligned sequences and an ul-trametric tree are needed as input iles. In the sequence ile, the eight partition schemes identiied by PartitionFinder v1.1 (Lanfear et al. 2012) were applied. he ultrametric tree was generated with the BEAST version 1.7.5 (Drummond et al. 2012) using the eight partitions and corresponding models determined by PartitionFinder v1.1 (Lan-fear et al. 2012) as well.
Results
Sequence characterization
Mingsheng Yang & Yalin Zhang / ZooKeys 488: 105–120 (2015) 112
Model selection and phylogenetic reconstruction
Each gene partition shows the GTR + I + G for its best-it substitution model except the 28s rDNA being the GTR + G, but we imposed the GTR + G for all gene parti-tions in ML analysis as recommended by Zahiri et al. (2011). For BI analysis, the best partitioning scheme includes eight partitions. Each partition and corresponding parameters used in BI analyses are summarized in Table 4.
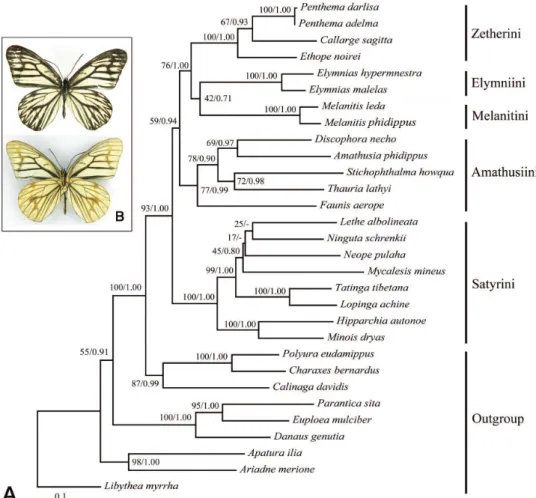
he ML and BI trees based on the full six-gene-dataset show generally identical topolo-gies (summarized in Figure 1). All tribes included with two or more taxa examined in this study are recovered to be monophyletic mostly with strong support values. he traditional “satyrine” clade consisting of Calinaginae, Charaxinae and Satyrinae is well-recovered by strong bootstrap value (BV) 100 and PP 1.00. he ive tribes of Chinese satyrines constitute the Satyrinae clade with BV 93 and PP 1.00. Within this clade, the Satyrini is consistently recovered as sister of others. hen, Amathusiini branches of, and the Zetherini is sister to the sister group (Melanitini + Elymniini), but the relationship between Melanitini and Elymniini is poorly supported by both ML and BI analyses (BV = 42, PP = 0.71). he ge-nus Callarge is nested into the Zetherini, forming a sister group with Penthema Westwood. Table 3. Sequence statistics for the six gene regions.
COI COII Cytb 16s rDNA EF-1α 28s rDNA
Number of sequences 29 25 25 26 30 19
Alignment length (bp) 621 690 591 530 510 460
Percentage A(%) 29.6 34.9 31.7 37.7 25.5 15.5
Percentage T(%) 39.5 41.6 43.3 41.6 26.1 18.2
Percentage C(%) 16.7 13.4 16.0 12.8 25.9 33.8
Percentage G(%) 14.2 10.1 9.0 7.9 22.5 32.5
Number of variable sites 233 288 275 167 165 184
Number of parsimony
informative sites 203 222 226 125 139 138
Chi-square test of base
frequency p = 1.000 p = 1.000 p = 0.998 p = 1.000 p = 0.999 p = 0.138
Table 4. he best-it partitioning schemes and corresponding partition models used in BI analysis.
Partitioned dataset Nucleotide model under BIC
Implemented parameters in BI analysis 1) COI 1st + COII 1st + Cytb 1st GTR + I + G nst = 6, rates = invgamma 2) COI 2nd + COII 2nd + Cytb 2nd HKY + I + G nst = 2, rates = invgamma 3) COI 3rd + COII 3rd + Cytb 3rd HKY + G nst = 2, rates = gamma
4) 16s rDNA GTR + I + G nst = 6, rates = invgamma
5) 28s rDNA GTR + G nst = 6, rates = gamma
6) EF-1α1st TrN + I nst = 6, rates = inv
7) EF-1α2nd JC nst = 1
Figure 1. A Bipartitions tree obtained from maximum likelihood (ML) analysis based on the full six-gene-dataset; numbers separated by a slash on node are bootstrap value (BV) and posterior probability (PP) B Callarge sagitta (Leech), habitus, dorsal view on the above and ventral view on the below.
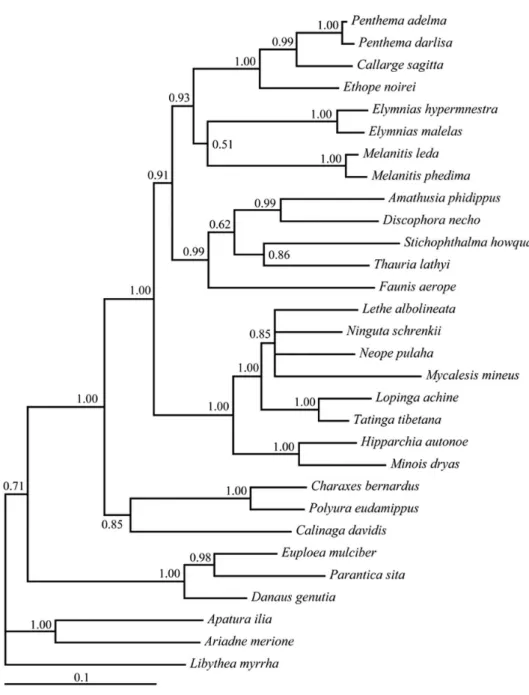
he trees constructed based on the non-COI + Cytb + COII-3rds-dataset is shown in Figure 2. he tree shows generally same topology with that based on the full six-gene-dataset, but some nodes especially that describing the terminal taxa are less resolved. his indicates that the 3rd sites of COI + Cytb + COII provided poor supports for the tribe level relationships.
Phylogenetic informativeness
As shown in Figure 3, the 3rd codon positions of the combined COI, Cytb and COII
Mingsheng Yang & Yalin Zhang / ZooKeys 488: 105–120 (2015) 114
Figure 2. 50% majority-rule trees obtained from Bayesian inference (BI) analyses based on the non-COI + Cytb +COII-3rds-dataset. Numbers on nodes are the posterior probabilities (PP).
Figure 3. Phylogenetic informative profiles for all subsets used in this study. Ze. Zetherini; El. Elymniini; Me. Melanitini; Am. Amathusiini; Sa. Satyrini.
Discussion
Phylogenetic informativeness of related genes
Mingsheng Yang & Yalin Zhang / ZooKeys 488: 105–120 (2015) 116
However, how to make informed choice to these markers confuses many systematics (Danforth et al. 2005). In high level systematics of Satyrinae, EF-1α was commonly used and proven to be quite informative in all previous studies (Peña et al. 2006; Peña and Wahlberg 2008; Wahlberg et al. 2009). Our results show the two ribosomal genes (i.e. 16srDNA and 28srDNA) have generally the same phylogenetic informativeness with EF-1α (Figure 3), which indicates that the former two genes also contribute well in constructing the tribe level relationships. Moreover, we infer the 28srDNA would show better informativeness if the 28srDNA sequence data for each sampling taxon had been obtained in this study. he consistency between the 28srDNA and EF-1α in phylogenetic utility supports the indings of Danforth et al. (2005) who suggested that the nuclear ribosomal and protein-coding genes should be combined in phylogenetic practices after comparing the substitution patterns between them in other groups of insects. he 16s rDNA have been proven to be informative in high level systematics (e.g. Nazari et al. 2007) and was even recommended as standard marker for insect phy-logenetics (Caterino et al. 2000). he high phylogenetic utility of 16srDNA examined in this study provides support for these proposals. However, this result does not sup-port that mitochondrial gene datasets should not be applied on the deep divergences due to their substantial variation (Lin and Danforth 2004; Danforth et al. 2005).
We do not recommend the use of the 3rd positions of combined COI, Cytb and
COII in high level systematics of Satyrinae, although these sites show higher phylo-genetic signals than other partitions (Figure 3). On the one hand, our saturation tests show some sites of the 3rd positions of combined COI, Cytb and COII have sufered substantial saturation. hese sites may positively contribute to the tip nodes of trees, but for the nodes after the PI proile peak they may become the source of noise deep in the tree and cause homoplasy (Owen et al. 2014). On the other hand, the deep branch pattern of BI tree (Figure 2) generally not change when excluding the 3rd positions of combined COI, Cytb and COII. his result indicates that the 3rd positions of com-bined COI, Cytb and COII contribute poorly to the tribe level relationships of the trees based on the full six-gene-dataset.
Phylogenetic relationships among related tribes of Satyrinae
Among the ive tribes of Satyrinae analyzed, our results recover the Satyrini as the basal lineage with a long-branch split from the rest four tribes, in agreement with the indings of Peña et al. (2006) and Peña and Wahlberg (2008). However, relationships among the remaining four tribes are incongruent with other related studies regardless of the Dirini not included herein. Our results recover their relationships as Amathusi-ini + (ZetherAmathusi-ini + (ElymniAmathusi-ini + MelanitAmathusi-ini)); whereas other related studies concluded the following relationships: (Elymniini + Melanitini) + (Zetherini + Amathusiini) in both ML and BI analyses of Wahlberg et al. (2009), the Elymniini + Melanitini + Zetherini + Amathusiini in MP analysis of Wahlberg et al. (2009), and the Melani-tini + (Zetherini + (Elymniini + Amathusiini)) in BI analysis of Peña and Wahlberg (2008). Although ribosomal genes were used for the irst time in our study, and both the ML and BI trees based on the full six-gene-dataset show identical topology, it should be noticed that the nodes in ML analysis describing the tribe level relationships are lowly- or moderately-supported. herefore, the relationships among the related ive tribes recovered herein need further veriication based on more sampling taxa.
he monotypic genus Callarge is distributed restrictedly in China and on the northern border of Vietnam. Morphologically, this genus has marked black veins and lacks eyespots on wings. It is currently placed in Zetherini of Satyrinae (Chou 1999; Yuan et al. 2008) by the presence of hairless eyes, the wings without striking eyespots, and the forewing with basal part of vein Sc, posterior vein of discal cell and vein 2A not swollen (Chou 1998). For the irst time, we verify the status of the genus based on molecular phylogenetic analyses, and reveal that it is sister to the Penthema in the present study.
Acknowledgements
We express our sincere thanks to John Richard Schrock, Emporia State University, Emporia, USA for revising the manuscript. his research is supported by the Min-istry of Science and Technology of the People’s Republic of China (2011FY120200, 2006FY120100).
References
Aagesen L (2004) he information content of an ambiguously alignable region, a case study of the trnL intron from the Rhamnaceae. Organisms Diversity & Evolution 4: 35–49. doi: 10.1016/j.ode.2003.11.003
Mingsheng Yang & Yalin Zhang / ZooKeys 488: 105–120 (2015) 118
Akaike H (1974) A new look at the statistical model identification. IEEE Transactions on Automatic Control 19: 716–723. doi: 10.1109/TAC.1974.1100705
Caterino MS, Cho S, Sperling FAH (2000) he current state of insect molecular systematics: a thriving tower of Babel. Annual Review of Entomology 45: 1–54. doi: 10.1146/annurev. ento.45.1.1
Caterino MS, Sperling FAH (1999) Papilio phylogeny based on mitochondrial cytochrome
oxidase I and II genes. Molecular Phylogenetics and Evolution 11: 122–137. doi: 10.1006/ mpev.1998.0549
Chou I (1998) Classiication and identiication of Chinese butterlies. Henan Scientiic and Technological Publishing House, Zhengzhou, 439 pp.
Chou I (1999) Monograph of Chinese Butterlies, First Volume (Revised Edition). Henan Scientiic and Technological Publishing House, Zhengzhou, 408 pp.
Danforth B, Lin C-P, Fang J (2005) How do insect nuclear ribosomal genes compare to pro-tein-coding genes in phylogenetic utility and nucleotide substitution patterns? Systematic Entomology 30: 549–562. doi: 10.1111/j.1365-3113.2005.00305.x
Darriba D, Taboada GL, Doallo R, Posada D (2012) jModelTest 2: more models, new heuristics and parallel computing. Nature Methods 9: 772. doi: 10.1038/nmeth.2109
Drummond AJ, Suchard MA, Xie D, Rambaut A (2012) Bayesian phylogenetics with BEAUti and the BEAST 1.7. Molecular Biology and Evolution 29: 1969–1973. doi: 10.1093/molbev/ mss075
Folmer O, Black M, Hoeh W, Lutz R, Vrijenhoek R (1994) DNA primers for ampliication of mitochondrial cytochrome oxidase subunit I from diverse metazoan invertebrates. Molecular Marine Biology and Biotechnology 3: 294–299.
Freitas AVL, Brown Jr KS (2004) Phylogeny of the Nymphalidae (Lepidoptera). Systematic Biology 53: 363–383. doi: 10.1080/10635150490445670
Jiang W, Zhu J, Song C, Li X, Yang Y, Yu W (2013) Molecular phylogeny of the butterly genus Polytremis (Hesperiidae, Hesperiinae, Baorini) in China. PLoS ONE 8: e84098. doi: 10.1371/journal.pone.0084098
Katoh K, Standley DM (2013) MAFFT multiple sequence alignment software version 7: im-provements in performance and usability. Molecular Biology and Evolution 30: 772–780. doi: 10.1093/molbev/mst010
Kim MI, Wan X, Kim MJ, Jeong HC, Ahn NH, Kim KG, Han YS, Kim I (2010) Phylogenetic relationships of true butterlies (Lepidoptera: Papilionoidea) inferred from COI, 16S rRNA and EF-1α sequences. Molecules and Cells 30: 409–425. doi: 10.1007/s10059-010-0141-9 Lanfear R, Calcott B, Ho SYW, Guindon S (2012) Partitionfinder: combined selection of par-titioning schemes and substitution models for phylogenetic analyses. Molecular Biology and Evolution 29: 1695–1701. doi: 10.1093/molbev/mss020
Lin C-P, Danforth BN (2004) How do insect nuclear and mitochondrial gene substitution patterns difer? Insights from Bayesian analyses of combined datasets. Molecular Phyloge-netics and Evolution 30: 686–702. doi: 10.1016/S1055-7903(03)00241-0
Marín MA, Peña C, Freitas AVL, Wahlberg N, Uribe SI (2011) From the phylogeny of the Satyrinae butterflies to the systematics of Euptychiina (Lepidoptera: Nymphalidae): His-tory, progress and prospects. Neotropical Entomology 40: 1–13. doi: 10.1590/S1519-566X2011000100001
Monteiro A, Pierce NE (2001) Phylogeny of Bicyclus (Lepidoptera: Nymphalidae) inferred
from COI, COII and EF-1ɑ gene sequence. Molecular Phylogenetics and Evolution 18:
264–281. doi: 10.1006/mpev.2000.0872
Nazari V, Zakharov EV, Sperling FAH (2007) Phylogeny, historical biogeography, and taxonomic ranking of Parnassiinae (Lepidoptera, Papilionidae) based on morphology and seven genes. Molecular Phylogenetics and Evolution 42: 131–156. doi: 10.1016/j. ympev.2006.06.022
Owen CL, Marshall DC, Hill KBR, Simon C (2014) he phylogenetic utility of acetyltrans-ferase (ARD1) and glutaminyl tRNA synthetase (QtRNA) for reconstructing Cenozoic relationships as exemplified by the large Australian cicada Pauropsalta generic complex. Molecular Phylogenetics and Evolution. doi: 10.1016/j.ympev.2014.07.008
Peña C, Nylin S, Freitas AVL (2006) Higher level phylogeny of Satyrinae butterflies (Lepidoptera: Nymphalidae) based on DNA sequence data. Molecular Phylogenetics and Evolution 40: 29–49. doi: 10.1016/j.ympev.2006.02.007
Peña C, Wahlberg N (2008) Prehistorical climate change increased diversiication of a group of butterlies. Biology Letters 4: 274–278. doi: 10.1098/rsbl.2008.0062
Price BW, Villet MH, Walton SM, Barker NP (2011) Using molecules and morphology to infer the phylogenetic relationships and evolutionary history of the Dirini (Nymphalidae: Satyrinae), a tribe of butterlies endemic to Southern Africa. Systematic Entomology 36: 300–316. doi: 10.1111/j.1365-3113.2010.00560.x
Redelings BD, Suchard MA (2009) Robust inferences from ambiguous alignments. In: Rosenberg M (Ed.) Sequence Alignment: Methods, Concepts, and Strategies. University of California Press, Berkeley, 209–270.
Ronquist F, Huelsenbeck JP (2003) MrBayes3: Bayesian phylogenetic inference under mixed models. Bioinformatics 19: 1572–1574. doi: 10.1093/bioinformatics/btg180
Silvestro D, Michalak I (2012) raxmlGUI: a graphical front-end for RAxML. Organisms Diversity & Evolution 12: 335–337. doi: 10.1007/s13127-011-0056-0
Simon C, Buckley TR, Frati F, Stewart JB, Beckenbach AT (2006) Incorporating molecu-lar evolution into phylogenetic analysis, and a new compilation of conserved polymerase chain reaction primers for animal mitochondrial DNA. Annual Review of Ecology, Evolu-tion, and Systematics 37: 545–579. doi: 10.1146/annurev.ecolsys.37.091305.110018 Simon C, Frati F, Beckenbach A, Crespi B, Liu H, Flook P (1994) Evolution, weighing and
phylogenetic utility of mitochondrial gene sequences and compilation of conserved poly-merase chain reaction primers. Annals of the Entomological Society of America 87: 651– 701. doi: 10.1093/aesa/87.6.651
Mingsheng Yang & Yalin Zhang / ZooKeys 488: 105–120 (2015) 120
Swoford DL (2002) PAUP*: Phylogenetic Analysis Using Parsimony (* and Other Methods). Sinauer Associates, Sunderland, Massachusetts.
Tamura K, Stecher G, Peterson D, Filipski A, Kumar S (2013) MEGA6: Molecular Evolution-ary Genetics Analysis Version 6.0. Molecular Biology and Evolution 30: 2725–2729. doi: 10.1093/molbev/mst197
Townsend JP (2007) Profiling phylogenetic informativeness. Systematic Biology 56: 222–231. doi: 10.1080/10635150701311362
Wahlberg N, Leneveu J, Kodandaramaiah U, Peña C, Nylin S, Freitas AVL, Brower AVZ (2009) Nymphalid butterlies diversify following near demise at the Cretaceous/Tertiary boundary. Proceedings of the Royal Society B: Biological Science 276: 4295–4302. doi: 10.1098/rspb.2009.1303
Wan J, Kim MJ, Cho Y, Jun J, Jeong HC, Lee KY, Kim I (2013) Sequence divergence and phylogenetic investigation of the Nymphalidae (Lepidoptera: Papilionoidea) occurring in South Korea. International Journal of Industrial Entomology 26: 95–112. doi: 10.7852/ ijie.2013.26.2.95
Whiting MF (2002) Mecoptera is paraphyletic: multiple genes and phylogeny of Mecoptera and Siphonaptera. Zoologica Scripta 31: 93–104. doi: 10.1046/j.0300-3256.2001.00095.x Xia X (2013) DAMBE5: a comprehensive software package for data analysis in molecular
biology and evolution. Molecular Biology and Evolution 30: 1720–1728. doi: 10.1093/ molbev/mst064
Xia X, Lemey P (2009) Assessing substitution saturation with DAMBE. In: Lemey P, Salemi M, Vandamme AM (Eds) he Phylogenetic Handbook: A Practical Approach to Phylo-genetic Analysis and Hypothesis Testing, Second Edition. Cambridge University Press, Cambridge, UK, 615–630. doi: 10.1017/CBO9780511819049.022
Xia X, Xie Z, Salemi M, Chen L, Wang Y (2003) An index of substitution saturation and its application. Molecular Phylogenetics and Evolution 26: 1–7. doi: 10.1016/S1055-7903(02)00326-3
Yuan F, Shi H, Li Y, Shen A (2008) Taxonomic study of genus Callarge Leech, [1892] in China (Lepidoptera: Nymphalidae: Satyrinae). Sichuan Journal of Zoology 27: 725–727. Zahiri R, Kitching IJ, Lafontaine JD, Mutanen M, Kaila L, Holloway JD, Wahlberg N (2011) A