PROCESS MODELLING AND TECHNO-ECONOMIC ANALYSIS
OF NATURAL GAS COMBINED CYCLE INTEGRATED
WITH CALCIUM LOOPING
by
Maria ERANS, Dawid P. HANAK, Jordi MIR, Edward J. ANTHONY,
and Vasilije MANOVIC
*Combustion and Carbon Capture and Storage Centre, Cranfield University, Bedford, Bedfordshire, UK
Original scientific paper DOI: 10.2298/TSCI151001209E
Calcium looping is promising for large-scale CO2 capture in the power generation and industrial sectors due to the cheap sorbent used and the relatively low energy penalties achieved with this process. Because of the high operating temperatures the heat utilisation is a major advantage of the process, since a significant amount of additional power can be generated from it. However, this increases its complexity and capital costs. Therefore, not only the energy efficiency performance is im-portant for these cycles, but also the capital costs must be taken into account, i. e. techno-economic analyses are required in order to determine which parameters and configurations are optimal to enhance technology viability in different integration scenarios. In this study the integration scenarios of calcium looping and natural gas combined cycles are explored. The process models of the natural gas combined cy-cles and calcium looping CO2 capture plant are developed to explore the most promising scenarios for natural gas combined cycles-calcium looping integration with regard to efficiency penalties. Two scenarios are analysed in detail, and show that the system with heat recovery steam generator before and after the capture plant exhibited better performance of 49.1% efficiency compared with that of 45.7% when only one heat recovery steam generator is located after the capture plant. However, the techno-economic analyses showed that the more energy efficient case, with two heat recovery steam generators, implies relatively higher cost of electrici-ty, 44.1 €/MWh, when compared to that of the reference plant system (33.1 €/MWh). The predicted cost of CO2 avoided for the case with two heat recovery steam gener-ators is 29.3 € per tonne of CO2.
Key words: natural gas combined cycles, calcium looping, efficiency penalty, techno-economic analysis
Introduction
Mitigation of CO2 emissions is required in order to limit the global concentration of CO2 to 450 ppmv by 2050 [1]. However, energy demand is expected to grow and the burning of fossil fuels is likely to continue in the medium-term future. Therefore, it is important to find vi-able routes to achieve CO2 emission limits before the development and deployment of new, less carbon-intensive sources of energy becomes dominant in our global energy mix. One widely considered approach for reducing CO2 emissions in the short to mid-term is carbon capture and
––––––––––––––
storage (CCS) [2, 3]. CCS technology is based on avoiding the emission of CO2 to the atmos-phere; instead the carbon dioxide stream is captured and stored in a safe location [4].
Of the carbon capture technologies amine-based scrubbing is the closest to the mar-ket and can be deployed in the short term because of its easy retrofit in current power stations [3]. In fact, the first large-scale plant of its kind was commissioned in late 2014 [5, 6]. How-ever, given the high cost of amine scrubbing, alternative technologies are being developed us-ing solids as adsorption material, and among these options, calcium loopus-ing (CaL) [7] seems to be one of the most promising and competitive processes to decarbonise power generation and carbon-intensive industries. The main advantages of CaL are relatively low energy penal-ties [8] and the widely available and cheap sorbent (typically limestone) [9].
CaL technology comprises two interconnected fluidised bed reactors and uses lime (CaO) as a CO2 carrier regenerable at high temperatures [10]. In the first reactor, the CO2 pre-sent in the flue gas reacts with the sorbent to produce CaCO3, i. e. saturated sorbent, which is transferred to the second reactor where it is regenerated at high temperature, producing a near-ly pure concentrated CO2 stream. After regeneration, the sorbent is transferred again to the first reactor to start the new cycle. The additional advantage of this process is the almost zero waste material produced in some scenarios as spent sorbent can be reused, for example, in the cement industry [11]. Although CaL is estimated to be 60% less costly than amine technology [9] and cheaper than other emerging technologies (chilled ammonia and membrane separation) [12], there are challenges that need further investigation before fully scaling-up the technolo-gy. Namely, it is well known that sorbents experience reactivity decay with increasing num-bers of reaction cycles, mainly due to sintering [13].
Usually in carbon capture technologies, energy is spent in order to remove the CO2 from the flue gas, which results in lower power plant output. However, in calcium looping, the high temperatures in both reactors allow an exceptional opportunity for heat integration in order to increase the power output of the integrated power-capture plant system. The efficien-cy penalty expected for calcium looping is between 7-10% points, but it can be reduced to levels as low as 5% [10, 14-17]. Heat can be recovered from both hot gas and solid streams, but as the carbonation reaction is exothermic, heat generated in the carbonator can also be used to produce additional steam for a secondary steam cycle [18, 19].
Natural gas combined cycle (NGCC) plants use natural gas as fuel, which is a mix-ture of gaseous hydrocarbons. The main component is methane, but it usually contains some traces of sulphur, nitrogen, and CO2, among other components including higher hydrocarbons [20]. It is a relatively clean fuel used for electricity generation, which accounts for 21% of electricity generated worldwide [21]. Moreover, the efficiency of this kind of plant can achieve values up to 60% [22].
Model development Natural gas combined cycle (NGCC) power plant
The model of the NGCC was developed using the European Benchmark Taskforce (EBTF) data and the work performed by Manzolini et al. [20]. The configuration of the process comprises two gas turbines plus a single steam cycle.
This configuration is used because of the flexibility given by being able to operate with only one gas turbine or both of them, depending on the electricity demand. It pro-vides extra flexibility that cannot be achieved with only one gas turbine [23].
For the modelling of the gas turbine the GasTurb® was used, due to its more accurate calculation options. The gas turbine was modelled in this software in order to satisfy the conditions imposed by the EBTF; blade cooling was also taken into account. The nominal speed of the gas turbine is 1800 rpm, and as the input parameters for the fuel the data for natural gas were extracted from Manzolini et al. [20]. The main air and natu-ral gas inlet conditions are shown in tab. 1, followed by tab. 2 revealing the gas turbine operating parameters.
The rest of the power plant, as well as the capture plant and the compression stage have been modelled using Aspen Plus®. For modelling purposes the combustor was as-sumed to be a stoichiometric reactor (RStoic), which takes into account the stoi-chiometry of the oxidation of the fuel in or-der to calculate the outlet conditions. The HRSG was assumed to have three different pressure turbines and a set of heat exchang-ers in order to get a more accurate predic-tion. The parameters for the HRSG are spec-ified in tab. 3.
The variables studied in the validation of the model are temperature and pressure at the exit of the turbine and power produced by
the gas turbines and the HRSG, as well as the efficiency of the plants. These values can be found in tabs. 4 and 5.
Table 1. Air and natural gas inlet conditions
Air Natural gas
Temperature, [ºC] 15 Temperature, [ºC] 160
Pressure, [bar] 1 Pressure, [bar] 70
Mass flow, [kgs–1] 650 Mass flow, [kgs–1] 15.3
Table 2. Gas turbine main parameters
Parameter Value
Turbine inlet temperature, [ºC] 1360
Pressure ratio in the compressor, [–] 18.1
Compressor efficiency, [%] 85
Turbine efficiency, [%] 94.15
Mechanical efficiency, [%] 99.6
Combustor temperature, [ºC] 1443
Combustor pressure, [bar] 70
Mole flow at exit, [molh–1] 84251.5
Temperature at exit, [ºC] 604
Vapour fraction, [–] 1
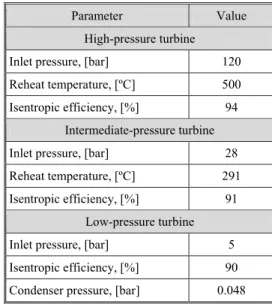
Table 3. Main parameters of the HRSG of the reference plant
Parameter Value
High-pressure turbine
Inlet pressure, [bar] 120
Reheat temperature, [ºC] 500
Isentropic efficiency, [%] 94
Intermediate-pressure turbine
Inlet pressure, [bar] 28
Reheat temperature, [ºC] 291
Isentropic efficiency, [%] 91
Low-pressure turbine
Inlet pressure, [bar] 5
Isentropic efficiency, [%] 90
Capture plant
The flue gas from the NGCC en-ters the carbonator, which is assumed to be a stoichiometric reactor for mod-elling purposes, with three degrees of freedom: sorbent conversion, tempera-ture, and pressure. The carbonator temperature is maintained between 580-700 °C, which is the optimal cap-ture temperacap-ture range due to the trade-off between the equilibrium forces and the reaction kinetics [24, 25]. The calcination occurs at more than 900 °C, in a chamber that is mod-elled as a Gibbs reactor, where extra fuel is burned in an O2/CO2 atmos-phere to generate heat required for the endothermic calcination reaction [14, 26]. As the sorbent conversion decreases during the carbonation/calcination cycles, the fresh sorbent make-up is considered.
This model uses the semi-empirical correlation for maximum average conversion shown in eq. (1) [27]. The carbonation conversion and the CO2 capture level are calculated by eqs. (2) and (3).
2 2
1 1 2 2
ave 0 0 calc
0 carb calc( 1 0 carb calc 2 0
( )
)
1 (1 )
R
R R
a f a f b
X F F r f
F F f f f F F f f f F
⎡ ⎤
= + ⎢ + − + + − + ⎥
⎢ ⎥
⎣ ⎦ (1)
carb calc carb ave
X f f X
∆ = (2)
2
2
CO carb
CO
R
F
E X
F
= ∆ (3)
This model has been verified elsewhere [28], and the main parameters are shown in tab. 6.
Integration of the NGCC and the CaL plant
The ASU was not implemented in the model, and the energy needed to produce pure oxygen was assumed to be 200 kWh/t of O2 [29]. Depending on the technology, there are cer-tain ranges of efficiency penalties that are accepted, for calcium looping that is from 8% to around 12% points [14, 30]. In this work efficiency penalties are used as a benchmark to compare configurations [31, 32]. The following cases are studied in more detail. In Case 1 the capture plant is placed immediately after the gas turbine exit point, and the gas is directly transferred to the carbonator. It should be noted that this configuration is not suitable for the retrofit scenario as the capture plant would be built between the turbine and the HRSG, which is in real plants just one piece of equipment. On the other hand, in Case 2, the capture plant was located after the HRSG to allow retrofitting of existing plants. The HRSG exit gas, which is at 147 °C, is preheated to 564 °C with the CO2 stream from calciner. The efficiency penalty
Table 4. Validation of gas turbine
Parameter Aspen Plus EBTF Error, [%]
Gas turbine outlet
temperature, [°C] 604 608 0.65
Power generated by
gas turbine, [MW] 277 280 1.07
Power generated by
steam turbine, [MW] 265 269.9 1.8
Table 5. Validation parameters of the steam cycle
Parameter Aspen Plus EBTF Error, [%]
Power generated, [MW] 819.9 829.9 1.3
results related to two main integration cases considered in this study are pre-sented in tab. 7. These results show that for Case 2 more power is generated compared with both Case 1 and the ref-erence plant, while the net plant efficien-cy drops in both cases with CaL when compared to the reference plant. The en-ergy penalty for Case 1 is substantially higher than the one for Case 2 due to the higher net plant efficiency in Case 2.
Techno-economic analysis
The prices used in this techno-economic analysis have been taken from [33-37].
In addition to thermal efficiency, both cost of electricity [€MW–1h–1] and CO2 avoided [€/tCO2] are the main pa-rameters of the process that this study aims to evaluate, and they are the main drivers for the final recommendations of this study. Equation (4) is used to calculate the cost of electricity, the an-nuity factor is calculated with eq. (5), and the cost of CO2 avoided is quanti-fied with eq. (6).
fix var
eq eq
F
Y U
TPC
COE u
P T P T
Ψ
η
= + + + (4)
1
1 n
q
q
Ψ
= −−− (5)
capture ref 2
2 2
ref capture Cost of avoided t CO
CO CO
kWh kWh
COE −COE
=
⎛ ⎞
− ⎛
⎜ ⎟
⎞
⎝ ⎠
⎜ ⎟
⎝ ⎠
(6)
Operational parameters
No technical or operational issues are considered, so it is assumed that the plant is running at full capacity all the time (8760 h per year).
One of the most sensitive parameters is the fuel price which can fluctuate greatly. According the Energy Information Administration [38], natural gas prices have varied sub-stantially such that they were 8.5 €/GJ in 2005, 3.5 €/GJ in 2009, and 2.4 €/GJ in 2011. Cur-rently prices are at 3.5 €/GJ [38] while many studies use a value of 3-9 €/GJ. In this study, the current price will be used followed by a sensitivity analysis in order to evaluate the impact of the fuel price and allow the chance to compare it with other literature data.
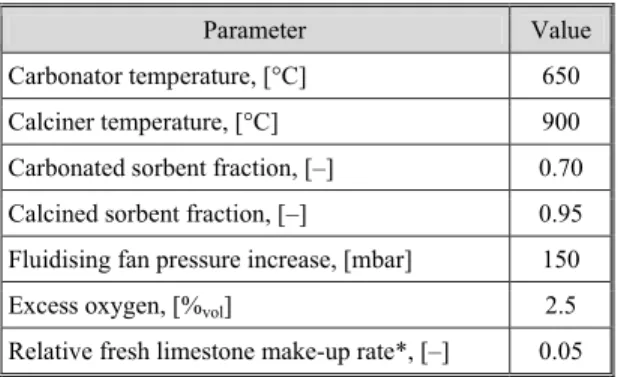
Table 6. Summary of key operating conditions of the calcium looping plant
Parameter Value
Carbonator temperature, [°C] 650
Calciner temperature, [°C] 900
Carbonated sorbent fraction, [–] 0.70
Calcined sorbent fraction, [–] 0.95
Fluidising fan pressure increase, [mbar] 150
Excess oxygen, [%vol] 2.5
Relative fresh limestone make-up rate*, [–] 0.05
Relative fresh limestone make-up rate is defined as ratio of fresh limestone make-up and sorbent looping rate.
Table 7. NGCC plant output and efficiency
Parameter
Reference plant without
CO2
Plant with CO2 capture
Case 1
Case 2
Net plant output, [MW] 819.9 906.8 1025.4
Net plant efficiency, LHV, [%] 57.7 45.7 49.1
Other consumable costs used in this analysis are: fresh water 6 €/m3, cooling water 0.35 €/m3, and fresh limestone 8 €/t. Howev-er, since these prices differ in an open range between studies, an analysis considering these varia-tions is carried out here.
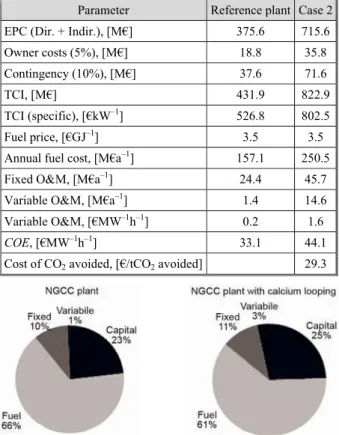
Cost of electricity and cost of avoided CO2.
The total costs for the 820 MWe NGCC plant without CO2 capture are specified in tab. 8.
In tab. 9 the most important economic values are found for the reference plant and Case 2 as well as the fuel price, the cost of elec-tricity (COE), and cost of CO2 avoided.
Discussion
The difference between the costs of the reference power plant and the plant with calcium looping can be seen in fig. 1.
While the COE increases from 33.1 €/MWh to 44.1 €/MWh, which is a growth of approximate-ly 33%, it can be seen how the capital investment increases when the capture is implemented. Fixed costs are also augmented by 2% points, due to the extra water con-sumption plus the necessity of a sorbent make-up flow.
Nevertheless, fuel price is in both cases the most critical varia-ble when it comes to the final cost of electricity. Speaking about the CO2 avoidance cost (29.3 €/tCO2), it is highlighted that in this case the system does not require any ash or sulphur removal treatments. Also when comparing the results to plants with similar electric output but using other types of capture systems, such as amines, the price becomes substantially lower for the CaL case, with avoided cost for novel amine scrubbing technolo-gies of 38.0 €/tCO2 [39].
Table 8. Total costs for the NGCC plant without CO2 capture
Costs Value
Equipment cost, [M€] 206.7 Delivery + Install, [M€] 122.8
Direct costs, [M€] 329.5 Indirect costs at 14%, [M€] 46.1
EPC, [M€] 375.6
TPC, [M€] 431.9
Specific investment, [€kW–1h–1] 526.8
Table 9. Main economic values COE and cost of avoided CO2
Parameter Reference plant Case 2 EPC (Dir. + Indir.), [M€] 375.6 715.6 Owner costs (5%), [M€] 18.8 35.8
Contingency (10%), [M€] 37.6 71.6
TCI, [M€] 431.9 822.9
TCI (specific), [€kW–1] 526.8 802.5
Fuel price, [€GJ–1] 3.5 3.5
Annual fuel cost, [M€a–1] 157.1 250.5 Fixed O&M, [M€a–1] 24.4 45.7
Variable O&M, [M€a–1] 1.4 14.6 Variable O&M, [€MW–1h–1] 0.2 1.6
COE, [€MW–1h–1] 33.1 44.1 Cost of CO2 avoided, [€/tCO2 avoided] 29.3
In order to obtain more reliable re-sults for different fuel price scenarios, a sensitivity analysis for the fuel price is carried out and it is shown in fig. 2.
As can be seen from fig. 2, the fact that natural gas is used also for combus-tions in the calciner makes the COE rise faster in the capture containing system than in the reference plant. It is also shown that the COEcap and the COEref are more affected by the cost of fuel whilst the cost of CO2 avoided is affect-ed in a less dramatic manner.
Conclusions
This work shows that adding an additional steam cycle decreases the energy penalty substantially from 12% to 8.6%, due to the high temperatures reached in the carbonator and the calciner. Therefore, this heat must be utilized in order to achieve a competitive energy penalty comparable to other technologies such as amine scrubbing.
The techno-economic analysis results have shown a potential future for this combi-nation of fuel and technology. While the capital costs of the plant increase considerably, the improved efficiency combined with the capture capacity of the process ensures that the COE
remains at a very acceptable range, and is certainly lower than the costs obtained with other technologies, e. g. with novel amine technologies the COE is 78.5 €/MWh [39], while in this work these costs are as low as 44.1 €/MWh. It can also be concluded that the fuel cost is the most critical parameter and the idea of using natural gas for the calciner is a viable option, since it avoids future costs for the sorbent regeneration due to sulphur contamination and im-purities treatments in the flue gas of the reference plant. Our results have shown costs rapidly increase when the fuel price raises, but gas provisions for the time window where this option is considered appear to be acceptably low.
Nomenclature
a1 – model fitting parameter, [28]
a2 – model fitting parameter, [28]
b – model fitting parameter, [28]
ECO2– CO2 capture level in the carbonator [–]
FCO2– CO2 flow rate entering the carbonator [kmols–1]
FR – CaO looping rate [kmols–1]
F0 – fresh limestone make-up rate, [kmols–1]
f1 – model fitting parameter, [28]
f2 – model fitting parameter, [28]
fcalc – calcination reaction extent, [–]
fcarb – carbonation reaction extent, [–]
n – amortization, [years]
P – power output, [MW]
q – one plus the average discount rate per annum, [–]
r0 – fraction of never calcined limestone in the system, [–]
Teq – utilization time at rated power output, [hours per year]
Ufix – fixed cost of operation, maintenance, and administration, [€]
Uvar – variable cost of operations, maintenance and administration, [€]
Xave – average sorbent conversion, [–]
Xcalc – sorbent conversion in the calciner, [–]
Xcarb – sorbent conversion in the carbonator, [–]
YF – fuel price, [€MJ–1]
∆Xcarb – carbonation conversion, [–]
Greek symbols
ψ – annuity factor, [–]
η – average plant net efficiency, [–]
Acronyms
ASU – air separation unit
Figure 2. Costs vs. fuel price
20 25 30 35 40 45 50 €/MWh for COE €/tCO 2 avoided 2.5 26.9 36.7 26.4 Cost. nat. gas (€/GJ) COE ref COE cap
CO2 avoid
CaL – calcium looping
CCS – carbon capture and storage COE – cost of electricity
EBTF – European benchmark task force EPC – engineering, procurement and
construction
HRSG – heat recovery steam generator NGCC – natural gas combined cycle O&M – operation & maintenance TCI – total capital investment TPC – total plant cost
References
[1] ***, Climate Change 2007: Mitigation: Contribution of Working Group III to the Fourth Assessment Report of the Intergovernmental Panel on Climate Change, Cambridge University Press, Cambridge, U K, and New York, USA, 2007
[2] MacDowell, N., et al., An Overview of CO2 Capture Technologies, Energy Environ. Sci., 3 (2010), 11, pp. 1645-1669
[3] He, M. T., et al., Green Carbon Science: Scientific Basis for Integrating Carbon Resource Processing, Utilization, and Recycling, Angew. Chem., Int., 52 (2013), 37, pp. 9620-9633
[4] ***, Technology Roadmap: Carbon Capture and Storage, International Energy Agency, Paris, France, 2013
[5] ***, Boundary Dam Integrated Carbon Capture and Sequestration Demonstration Project, GCCSI, http://bit.ly/1iVXjVQ
[6] ***, Carbon Capture and Sequestration Technologies at MIT, Boundary Dam Fact Sheet: Carbon Diox-ide Capture and Storage Project, http://bit.ly/Q7lSIG
[7] Shimizu, T., et al., A Twin Fluid-Bed Reactor for Removal of CO2 from Combustion Processes, Chem.
Eng. Res. Des.,77 (1999), 1, pp. 62-68
[8] Romano, M. C., Modelling the Carbonator of a Ca-Looping Process for CO2 Capture from Power Plant Flue Gas, Chem. Eng. Sci.,69 (2012), 1, pp. 257-269
[9] MacKenzie, A, et al., Economics of CO2 Capture Using the Calcium Cycle with a Pressurized Fluidized Bed Combustor, Energy Fuels, 21 (2007), 2, pp. 920-926
[10]Romeo, L. M., et al., Oxyfuel Carbonation/Calcination Cycle for Low Cost CO2 Capture in Existing Power Plants, Energy Conversion and Management, 49 (2008), 10, pp. 2809-2814
[11]Boot-Handford, M. E., et al., Carbon Capture and Storage Update, Energy Environ. Sci., 7 (2014), 1, pp. 130-189
[12]Zhao, M., et al., A Review of Technoeconomic Models for the Retrofitting of Conventional Pulverised- -Coal Power Plants for Post-Combustion Capture (PCC) of CO2. Energy Environ. Sci., 6 (2013), 1, pp. 25-40
[13]Blamey, J., et al., The Calcium Looping Cycle for Large-Scale CO2 Capture, Prog. Energy Combust.
Sci., 36 (2010), 2, pp. 260-279
[14]Martínez, I., et al., Integration of a Ca-Looping System for CO2 Capture in an Existing Power Plant,
AIChEJ, 57 (2011), 9, pp. 2599-2607
[15]Abanades, J. C., et al., Fluidized Bed Combustion Systems Integrating CO2 Capture with CaO, Environ.
Sci.and Tech., 39 (2005), 8, pp. 2861-2866
[16]Romeo, L. M., et al., Optimizing Make-up Flow in a CO2 Capture System Using CaO, Chemical
Engi-neering Journal, 147 (2009), 2-3, pp. 252-258
[17]Vorrias, I., et al., Calcium Looping for CO2 Capture from a Lignite Fired Power Plant, Fuel, 113 (2013), Nov., pp. 826-836
[18]Berstad, D., et al., NGCC Post-Combustion CO2 Capture with Ca/Carbonate Looping: Efficiency De-pendency on Sorbent Properties, Capture Unit Performance and Process Configuration, Int. J. Greenh.
Gas Control, 24 (2014), pp. 43-53
[19]Berstad, D., et al., Post-Combustion CO2 Capture from a Natural Gas Combined Cycle by Cao/CaCO3 Looping, Int. J. Greenh. Gas Control, 11 (2012), pp. 25-33
[20]Manzolini, G., et al., CO2 Capture in Natural Gas Combined Cycle with SEWGS. Part A: Economic As-sessment, Int. J. Greenh. Gas Control,12 (2013), pp. 502-509
[21]***, Natural Gas Combined Cycle Gas Turbine Power Plants. New Resource Characterization for the Fifth Power Plan, Northwest Power Planning Council, Portland, Ore., USA, 2002
[23]Farmer, R., de Biasi, B., Gas Turbine World Handbook, Gas Turbine World, Fairfield, Conn., USA, 2010
[24]Lu, D. Y., et al., Ca-Based Sorbent Looping Combustion for CO2 Capture in Pilot-Scale Dual Fluidized Bed, Fuel Proc. Tech.,89 (2008), 12, pp. 1386-1395
[25]Valverde, J. M., A Model on the CaO Multicyclic Conversion in the Ca-Looping Process, Chem. Eng.
Journal, 228 (2013), pp. 1195-1206
[26]Valverde, J. M., et al., CO2 Multicyclic Capture of Pretreated/Doped CaO in the Ca-Looping Process. Theory and Experiments, Physical Chemistry Chemical Physics, 15 (2013), 28, pp. 11775-11793 [27]Rodríguez, N., et al., Average Activity of CaO Particles in a Calcium Looping System, Chem. Eng.
Journal, 156 (2010), 2, pp. 388-394
[28]Hanak, D. P., et al., Modelling and Comparison of Calcium Looping and Chemical Solvent Scrubbing Retrofits for CO2 Capture from Coal-Fired Power Plant, Int. J. Greenh. Gas Control, 42 (2015), Nov., pp. 226-236
[29]Romano, M. C., et al., Ultra-High CO2 Capture Efficiency in CFB Oxyfuel Power Plants by Calcium Looping Process for CO2 Recovery from Purification Units Vent Gas, Int. J. Greenh. Gas Control, 18 (2013), Oct., pp. 57-67
[30]Page, S. C., et al., Carbon Capture and Storage: Fundamental Thermodynamics and Current Technology,
Energy Policy, 37 (2009), 9, pp. 3314-3324
[31]Versteeg, P., Rubin, E. S., Technical and Economic Assessment of Ammonia-Based Post-Combustion CO2 Capture, Energy Procedia, 4 (2011), Sep., pp. 1957-1964
[32]Rao, A. B., Rubin, E. S., A Technical, Economic, and Environmental Assessment of Amine-Based CO2 Capture Technology for Power Plant Greenhouse Gas Control, Environ. Sci. and Tech., 36 (2002), 20, pp. 4467-4475
[33]Martínez, I., et al., Integrated Combined Cycle from Natural Gas with CO2 Capture Using a Ca-Cu Chemical Loop, AIChE Journal, 59 (2013), 8, pp. 2780– 2794
[34]Manzolini, G., et al., CO2 Capture in Integrated Gasification Combined Cycle with SEWGS – Part B: Economic Assessment, Fuel, 105 (2013), Mar., pp. 220-227
[35]Kehlhofer, R., et al., Combined-Cycle Gas & Steam Turbine Power Plants, Pennwell Books, Tulsa, Okla., USA, 2009
[36]Figueroa, J. D., et al., Advances in CO2 Capture Technology – The US Department of Energy's Carbon Sequestration Program, Int. J. Greenh. Gas Control, 2 (2008), 1, pp. 9-20
[37]Peters, M. S., et al., Plant Design and Economics for Chemical Engineers, vol. 5, McGraw-Hill, New York, USA, 2002
[38]***, Annual Energy Outlook, International Energy Agency, Washington DC, USA, 2015
[39]Manzolini, G., et al., Economic Assessment of Novel Amine Based CO2 Capture Technologies Integrat-ed in Power Plants BasIntegrat-ed on European Benchmarking Task Force Methodology, Applied Energy, 138
(2015), C, pp. 546-558