Dileep George*, Jeff Hawkins
Numenta Inc., Redwood City, California, United States of America
Abstract
The theoretical setting of hierarchical Bayesian inference is gaining acceptance as a framework for understanding cortical computation. In this paper, we describe how Bayesian belief propagation in a spatio-temporal hierarchical model, called Hierarchical Temporal Memory (HTM), can lead to a mathematical model for cortical circuits. An HTM node is abstracted using a coincidence detector and a mixture of Markov chains. Bayesian belief propagation equations for such an HTM node define a set of functional constraints for a neuronal implementation. Anatomical data provide a contrasting set of organizational constraints. The combination of these two constraints suggests a theoretically derived interpretation for many anatomical and physiological features and predicts several others. We describe the pattern recognition capabilities of HTM networks and demonstrate the application of the derived circuits for modeling the subjective contour effect. We also discuss how the theory and the circuit can be extended to explain cortical features that are not explained by the current model and describe testable predictions that can be derived from the model.
Citation: George D, Hawkins J (2009) Towards a Mathematical Theory of Cortical Micro-circuits. PLoS Comput Biol 5(10): e1000532. doi:10.1371/ journal.pcbi.1000532
Editor:Karl J. Friston, University College London, United Kingdom
ReceivedMarch 3, 2009;AcceptedSeptember 11, 2009;PublishedOctober 9, 2009
Copyright:ß2009 George, Hawkins. This is an open-access article distributed under the terms of the Creative Commons Attribution License, which permits unrestricted use, distribution, and reproduction in any medium, provided the original author and source are credited.
Funding:This work was supported by Numenta Inc. Jeff Hawkins, one of the investors of Numenta, is a contributing author on this paper and was involved in the study, decision to publish and preparation of the manuscript.
Competing Interests:Jeff Hawkins and Dileep George are cofounders of Numenta and own shares of Numenta. Numenta is a for-profit startup company in Redwood City, CA.
* E-mail: dgeorge@numenta.com
Introduction
Understanding the computational and information processing roles of cortical circuitry is one of the outstanding problems in neuroscience. The circuits of the neocortex are bewildering in their complexity and anatomical detail. Although enormous progress has been made in the collection and assimilation of data about the physiological properties and connectivity of cortical neurons, the data are not sufficient to derive a computational theory in a purely bottom-up fashion.
The theoretical setting of hierarchical Bayesian inference is gaining acceptance as the framework for understanding cortical computation [1–5]. Tai Sing Lee and David Mumford [1] suggested that algorithms for Bayesian belief propagation might model the interactive feed-forward and feedback cortical computations. Con-currently, Karl Friston [5] reviewed the structure of the anatomical organization of the neocortex and suggested its strong correspon-dence to hierarchical Bayesian generative models. Friston recently expanded on this to suggest an inversion method for hierarchical Bayesian dynamic models and to point out that the brain, in principle, has the infrastructure needed to invert hierarchical dynamic models [6]. However, there still remains a gap between our understanding of learning and inference in hierarchical Bayesian models and our understanding of how it is implemented in cortical circuits. In a recent review, Hegde and Felleman pointed out that the ‘‘Bayesian framework is not yet a neural model. [The Bayesian] framework currently helps explain the computations that underlie various brain functions, but not how the brain implements these computations’’ [2]. This paper is an attempt to fill this gap by deriving a computational model for cortical circuits based on the mathematics of Bayesian belief propagation in the context of a particular Bayesian framework called Hierarchical Temporal Memory (HTM).
Belief propagation techniques can be applied to many different types of networks. The networks can vary significantly in their topology, in how they learn (supervised, unsupervised, or non-learning), and in how they incorporate or do not incorporate time. Therefore, to map the mathematics of Bayesian belief propagation onto cortical architecture and microcircuits we must start with a particular Bayesian framework that specifies these variables. The starting point for the work presented in this paper is a model called the Memory-Prediction Framework, first described by one of this paper’s authors, Hawkins, in a book titled ‘‘On Intelligence’’ [7]. The Memory-Prediction Framework proposed that the neocortex uses memory of sequences in a hierarchy to model and infer causes in the world. The Memory-Prediction Framework proposed several novel learning mechanisms and included a detailed mapping onto large scale cortical-thalamic architecture as well as onto the microcircuits of cortical columns. However, the Memory-Prediction Framework was not described in Bayesian terms and was presented without the rigor of a mathematical formulation.
are also consistent with each other in that they operate under the same set of assumptions and work together in a hierarchy.
Several researchers have proposed detailed models for cortical circuits [10–12]. Some of these models exhibit interesting pattern recognition properties and some have been used in the explanation of physiological phenomena. However, these models do not incorporate the concepts of Bayesian inference in a hierarchical temporal model. Other researchers [4,13] have proposed detailed mechanisms by which Bayesian belief propagation techniques can be implemented in neurons. Their work suggests that, at a neuron level, machinery exists for implementing the types of computations required for belief propagation. However, they did not attempt to map these implementations to detailed cortical anatomy. To our knowledge, the work in this paper is the first attempt to map the theory of Bayesian belief propagation and hierarchical and temporal inference onto cortical circuitry. (Partial details of this work have been published earlier [9,14].)
Deciphering the functional connectivity of the cortical circuits is a formidable task and is associated with the perils involved in the reverse engineering of a complex system. The circuits derived in this chapter can provide a hypothesis-driven framework for examining the neural connectivity. As with any theory, it is expected that the particular instantiation described here will need to be revised as more data is obtained and more aspects of cortical computations, like attention, timing, and motor action, are incorporated. The circuit derived here could act as a basis for such explorations. In addition to providing a template for understanding cortical circuits [15], the theory presented here can be useful in the modeling of physiological phenomena. As an example, we simulate the subjective contour effect using feedback from a high-level belief using the derived circuits. Having a complete biological mapping of a computational theory can also help in the design of hypothesis-driven biological experiments.
The rest of this paper is organized in such a manner that the computational parts are clearly separated from the biological aspects. The Model section deals exclusively with the computa-tional aspects of HTMs. In this section, we briefly describe the HTM theory and take a detailed look at the inference mechanism in HTM nodes. The Bayesian belief propagation equations for the computations in an HTM node are described. We then describe an abstract circuit implementation of these equations using neuron-like elements. The Results section of the paper, which deals primarily with the biological implementation, maps this abstract neural implementation to the laminar biological cortical circuitry by matching the computational specifications with
anatomical data. This section also provides example applications of this circuit in the modeling of physiological phenomena. In the Discussion section we discuss variations, omissions, and extensions of the proposed circuits.
Model
Hierarchical Temporal Memory
Hierarchical Temporal Memory is a theory of the neocortex that postulates that the neocortex builds a model of the world using a spatio-temporal hierarchy. According to this theory, the operation of the neocortex can be approximated by replicating a basic computational unit – called a node – in a tree structured hierarchy. Each node in the hierarchy uses the same learning and inference algorithm, which entails storing spatial patterns and then sequences of those spatial patterns. The feed-forward output of a node is represented in terms of the sequences that it has stored. The spatial patterns stored in a higher-level node record co-occurrences of sequences from its child nodes. The HTM hierarchy is organized in such a way that higher levels of the hierarchy represent larger amounts of space and longer durations of time. The states at the higher levels of the hierarchy vary at a slower rate compared to the lower levels. It is speculated that this kind of organization leads to efficient learning and generalization because it mirrors the spatio-temporal organization of causes in the world.
In our research, HTMs have been used successfully in invariant pattern recognition on gray-scale images, in the identification of speakers in the auditory domain and in learning a model for motion capture data in an unsupervised manner. Other research-ers have reported success in using HTMs in content-based image retrieval [16], object categorization [17], and power system security analysis [18]. Another set of researchers has explored hardware implementations and parallel architectures for HTM algorithms [19].
HTMs can be specified mathematically using a generative model. A simplified two-level generative model is shown in Figure 1. Each node in the hierarchy contains a set ofcoincidence patternsc1,c2, ,cj jC and a set of Markov chainsg1,g2, ,gj jG where each Markov chain is defined over a subset of the set coincidence patterns in that node. A coincidence pattern in a node represents a co-activation of the Markov chains of its child nodes. A coincidence pattern that is generated by sampling a Markov chain in a higher level node concurrently activates its constituent Markov chains in the lower level nodes. For a particular coincidence pattern and Markov chain that is ‘active’ at a higher-level node, sequences of coincidence patterns are generated concurrently by sampling from the activated Markov chains of the child nodes.
The process of learning an HTM model for spatio-temporal data is the process of learning the coincidence patterns and Markov-chains in each node at every level of the hierarchy. Although algorithms of varying levels of sophistication can be used to learn the states of an HTM node, the basic process can be understood using two operations, (1) memorization of coincidence patterns, and (2) learning a mixture of Markov chains over the space of coincidence patterns. In the case of a simplified generative model, an HTM node remembers all the coincidence patterns that are generated by the generative model. In real world cases, where it is not possible to store all coincidences encountered during learning, we have found that storing a fixed number of a random selection of the coincidence patterns is sufficient as long as we allow multiple coincidence patterns to be active at the same time. Motivation for this method came from the field of compressed Author Summary
sensing [20]. The HMAX model of visual cortex [21] and some versions of convolutional neural networks [22] also use this strategy. We have found that reasonable results can be achieved with a wide range of the number of coincidences stored. We have not yet developed a good heuristic for determining an optimal value of this parameter. For simplicity, we will only illustrate the case where a single coincidence pattern is active in a node at a time, but in our real implementations we use sparse distributed activations of the coincidence patterns. Each Markov chain in a node represents a set of coincidence patterns that are likely to occur sequentially in time. This temporal proximity constraint is analogous to the temporal slowness principle used in the learning of of invariant features [23–26]. The learning of the mixture of Markov chains is simplified considerably because of the slowness constraint. We have found that a simple way to learn the mixture of Markov chains for real world cases is to learn a large transition matrix that is then partitioned using a graph partitioning algorithm [27]. Details of one method of learning higher order Markov chains is available in [28].
For the rest of this paper, we will focus on the inference mechanism in HTM nodes that have finished their learning process. A node that has finished its learning process has a set of coincidence patterns and a set of Markov chains in it. Figure 2(A) shows a node that has 5 coincidence patterns and 2 Markov chains.
The inference mechanism in an HTM network is based on the propagation of new evidence from anywhere in the network to all other parts of the network. The presentation of a new image to the first level of an HTM vision network is an example of new evidence. Propagation of this evidence to other parts of the network results in each node in the network adjusting its belief states given this evidence. For example, a new image can lead to a different belief in the top level of the network regarding the identity of the object in that image. In general, HTM networks infer on time-varying inputs. Inference on a static input is a special case of this computation. Information can also be propagated down in the hierarchy for attention, segmentation, and filling in missing inputs.
HTM networks use Bayesian belief propagation for inference. Bayesian belief propagation originally was derived for inference in Bayesian networks [29]. Since an HTM node abstracts space as well as time, new equations must be derived for belief propagation in HTM nodes. These equations are described in the next section.
Belief propagation in HTM nodes
In general, the messages that come into an HTM node from its children represent the degree of certainty over the child Markov chains. The node converts these messages to its own degree of certainty over its coincidence patterns. Based on the history of messages received, it also computes a degree of certainty in each of
Figure 1. Generative model for HTM.Hierarchical Temporal Memory (HTM) is a model of neocortical function. HTMs can be specified using a
generative model. Shown is a simple two-level three-node HTM-type generative model. Each node in the hierarchy contains a set of coincidence patterns (labeled withc0s) and a set of Markov chains (labeled withg0s) defined over the set of coincidence patterns. A coincidence pattern in a node
represents a co-activation of particular Markov chains of its child nodes. HTM generative model is a spatio-temporal hierarchy in which higher levels remain stable for longer durations of time and can generate faster changing activations in lower levels.
its Markov chains. This is then passed up to the next higher-level node. What the node receives from its parent is the parent’s degree of certainty over this HTM node’s Markov chains. The Markov chains are then ‘unwound’ in a step-by-step manner to find the top-down probability distribution over coincidence patterns. From this, the node’s degrees of certainty over its child nodes’ Markov chains are calculated. These feedback messages are then sent to the child nodes.
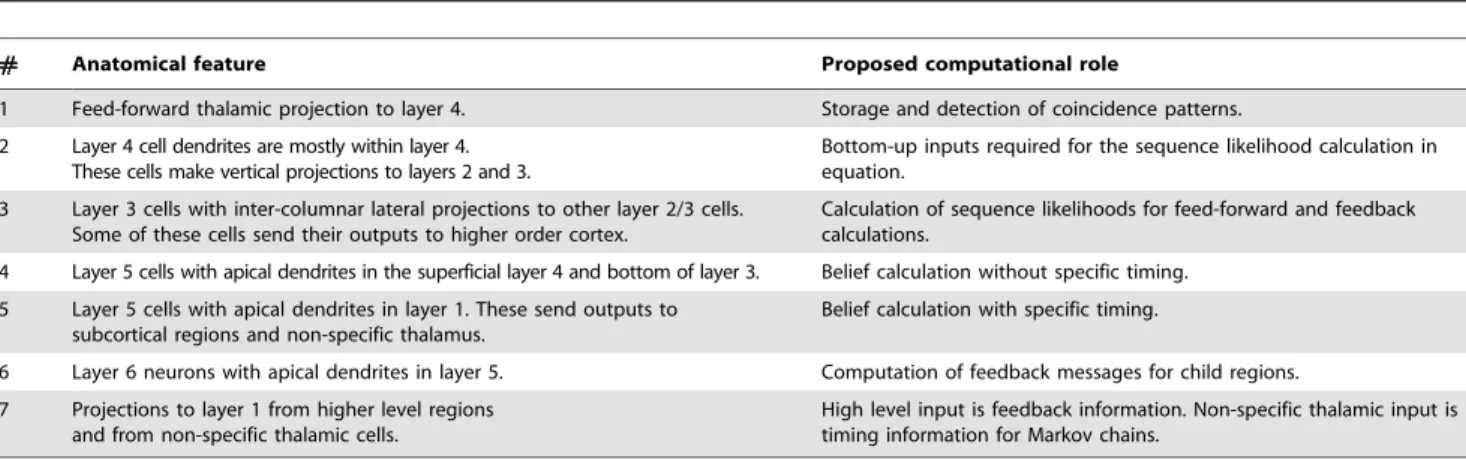
Table 1 summarizes the computation of belief propagation messages in an HTM node. We will now describe the notation and meaning of these equations using the reference HTM node shown in Figure 2. Detailed derivations of these equations are given in supporting information Text S1. A summary of the notation in these equations is given in Table 2. Each equation is considered in detail in the sections that follow.
In these equations, the coincidence patterns are referred to usingci0sand the Markov chains are referred to usinggi0s. The HTM node shown in Figure 2(A) contains 5 coincidence patterns and 2 Markov chains. The transition probability matrix of the Markov chain gr is denoted by P(ci(t)jcj(t{1),gr). This term appears in Equations 4 and 7. Each coincidence pattern in the node represents a co-occurrence of the temporal groups from its children. Coincidence pattern specifications are used in the computations described in equations 2 and 9.
Each node receives feed-forward input messages from its children and sends feed-forward messages to its parent. The feed-forward input messages are denoted by lchild node index. The feed-forward output message of the node is denoted by l.
Similarly, the node receives feedback messages from its parent and sends feedback messages to its child nodes. The feedback input message to the node is denoted byp. The feedback output messages that the node sends to its child nodes are denoted by pchild node index. The equations shown in Table 1 describe how the output messages are derived from the input messages. From the viewpoint of the node, the feed-forward messages carry informa-tion about theevidence from below. Evidence from below at any timet is denoted by{
et. Similarly evidence from the parent is denoted byz
et.
Equation 2 describes how the node calculates its likelihood of coincidence patterns, using the messages it gets from the children. The bottom-up likelihood of coincidence pattern ci at timet is represented by yt(i)~P({
etjci(t)). The likelihood of each coincidence pattern is calculated as the product of the message components corresponding to that coincidence pattern.
In Equation 3, the bottom-up likelihood of Markov chaingr at time t is denoted by P({
et
0jgr(t)), where the term
{
et 0
represents the sequence of bottom-up evidences from time0to timet. This reflects that the likelihood of the Markov chains depends on the sequence of inputs received by the node. The variables a and b defined in Equations 4 and 7 are state variables that are updated in a recursive manner at every time instant. These are dynamic programming [30,31] variables, each defined over all pairwise combinations of coincidence patterns and Markov chains. For example,at(ci,gr)is value of the feed-forward dynamic programming variable at time t corresponding to coincidence ci and Markov chain gr. In
Figure 2. Structure and flow of a reference HTM node.(A) Structure of the reference node, with five coincidence patterns and two Markov
chains. This is an HTM node that has finished its learning process. It is assumed that this is the first node at level 2 of a network and is therefore labeled asN2,1. Each coincidence pattern represents a co-occurrence of the Markov chains of the children. This node has 2 children. Child 1 has 3
Markov chains and child 2 has 4 Markov chains – hence there are seven elements in each coincidence pattern. The portions of the coincidence pattern coming from the first and second child are shown in different shades of gray. (B) Information flow in the reference node for the computation of the belief propagation equations shown in Table 1. The rectangles inside the node are processing units for the equations in the rows corresponding to the number displayed in each rectangle. We will use ‘feed-forward’ or ‘bottom-up’ to qualify messages received from children and messages sent up to the parent of this node. We will use ‘feedback’ or ‘top-down’ to qualify messages received from the parent and messages sent to the child nodes of this node. The node shown in the figure has two bottom-up input messages coming from the two children and has two top-down outputs which are the messages sent to these children. The arrows show vectors of inputs, outputs, and intermediate computational results. The number of components of each vector is represented using an array of boxes placed on these arrows.
Equations 4 and 7, the states are updated every time step by passing the state from the previous time step through the Markov transition matrices and by combining them with bottom-up/top-down evidence.
An illustrative example showing how the belief propagation equations map onto a toy visual pattern recognition problem is given in supporting information Text S2. Readers who are not familiar with belief propagation can use this example to develop intuition for the nature of the messages. We examine the equations in Table 1 in more detail in the next section as we consider how to implement them using neuron-like elements.
Neuronal implementation of HTM belief propagation This section describes an implementation of the HTM belief propagation equations using neuron-like elements. The imple-mentation will be described with respect to the reference HTM node in Figure 2. The neuronal implementation of the equations in Table 1 is described in the following subsections. The subsections follow the order of table row numbers.
The purpose of this section is to show how the equations of HTM belief propagation can map onto a hypothetical neuronal system. In the Results section, we map this hypothetical model onto actual cortical anatomy.
Table 1.Belief propagation equations for an HTM node.
1) Calculate likelihood over coincidence patterns. yt(i)~P({
etjci(t))!PM
j~1l
mj t (r
mj
i ) ð2Þ
where coincidence patternciis the co-occurrence ofrm1
i ’thMarkov chain from child
1,rm2
i ’thMarkov chain from child 2, , andr mM
i ’thMarkov chain from childM.
2) Calculate the feed-forward likelihood of
Markov chains using dynamic programming lt(gr)~P(
{
et
0jgr(t))!
X
ci(t)[Ck
at(ci,gr) ð3Þ
at(ci,gr)~P({
etjci(t)) X
cj(t{1)[Ck
P(ci(t)jcj(t{1),gr)at{1(cj,gr) ð4Þ
a0(ci,gr)~P(
{
e0jci(t~0))P(ci(t~0)jgr) ð5Þ
3) Calculate the belief distribution over coincidence patterns
Belt(ci)!X
gr[Gk
bt(ci,gr) ð6Þ
bt(ci,gr)~P(
{
etjci(t)) X cj(t{1)[Ck
P(ci(t)jcj(t{1),gr)bt{1(cj,gr) ð7Þ
b0(ci,gr)~P(
{
e0jci(t~0))P(cijgr)p0(gr) ð8Þ
4) Calculate the messages to be sent to child nodes.
pmi(g
r)! X
i
I(ci)Bel(ci) ð9Þ
where
I(ci)~ 1, ifgmi
r is a component ofci 0, otherwise
ð10Þ
doi:10.1371/journal.pcbi.1000532.t001
Table 2.Summary of notation used for belief propagation in HTM nodes.
Symbol Meaning
ci ith coincidence in the node
gr rth Markov chain in the node.
{
e Bottom-up evidence.{
etindicates the evidence at particular instanttand{
et
0indicates the sequence of bottom-up evidence from time0to timet. z
e Top-down evidence. Time indexing is similar to that of{
e
l Feed-forward output message of the node. This is a vector of length equal to the number of Markov chains in the node. lmi
Feed-forward input message to the node from the child nodemi.This is a vector of length equal to the number of Markov chains in the child node. p Feedback input message to the node. This is a vector of length equal to the number of Markov chains in the node.
pmi
Feedback output message of the node to child nodemi.This is a vector of length equal to the number of Markov chains in the child node.
y The bottom-up likelihood over coincidence patterns in a node. This is one of the inputs for the feed-forward sequence likelihood calculation. a Bottom-up state variable for the Markov chains in a node. This a vector of length equal to the total number of states of all Markov chains in the node. b State that combines bottom-up and top-down evidence for the Markov chains in a node. This state variable has the same dimension as that ofa.
Bel(ci) Belief in theith coincidence pattern in a node.
Calculating the likelihood of coincidence patterns. The bottom-up input to the HTM node is the feed-forward output messages from its children. These output messages carry information about the degree of certainty of the Markov chains in the child nodes. Each message is a vector of length equal to the number of Markov chains in the corresponding child. The likelihood of coincidences is derived from these input messages according to Equation 2. This operation is performed by the rectangle marked 1 in Figure 2(B). Figure 3 shows an abstract neuronal implementation of this calculation for the reference HTM node.
In Figure 3, each neuron corresponds to a stored coincidence pattern. The pattern corresponding to the co-occurrence is stored in the connections this neuron makes to the messages from the child input nodes. For example, the neuron corresponding to coincidence patternc1has connections to the first position of the
message from the first child and the third position of the message from the second child. These connections correspond to first row of the coincidence-pattern matrix C2,1 in Figure 2(A). Each neuron calculates its output by multiplying its inputs. For example, the output of neuronc3 is proportional to the product ofl1,1(2)
andl1,2(2). The output, denoted byyin Figure 2(B), is a vector of 5 components, one component corresponding to each coincidence pattern. This vector represents the likelihood of coincidence patterns, based on the messages received from the child nodes.
Calculating the feed-forward likelihood of Markov
chains. The next step in the computation of feed-forward
messages, corresponding to the rectangle marked 2 in Figure 2(B), is the calculation of the degree of certainty of the HTM node in each of its Markov chains. The quantity that needs be to calculated is P({
e0,{e1, ,{etjgi) for each Markov chain gi where {
e0,
{
e1, ,
{
et represent the bottom-up evidence distributions received from time 0to time t. The likelihood of Markov chains depends on the sequence of messages that the node has received from its children. A brute-force computation of this
quantity is not feasible because this requires the enumeration of the likelihoods of an exponentially growing number of sample paths. To calculate P({
et0jgi) efficiently, all the past evidence needs to be collapsed into a state variable that can be updated recursively every time instant. This is done using a technique called dynamic programming [30,31] as represented in Equation 4. The derivation of this equation is described in supporting information Text S1.
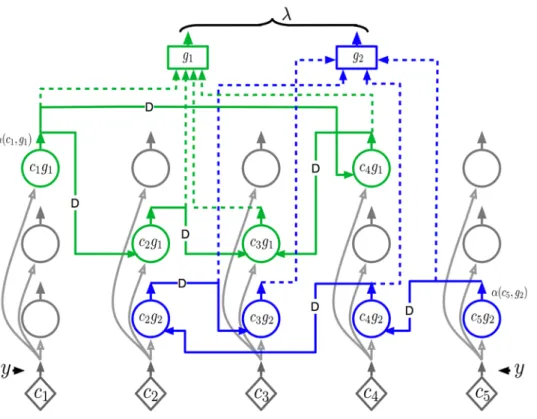
Equation 4 can have a very efficient neuronal implementation as shown in Figure 4. The ‘circle’ neurons in this circuit implement the sequence memory of the Markov chains in the HTM node. The connections between the circle neurons implement the transition probabilities of the Markov chain. As the ‘axons’ between these neurons encode a one time-unit delay, the output of a circle neuron is available at the input of the circle neuron that it connects to after one time step. (This is a very limited method of representing time. We will discuss more sophisticated representa-tions of time in a later section.)
All the circle neurons co-located in a column have the same bottom-up input. They are all driven by the same coincidence-pattern likelihood neuron – represented by diamonds – from below. Each column, considering only bottom-up input, can be thought of as representing a particular coincidence pattern. In addition to the bottom-up input, these circle neurons also have ‘lateral’ inputs that come from other circle neurons in the same Markov chain. The lateral connections specify the meaning of a neuron in a sequence. A circle neuron that is labeled as cigj represents the coincidence pattern ci in the context of Markov chaingj. The same coincidence pattern can belong to different Markov chains and can hence be active under different temporal contexts. For example, the circle neuronc2g1will be activated only
in the context of Markov chaing1, whereas the circle neuronc2g2
will be activated only in the context of Markov chaing2.
Each circle neuron in this circuit does the same computation. Each neuron calculates its output by multiplying the bottom-up input with the weighted sum of its lateral inputs. The output of a circle neuron is denoted usinga(coincidence number,markov chain number). With this, the output of any circle neuroncigr is calculated as
at(ci,gr)~y(i)X j
w(i,j)at{1(cj,gr) ð1Þ
That is, the output of the a circle neuron at any time is the weighted sum of the outputs of the neurons in the same Markov chain at the previous time step multiplied by the current bottom-up activation. (Again, the above equation assumes a simple step-wise notion of time which is insufficient for encoding duration and for non-discrete time problems. We believe that in real brains, time duration is captured using a separate mechanism. This will be discussed in the Results section.) The above equation corresponds to Equation 4 if we replace w(i,j)byP(cijcj,gr). Therefore, the circle-neuron circuits shown in Figure 4 implement Equation 4 and the weights on the lateral time-delayed connections correspond to the transition matrix entries in each Markov chain.
Now consider the third kind of neurons – the ‘rectangle’ neurons – in Figure 4. The rectangle neuron markedg1receives its
inputs from the outputs of all the circle neurons in the Markov chain g1. The rectangle neurons pool the outputs of all the
coincidence-pattern neurons in the context of a Markov chain. At any time point, the output of a rectangle neuron is calculated as the sum (or maximum) of the inputs to that neuron.
Note that the operation of the rectangle neurons corresponds to pooling over the activations of all the circle neurons of the same Markov chain. It is easy to verify that this is the operation involved
Figure 3. Coincidence likelihood circuit.Circuit for calculating the
bottom-up probability over coincidence patterns. Coincidence pattern neurons are represented by diamond shapes. The inputs to the circuit are the messages from the children, which are denoted byl1,1andl1,2. The output of the circuit isy, as calculated by Equation 2 in Table 1. The input connections to each neuron represent its coincidence pattern. For example,c2is the co-occurrence of Markov chain 3 from the left child
and Markov chain 1 from the right child. The probabilities are calculated by multiplying the inputs to each neuron.
in the calculation of the message this node sends to its parent according to Equation 3. The concatenated outputs of the rectangle neurons is the message l that this node sends to its parent. As noted in Figure 2(B), this message is a vector of two components, corresponding to the two Markov chains in the reference node in Figure 2(A). This completes the description of the abstract neuronal implementation of equations in the second row of Table 1 and of the operations performed by the rectangle marked (2) in Figure 2(B).
Calculating the belief distribution over coincidence patterns. An HTM node calculates its degree of belief in a coincidence pattern by combining bottom-up, top-down, and temporal evidences according to the equations on the third row of Table 1. This corresponds to the operations of the rectangle marked (3) in Figure 2(B). The top-down input to the node is a vector of length equal to the number of Markov chains of the node. The output of this computation is the belief-vector over the coincidence patterns, in this case, a vector of length 5.
The belief calculation, described in Equation 6, has almost the same form as the forward dynamic programming Equations 4. The state variablebhas the same form as the state variableaand a very similar update equation. The only difference between these two is the multiplication by a top-down factor P(gkj
z
e0) in the
belief calculation equations. Therefore, the neuronal implemen-tation of the dynamic programming part of the belief calculation equation is very similar to that of the forward dynamic programming variable a. This implementation is shown in Figure 5. The filled-circle neurons correspond to the circle neurons in the forward calculation. Note that, in contrast to the circle neurons in Figure 4, the filled-circle neurons now also have a top-down multiplicative input that corresponds toP(gkj
z
e0).
The pentagon neurons in Figure 5 are the belief neurons. These neurons pool over the activities of the same coincidence neurons in different Markov chains to calculate the belief value for each coincidence pattern. This operation corresponds to the X
gk operation in Equation 6. Note that the operation of the pentagon neuron is different from that of the rectangle neuron in Figure 4. The rectangle neuron pools over different coincidence patterns in the same Markov chain. The pentagon neuron pools over the same coincidence pattern in different Markov chains.
Calculating the messages to be sent to child nodes. The
step that remains to be explained is the conversion of the belief messages to the messages that a node sends to its children. This step is described by Equation 9 and corresponds to the operations performed by the rectangle marked (4) in Figure 2(B). The input for this operation is the belief vector. The outputs are the p messages that are sent to the child nodes. A message is sent to each child and the message describes the degree of certainty this node has about the child nodes’ Markov chains.
Figure 6 shows how this equation can be implemented using neurons. The input belief is fed to ‘hexagonal neurons’ that compute the messages for child nodes. Figure 6 shows two sets of hexagonal neurons corresponding to the two child nodes of this node. Each hexagonal neuron corresponds to a Markov chain of the child node. The left child node has 3 Markov chains and the right child node has 4 Markov chains. The outputs of these hexagonal neurons are the messages that are sent to the respective children.
The connections between the input and the hexagonal neurons encode the constituents of coincidence patterns. For example, the first input is connected to the hexagonal neuron representing the first Markov chain of the left child and to the hexagonal neuron
Figure 4. Markov chain likelihood circuit.The circuit for calculating the likelihoods of Markov chains based on a sequence of inputs. In this
representing the third Markov chain of the right child. This is because the coincidence patternc1is defined as the co-occurrence
of the first Markov chain from the left child and the third Markov chain from the right child. The hexagonal neurons calculate their outputs as a sum of their inputs as described in Equations 9 and 10.
The operation of the hexagonal neurons shown in Figure 6 can be thought of as the reverse of the operations performed by the diamond neurons that were described in Figure 3. The weights on
the inputs to both these kinds of neurons define the coincidence patterns. In the case of the diamond neurons, they calculate the probability over coincidences from the probability distribution over Markov chains from each child. The hexagonal neurons do the reverse; they calculate the probability distributions over the Markov chains from each child from the probability distribution over coincidence patterns.
Further considerations of belief propagation equations The equations in Table 1 are self-consistent and sufficient for some learning and inference tasks. However, they do not address several issues required for many real world problems. Specifically, they do not address how feedback from a parent node to a child node can influence the child node’s feed-forward output, and they do not address issues of specific timing. The following sections address these issues.
Role of feedback in the current model. Even though
feedback propagation in the current model does not affect feed-forward propagation, it plays an important role in understanding the evidence presented to a network. For example, for an image given as input to the network, feed-forward propagation results in a distribution at the top level about the objects that could be present in the image. Feedback propagation can then be used to identify the features in the input image that produced a particular hypothesis at the top, to identify whether a particular edge in the image belongs to an object or to the background, and to assign ownership of features if there are multiple objects in the scene. In the Results section we give examples of feedback propagation in the current model.
Role of feedback in loopy graphs. In the general case,
nodes in an HTM network will have overlapping receptive fields. This gives rise to HTM network structures where each node in the
Figure 5. Belief circuit.Circuit for calculating the belief distribution over coincidence patterns by integrating the sequence of bottom-up inputs
with the top-down inputs. The pentagon-shaped neurons are the belief neurons. These neurons pool over all the neurons representing the same coincidence in different Markov chains to calculate the belief value for each coincidence pattern. This circuit implements the Equation 6 in Table 1. doi:10.1371/journal.pcbi.1000532.g005
Figure 6. Feedback message circuit.The circuit for computing the
messages to be sent to children according to Equation 9. The two sets of hexagonal neurons correspond to the Markov chains of the two children of the reference node.
network can have multiple parents. Such network structures are ‘loopy’ because of the cycles in their underlying graphs. Belief propagation is theoretically guaranteed to give accurate results in non-loopy graphs. Even though theoretical guarantees do not exist for belief propagation in loopy graphs, it is found to work well in practice on many problems involving loops [32,33].
HTM nodes with multiple parents can be treated like the causal poly-tree structures described by Pearl [29]. Poly-tree structures imply that multiple higher-level causes influence a lower level cause. Belief propagation computations in poly tree structures have the property that the message from a child to a parent is influenced by the messages from all other parents to the child. This modifies the flow of information in the HTM node in Figure 2(b) by introducing an arrow between box 3 and box 2. Local poly-tree structures can produce loops if repeated in a hierarchy. These sources of loops are likely to be common in brains. Multiple top-down causes can be combined efficiently using the noisy OR-gate structures described in Pearl’s book [29].
For the sake of simplicity of exposition, we deal exclusively with singly connected (non-loopy) networks in this paper. It is straightforward to extend belief propagation in HTMs to include multiple parents for each node.
Role of feedback for attention. The propagation equations in Table 1 compute approximate posterior distributions at every node in the hierarchy given the evidence. Calculating the posterior distributions at every node is one type of query that can be answered using such propagation techniques. Making inferences about real world situations often requires more complex queries involving a subset of nodes. Pearl discussed this need in his book as a motivation for controlling attention [29] (page 319), ‘‘In many cases, there is a small set of hypotheses that stand at the center of one’s concerns, so the reasoning task can focus on a narrow subset of variables, and propagation through the entire network is unnecessary.’’
For example, one interesting query to answer is what would be the evidence in support of top-level hypothesis 1, if all other top-level hypotheses are assumed to be inactive. This is a form of top-down attention. It can be achieved using local computations by propagating down the influence of hypothesis 1, and inhibiting, at all levels, the bottom-up support that conflicts with the high level hypothesis. In the case of vision, such a mechanism can be used to pay attention to a single object when multiple objects are present in the scene. The top-down propagation of a higher-level hypothesis will, in this case, identify the lower level nodes and coincidence patterns that support the hypothesized object. Turning off all other nodes can increase or decrease the certainty in that hypothesis.
Another form of query that can be answered is to ask what other hypotheses might be active if the top-level hypothesis is considered to be inactive. For example, while recognizing a complex scene, it could be advantageous to not pay attention to an object that is already recognized so as to focus on other objects in the scene. This requires a mechanism that propagates down the currently active hypothesis and turning off all the evidence that supports this hypothesis exclusively.
Both of the above cases correspond to gating the bottom-up evidence using top-down activation. The gating signal at each node, corresponding to an activated top-level hypothesis, can be derived from the computed beliefs at that node. However, maintaining this gating during further computations requires external control mechanisms that are not part of the standard belief propagation machinery. There are several places where this gating can be applied, at the inputs to coincidences, at the coincidences themselves, or at the output of the Markov chains.
Incorporating variable speed and duration into the belief calculation. As expressed in the equations, the Markov chains
advance their state with every time tick and can model only sequences that happen at a particular speed. The prime enabler of sequential inference in those equations is the property that the outputs of the pre-synaptic neurons at time t is available at the lateral input of the post-synaptic neuron at timetz1, exactly at the time when the bottom-up activity of the post-synaptic neuron arrives. If this lateral activity is maintained at the lateral input of the post-synaptic neuron for a longer duration, the bottom-up input activity for the post synaptic cell do not need to arrive exactly at time tz1. The lateral input that is maintained in the post-synaptic cell can be extinguished when either sufficient bottom-up activity arrives at the post-synaptic cell to produce a ‘firing’ event or when a temporal window is exhausted after the pre-synaptic event. Such a mechanism that strengthens the correct sequence as long as the next event arrives within a temporal window after the previous event would enable variable speed sequential inference that is robust to local temporal warps. Achieving this in the equations requires writing the dynamic programming equations using events rather than time steps, where events are defined using thresholds on the combined lateral and bottom-up activity. Variable speed inference can be achieved with the same neuronal connectivity we showed for fixed speed inference if we assume that mechanisms for maintaining lateral activity and for determining event thresholds are implemented within each neuron. Further explication of this mechanism is left for future work.
Another element missing from the equations in the previous section is an explicit duration model associated with the states of Markov chains. In certain cases of temporal inference, the next event is expected at a precise time after the previous event rather than in a temporal window as discussed in the above paragraph. Music is one example. Humans also have the ability to speed up and slow down this specific duration mechanism. Several techniques exist for incorporating explicit duration models into Markov chains [34,35]. Some of these techniques introduce self-loops into the Markov chain states. However, self-self-loops lead to an exponential duration probability density that is inappropriate for most physical signals [35]. Instead, we assume that durations are signaled to a node by an external timing unit that determines the rate of change of the signals using some system-level measure-ments. This means that the state change computations will have two components. The first component, as described in the previous sections, determines the distribution of the next state without considering when exactly that distribution is going to be active. The second component, the external timing signal, determines when the belief distribution is going to be active.
Figure 7 is similar to Figure 5 with the addition of a variable time-delay mechanism. Two types of belief neurons are shown. The pentagonal neurons, previously shown in Figure 5, calculate the node’s belief, and rounded rectangle neurons represent the belief at a particular time delay. The outputs of the rounded rectangle neurons are passed through an external variable delay unit. The rounded rectangle neurons act as a gate that opens only when a timing signal and a belief value are both available at its inputs. The activation of these neurons triggers the next timing cycle. The timing signal is used to gate theaand bcalculations. Only the gating of b calculation is shown in the figure. The external timing circuit achieves the effect of a specific duration model whose tempo can be changed.
Results
on input and output layers, intra- and inter-laminar connections and placement of cell bodies and dendrites. Assignment of a particular function to a particular layer imposes constraints on what functions can be performed by other layers. The challenge is to find an organization that is self-consistent in the sense that it implements the belief propagation equations while conforming to the constraints imposed by biology.
Our working hypothesis can be stated simply: The cortical circuits implement the HTM belief propagation equations described in Table 1. A hypothetical neuronal implementation of these equations was described in the previous section. Under the assumption that the cortical circuits are implementing these equations, what remains to be explained is how the abstract neuronal implementation of the previous section is physically organized in the layers and columns of actual cortical anatomy. This is accomplished by comparing the abstract neural imple-mentations with anatomical data. We describe the results in two stages. First we describe the high-level mapping between the neocortical hierarchy and the HTM hierarchy. Then we describe
how the circuits based on HTM belief propagation equations can be mapped to cortical columns and laminae.
Mapping between neocortex hierarchy and HTM network hierarchy
An area of cortex can be thought of as encoding a set of patterns and sequences in relation to the patterns and sequences in regions hierarchically above and below it. The patterns correspond to the coincidence patterns in an HTM node and the sequences correspond to the Markov chains.
An HTM Node, as described earlier in this paper, encodes a set of mutually exclusive patterns and Markov chains. A region of cortex that has several patterns simultaneously active will be implemented using several HTM nodes. Figure 8(D) shows the HTM implementation of the logical cortical hierarchy shown in 8(C). This arrangement corresponds to one of the basic organizing principles of the visual system where neurons in higher-level visual areas receive inputs from many neurons with smaller receptive fields in lower-level visual areas [36]. In addition, due to the
Figure 7. Timing circuit.The same circuit as shown in Figure 5 with the addition of circuitry for incorporating variable time delays between
elements of the Markov chains. The pentagon neurons represent the belief at each node. The rounded rectangle neurons represent the belief at each node at the appropriate time delay. An external variable time delay mechanism provides time duration information to all the neurons involved in encoding sequences.
temporal nature of HTM, this arrangement corresponds to a temporal hierarchy analogous to the kind reported by Hasson and colleagues [37]. In this highly simplified mapping, the area V1 is implemented using 4 HTM nodes while area V2 is implemented using 2 HTM nodes. Typically, the number of non-exclusive patterns that needs to be maintained decreases as you ascend in the hierarchy. Therefore, higher-level cortical regions can possibly be modeled using a fewer number of HTM nodes. Note that this is a representative diagram. A cortex-equivalent implementation of V1 and V2 could require several thousand HTM nodes for each cortical area and the receptive fields of the nodes would typically be overlapping.
The coincidence patterns and Markov chains in an HTM node can be represented using random variables. A cortical column can be thought of as encoding a particular value of the random variable that represents the coincidence patterns in the HTM node. The feed-forward and feedback connections to a set of cortical columns carry the belief propagation messages. Observed information anywhere in the cortex is propagated to other regions through these messages and can alter the probability values associated with the hypotheses maintained by other cortical columns. In HTMs these messages are computed using the mathematics of Bayesian belief propagation as we described earlier.
A detailed proposal for the computations performed by cortical layers
Our proposal for the function, connectivity and physical organization of cortical layers and columns is shown in Figure 9. This figure corresponds to the laminar and columnar cortical circuit implementation of the belief propagation equations for the reference HTM node in Figure 2. Figure 9 was created by arranging the neurons of the abstract neuronal implementation of HTM belief propagation into columns and laminae in such a way that the resultant circuit matched most of the prominent features found in mammalian neocortex. In the following sections we
de-construct this picture and examine the anatomical and physiolog-ical evidences for the specific proposals. This will also illuminate the process that we went through to arrive at the circuit shown in Figure 9.
The circuits in Figure 9 provide an exemplar instantiation of the Bayesian computations in laminar and columnar biological cortical circuits. Several plausible variations and exceptions of this circuit can be found because of the degrees of freedom in the implementation of the belief propagation equations and because of the incompleteness of anatomical data. We will tackle some of these exceptions and variations as they come up in the appropriate context and also in the Discussion section.
Columnar organization. The cortical circuit shown in
Figure 9 is organized as 5 columns corresponding to the 5 coincidence patterns in the reference HTM node that we started with. The neurons in each column represent some aspect of the coincidence pattern that the column represents. For example, the neurons in layer 2/3 represent the coincidence pattern in the context of different sequences, whereas the neurons in layer 6 represent the participation of the coincidence pattern in the calculation of feedback messages. The 5 columnar structures shown represent a set of 5 mutually exclusive hypotheses about the same input space. For example, these columns can correspond to a set of columns in the primary visual cortex V1 that receive input from a small area of the visual field. The 5 coincidence patterns might correspond to different orientations of a line. If the receptive field is small enough, the different orientations can be considered mutually exclusive - the activity of one reduces the activity of the other. This kind of columnar organization is typical in biology [38,39].
In the idealized cortical column model, each different aspect that needs to be represented for a coincidence pattern is represented using a single neuron. For example, there is exactly one neuron representing coincidence pattern 1 in the context of Markov chain 1. This means that there is no redundancy in this idealized cortical representation. Nothing about the computation or the representation changes if we replicate each neuron in this
Figure 8. Mapping between neocortex hierarchy and HTM hierarchy.(A) Schematic of neocortex inside the skull. The neocortex is a thin
sheet of several layers of neurons. Different areas of the neocortical sheet process different information. Three successive areas of the visual hierarchy – V1, V2 and V4 – are marked on this sheet. The connections between the areas are reciprocal. The feed-forward connections are represented using green arrows and the feedback connections are represented using red arrows. (B) A slice of the neocortical sheet, showing its six layers and columnar organization. The cortical layers are numbered 1 to 6: layer 1 is closest to the skull, and layer 6 is the inner layer, closest to the white matter. (C) Areas in the neocortex are connected in a hierarchical manner. This diagram shows the logical hierarchical arrangement of the areas which are physically organized as shown in (A). (D) An HTM network that corresponds to the logical cortical hierarchy shown in (C). The number of nodes shown at each level in the HTM hierarchy is greatly reduced for clarity. Also, in real HTM networks the receptive fields of the nodes overlap. Here they are shown non-overlapping for clarity.
circuit a few times, while maintaining their connectivity. A coincidence that is represented by a single neuron in our cortical column can be represented by a cluster of laterally interconnected neurons.
One prediction of our model is that many of the connections within a vertical column of cells can be established without any learning. Figure 10(A) shows a single idealized column. The connections within this column that can be established a-priori are shown in black. These connections act as a backbone for carrying out belief propagation computations. This feature makes our idealized cortical column a good candidate to be a developmental feature. The idealized cortical column in Figure 10(A) can correspond to what is known as the mini-columns or ontogenetic columnsof the cortex [40]. Mini-columns are developmental units that contain about 80 to 100 neurons. By the 26th gestational week, the human neocortex is composed of a large number of
mini-columns in parallel vertical arrays [41]. In real brains we would not want to represent something with a single cell. Therefore, we assume that in real brains the basic computational column will consist of many redundant cells bound together using common input and short-range intra-laminar connections result-ing in a column as shown in Figure 10(B) [41].
For the rest of the discussion we will focus on the idealized cortical column and the idealized cortical circuit with no redundancy.
Layer 4 stellate neurons implement the feed-forward
probability calculation over coincidence patterns. The
excitatory neurons in layer 4 of the cortex consist primarily of star-shaped neurons called stellate neurons and pyramidal neurons [42]. Layer 4 is generally accepted as the primary feed-forward input layer to cortical regions [2]. In the cat primary visual cortex, the outputs from the retina pass through the lateral geniculate
Figure 9. A laminar biological instantiation of the Bayesian belief propagation equations used in the HTM nodes.The circuit shown
here corresponds exactly to the instantiation of the reference HTM node shown in Figure 2. The five vertical ‘columns’ in the circuit correspond to the 5 coincidence patterns stored in the reference node. Layers 1 to 6 are marked according to the standard practice in neuroscience. Emphasis is given to the functional connectivity between neurons and the placement of the cell bodies and dendrites. Detailed dendritic morphologies are not shown. Axons are shown using arrow-tipped lines. Feed-forward inputs and outputs are shown using green axons and feedback inputs and outputs are shown using red axons. Whether an axon is an input or output can be determined by looking at the direction of the arrows. The blue axons entering and exiting the region represent timing-duration signals. ‘T’ junctions represent the branching of axons. However, axonal crossings at ‘X’ junctions do not connect to each other. Inter-columnar connections exist mostly between neurons in layer 2/3, between layer 5 cells, and between layer 6 cells. The inter-columnar connections in layer 2/3 that represent sequence memories are represented using thicker lines.
nucleus (LGN) of the thalamus and then terminate on layer 4 stellate cells. Most of these connections are known to be proximal to the cell body and can drive the cells. The major projection (output) of layer 4 stellate neurons is to layer 3 cells [15].
We propose that the layer 4 stellate cells implement the probability calculation described in Equation 2 and shown in Figure 3. This means that layer 4 neurons are coincidence detectors and that the synapses of the layer 4 neurons represent co-occurrence patterns on its inputs.
We realize this is a dramatic simplification of layer 4 cell connectivity. It does not address the very large number of synapses formed on distal dendrites, nor does it address the fact that many feed-forward connections from Thalamus terminate in layer 3 cells and that in some regions of cortex layer 4 is greatly diminished. These facts can be supported by HTM theory. The horizontal connections between layer 4 cells can implement spatial pooling or temporal pooling without timing. Layer 3 cells can also act as coincidence detectors of inputs from thalamus that make proximal connections, and layer 3 cells can take the full burden of coincidence detection. However, we choose to present the simplest explanation of layer 4 cells for clarity and discuss some of the variations in the Discussion section.
In Figure 9, the layer 4 neurons are shown in red. The inputs to these neurons are the outputs of lower levels of the cortical
hierarchy, possibly routed through the thalamus. It is easy to verify that the connections of these neurons correspond to the ‘diamond’ neurons in our belief propagation implementation shown in Figures 3 , 4 and 5. Note that in the implementation of the belief propagation equations shown in Figures 4 and 5, the neurons that calculate the probability distribution on coincidence patterns (the diamond neurons) have only feed-forward inputs. This is in contrast to many other neurons that receive feed-forward, feedback and lateral inputs. In neuroscience, it is accepted that the feedback inputs to a cortical region generally avoid layer 4 [2]. This is consistent with our proposal for the function of layer 4 neurons.
Making layer 4 correspond to the feed-forward computation of the probability over coincidence patterns imposes some constraints on the computational roles for other layers. For example, the major projection of layer 4 is to layer 3. This means that any computation that requires major inputs from layer 4 will need to be done at layer 3 and should match the general characteristics of layer 3. The proposals for layer 3 computations, described in a subsequent section, match these constraints.
Layer 1: The broadcast layer for feedback information
and timing information. Feedback connections from higher
levels of the cortex rise to layer 1. The recipients of these connections are the cells with apical dendrites in layer 1. Layer 1 is comprised mostly of axons carrying feedback from higher levels of cortex, axons from non-specific thalamic cells, apical dendrites, and a minor concentration of cell bodies [42].
To remain consistent with this biological data, the layer 1 in our mapping will be the ‘broadcast’ layer for feedback and timing information. The axons carrying feedback information P(Gjez
) will be available at layer 1 and accessed by the apical dendrites of neurons that require this information. In addition, the availability of a timing signal at layer 1 is assumed. The purpose of this timing signal is discussed in a subsequent section where we discuss the layer 5 cells.
Layer 2/3 pyramidal cells: Sequence memory, pooling
over sequences, incorporating feedback information. The
primary inter-laminar excitatory input to layer 2/3 is from the stellate cells of layer 4. In addition, the layer 2/3 neurons receive excitatory inputs from other layer 2/3 neurons via extensive lateral connections [43]. Many layer 2/3 neurons project to higher levels of cortex and to layer 5 [44].
We propose three different roles for the layer 2/3 pyramidal neurons in cortical circuits: (1) Calculation of feed-forward Markov chain (sequence) states, (2) Projection of Markov chain information to higher level cortical areas, and (3) Computation of sequence states that incorporate feedback information. We now consider each proposal in detail and then examine anatomical evidence in support of these circuits.
1.Pyramidal cells for calculating feed-forward
se-quence states:The pyramidal neurons shown in green in
Figure 9 implement the Markov chain sequences and the dynamic programming computations for feed-forward sequen-tial inference. These neurons correspond to the ‘circle neurons’ that we described in the Model section and implement the dynamic programming Equation 4 in Table 1. These pyramidal neurons receive ‘vertical’ excitatory inputs from the outputs of layer 4 stellate neurons and ‘lateral’ inputs from other pyramidal cells within layer 2/3. Circuits in layer 2/3 of Figure 9 show our proposal for how Markov chain sequences are implemented in biology. The green pyramidal neurons with blue outlines and blue axons correspond to Markov chain g1in Figure 4 and the green pyramidal neurons with magenta
Figure 10. Columnar organization of the microcircuit. (A) A
single idealized cortical column. This idealization could correspond to what is often referred to as a biological mini-column. It is analogous to one of the five columnar structures in Figure 9. (B) A more dense arrangement of cells comprising several copies of the column (A). Although we typically show single cells performing computations, we assume there is always redundancy and that multiple cells within each layer are performing similar functions.
outlines correspond to Markov chaing2in Figure 4. The axons
from these pyramidal cells cross column boundaries and connect to other pyramidal neurons that belong to the same sequence. Since these connections correspond to learned sequence memories, they will be very precise about which columns and which specific neurons within these columns they target.
2.Pyramidal cells that project to higher order cortex:
The next issue we want to address is how the Markov chain identities are sent to higher level cortical regions. We see several possibilities. One is to use a second set of pyramidal cells in layer 2/3. These pyramidal cells correspond to the Markov chain identities and get excitatory inputs from the layer 2/3 pyramidal cells that belong to the same Markov chain. This second set of pyramidal neurons in layer 2/3 corresponds to the rectangle neurons in Figure 4. These neurons send their outputs to higher-level cortical regions. In Figure 9, these pyramidal neurons are shown in blue color in layer 2/3 and send their axons down to the white matter to reach higher cortical areas. The second proposal does not require a second set of neurons but instead relies on long lasting metabotropic responses of neurons. The cells in layer 3 which represent the individual elements in Markov chains will become active in turn as sequences are learned and recalled. We need a way of generating a constant response that persists as the individual sequence elements are traversed. If the layer 3 cells that represent the sequence elements project to metabo-tropic receptors in higher cortical regions, those destination neurons could stay active for the duration of sequences. Strong evidence suggesting which of these two, or other, mechanisms is used is lacking. It is a strong theoretical prediction that a mechanism must exist in each region of cortex for forming constant representations for sequences of activity. It is an area for further study to determine what is the most likely mechanism for this.
3.Pyramidal cells for computing sequences based on
feedback:In the Model section, we saw that a second set of
dynamic programming states were required for the calculation of the belief of coincidence patterns and as an intermediate step in deriving the feedback messages to be sent to the children. These neurons do the sequence computations while integrating feedback information from the higher layers. We propose a third set of pyramidal neurons in layer 2/3 for this purpose. These neurons correspond to the filled-circle neurons in Figure 5. In Figure 9, these neurons are represented using yellow colored pyramidal neurons in layer 2/3. The lateral connections of these neurons are similar to the lateral connections of the layer 2/3 green pyramids that we just described. However, these yellow layer 2/3 neurons also integrate feedback information from layer 1 using their apical dendrites in layer 1 as shown in Figure 9. A prediction arising from this mechanism is that two classes of neurons in layer 2/3 can be differentiated by the connections they make in layer 1. One class of layer 2/3 neuron will form layer 1 synapses with feedback axons from higher levels of cortex. The other class of layer 2/3 neuron will not form synapses with feedback axons, but will form synapses with axons from non-specific thalamic cells needed for timing (discussed more in a later section).
Now, let us examine the anatomical evidence that led us to these proposals. The major bottom-up input required for the above calculations is the feed-forward probability over coincidence patterns that was assigned to layer 4 neurons in a previous section. The major excitatory projection of layer 4 neurons is to
layer 2/3 neurons [45]. For example, L4 spiny neurons in the barrel cortex of the mouse are characterized by mainly vertically-oriented, predominantly intra-columnar, axons that target layer 2/ 3 pyramidal cells [46]. Note that the green and yellow neurons in Figure 9 receive inputs from layer 4 neurons that are in the same column.
Cells in layer 2/3 are known to be ‘complex’ cells that respond to sequence of motion or cells that respond invariantly to different translations of the same feature. Unlike cells in layer 4 that respond to more impoverished stimuli, cells in layer 2/3 of the visual and barrel cortices strongly prefer richer stimuli, such as motion in the preferred direction [47]. This is consistent with our proposal that most layer 2/3 cells represent different coincidence patterns in the context of different Markov chain sequences. They become most active only in the context of the correct sequence. In biology, it is found that axons of the layer 2/3 pyramidal neurons travel several millimeters parallel to the layer 2/3 – layer 4 boundary and re-enter layer 2/3 to make excitatory connections to pyramidal cells there [43,48]. This is akin to the blue and magenta axons that we show in Figure 9 and is consistent with the implementation of sequence memories and dynamic programming computations. The green neurons and the yellow neurons in Figure 9 correspond to this description and are assumed to encode states within sequences.
We show green and yellow layer 2/3 neurons in Figure 9 because we need to learn two sets of sequences. One set of sequences is used in feed-forward calculations and the other set of sequences is used in feedback calculations. In our figures the green neurons are feed-forward and the yellow neurons feedback. The yellow neurons need to have apical dendrites in layer 1 to receive feedback from higher cortical areas. The green neurons may also have apical dendrites in layer 1 to receive timing information. But the green feed-forward neurons should not make connections with the feedback signal. This is a theoretical prediction currently without experimental data for support or falsification.
The computation that the sequence state cells in layer 2/3 need to perform for inference involves a weighted sum of their lateral connections multiplied by a bottom-up input. We found several data points suggesting that neurons in layer 2/3 are capable of approximating a similar computation. Yoshimura et al [49] report that long distance horizontal connections to pyramidal cells in layer 2/3 exhibit different properties than those from vertical connec-tions. They found that, under depolarized conditions, the EPSP evoked by the activation of an individual input pathway (either horizontal or vertical, but not both) was smaller than that evoked without the depolarization. They also found that when both the vertical and horizontal inputs were driven simultaneously, the evoked EPSP was larger than the mathematical summation of the individual EPSPs. They concluded that this indicated multiplicative supralinear summation of EPSPs caused by simultaneous activation of long range horizontal and vertical inputs under depolarized conditions, and suggested that the observed nonlinear summation is attributable to the intrinsic membrane properties of the pyramidal cells or the synaptic properties of the inputs, rather than the properties of the global neuronal circuitry. Another study [50] suggested that the projections of layer 4 spiny neurons to layer 2/3 pyramidal neurons act as a gate for the lateral spread of excitation in layer 2/3.